Retrieving an NMR data file from the Bruker Spectrometers
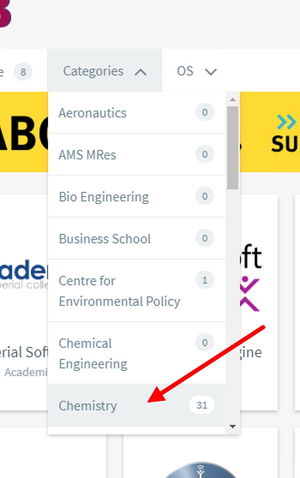
step 3On Windows 10, from the Software Hub panel, firstly select a chemistry filter
If you cannot see anything relating to the software hub, open a Web Browser and type: https://softwarehub.imperial.ac.uk/login as the URL and proceed to log in using your Imperial Credentials.
step 4From the list of chemistry programs (23) invoke MestreNova. Use the latest version (14.3) and NOT earlier versions.
OPTIONAL: As an alternative to Mnova, a brand new NMR analysis tool has recently appeared: https://www.nmrium.org/ In many ways this is simpler than using MestreNova but achieves the same result. Give it a go and let us know if you prefer it to Mnova!
On Windows 10,if you have been told your data is on the Bruker spectrometers, type run into the search box at the bottom left.
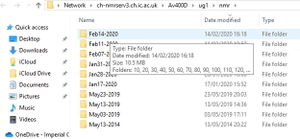
step 2aIn the run box, type (or copy/paste) \\icnfs-chnmr-backups.cc.ic.ac.uk\ch-nmr\Av400D\ug1\nmr and navigate down through to the folder allocated to your spectrum.
If this server does not respond, try instead \\icnfs3.cc.ic.ac.uk\ch-nmr\Av400D\ug1\nmr
If you have been told your data is on the Jeol Spectrometer use \\ce-nas01.ce.ic.ac.uk\CFNMR\Jeol400Export\chemteaching2\nmr
On MacOS, if you have been told your data is on the Bruker spectrometers, invoke Go/Connect to server from the Finder menus at the top and type e.g. smb://icnfs-chnmr-backups.cc.ic.ac.uk/ch-nmr/Av400D/ug1/nmr (followed by your College username and password)
If you have been told your data is on the Jeol Spectrometer, use instead smb://ce-nas01.ce.ic.ac.uk/CFNMR/Jeol400Export/chemteaching2/nmr
You might find it useful to drag the nmr folder that appears as a result of the above into your Finder favourites toolbar so that you do not have to repeat the above.
The location of your file is shown on the submission sheet for your week in Blackboard.
step 4aAlternatively, you can find your file from the date (week) submitted and by inspection of your initials associated with a spectrum (located in the top left of the spectrum, along with the date).
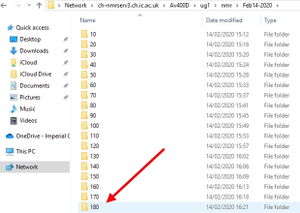
step 4aA way of checking your spectrum is to drag-n-drop a prospective folder (with a name such as 10 and with the correct date and initials) into the MestreNova window.
step 4aA spectrum will appear and initials will be shown in the top left of the spectrum. Continue until you find a spectrum with your initials. DO NOT copy a spectrum that is not yours!
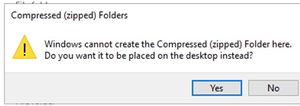
step 2bOnce you have found your folder, select that folder, right click to get the menu shown, from which you invoke Send To and then Compressed (zipped) folder. It will ask you Do you want it to be placed on the desktop itself? to which you reply Yes.
Mac users should right-click on the folder and invoke Compress. This produces the required .zip file.
You can next drag-n-drop the Bruker .zip data file from the Desktop or other location into the MestreNova window.
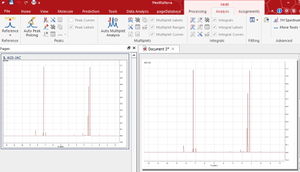
step 5A spectrum will (again) appear. Check again it has your initials associated with it.
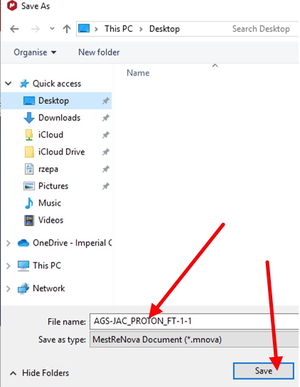
step65When you have finished inspecting the spectrum, save the data file using Save as in three forms. Take care to note where you are saving the files (on the desktop in this example).
an .mnova document,
a .jdx (JCAMP-DX document)
a .pdf (Acrobat document).
You will now have FIVE files you need to make your data deposition. These are:
a .zip file (or .jdf if a Jeol machine was used)
an .mnova document
a .jdx file
a .cdxml chemdraw document you prepared earlier
a .pdf file.
Crib sheet for Processing a spectrum using MestreNova
These are some short hints for how to quickly get the most out of your data. We assume you are analysing a proton spectrum.
Once you have opened the NMR folder using MNova, make sure the tab along the top of the program is showing NMR/Analysis
Go to Chemdraw, select the structure of your molecule and copy it/paste it into the Mnova Window. This will serve to remind you of the molecule
From 1H Spectrum in the second row of icons, select compound peaks. This will attempt to remove well known solvent peaks such as CHCl3 or H2O from your spectrum, which may help with subsequent integrations. You can also show only the solvents/Impurities peaks for information.
Using the toolbar on the right of the program, find the Increase intensity icon to make the spectrum higher
Using the toolbar on the right of the program, select the zoom in icon at the top and drag from the leftmost peak to the rightmost peak to expand the spectrum.
In the top NMR/Analysis icon collection, click on Manual integrate and select the left and right edges of a peak that you think you can identify. For example, an aromatic group or a methyl group.
A (green) integral curve will appear and below the peak a numerical integration of 1.00 will appear.
Place the cursor on the horizontal green line just above the numeric integration. Both the number and the integration curve go red. Now right click whilst the red is still showing.
Select Edit integral and normalize to what you think the integral should correspond to. Thus methyl = 3, a monosubstituted phenyl = 5, a methylene group = 2 etc.
Optionally, select linear correction and then autocorrect. This might improve the baseline and hence the integration.
You can now inspect the closest integer for each peak. This will only be approximate. It will also give the total integration which should ~correspond to the number of protons in your molecule. Obviously if your compound is a mixture of several molecules, you might not get integers for the peaks! But you can try to get integers if you identify all the peaks due to just one molecule.
At this stage you should save what you have obtained as a .mnova file
Only if you are keen, select the next tab in NMR/Assignments. You can now select a peak and assign it to a proton on the chemdraw diagram. Save the file again.