RW1515 MRD
Molecular Reaction Dynamics
Introduction
Potential energy surfaces are used to model simple reactions in the MATLAB computer programme. This is done through using two types of calculation, dynamics which takes into account oscillations of gaseous bonds and the minimum energy path which is used to evaluate transition states. The boundary conditions of AB distance and BC distance are changed to reflect a bonded pair and a bond that will form if there is a successful reaction. As well as this the momentum of the atoms in that bond are changed where a negative value indicates a momentum going towards each other. For example a momentum of -8 for AB represents a momentum of atom a approaching atom b.
The gradient of the potential energy surface is 0 at a minimum and a transition state structure. However, for a minima the second differential will be positive in both directions for r1 or r2. At a transition state the second differential will be positive in one direction and negative in the other.
Nf710 (talk) 11:50, 9 June 2017 (BST) This is not true in r1 and r2 you have to linearly combine these to take the normal modes and then you can get the reaction coord for which this statement is true.
H2 + H Reaction
Transition State
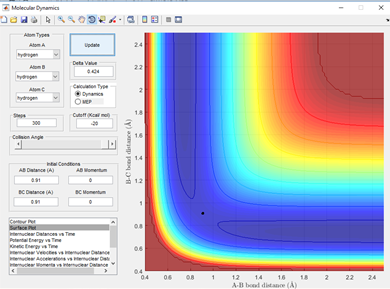
By setting the boundary condition of AB and BC momentum as 0 it can be seen that in this reaction a transition state is observed at an inter-nuclear distance of 0.91 Angstroms, represented by the black dot for both the A-B and B-C distances and this is shown in fig 1.2. This gives the best estimate of the transition state position (rts) as for 0.90 and 0.92 Angstroms the dot observed is physically larger in the transition state region.
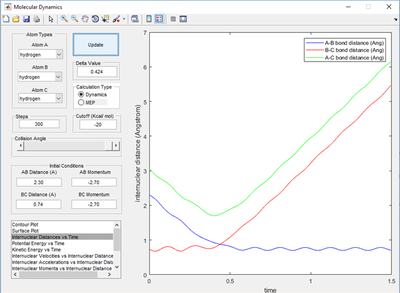
This can be further backed up by examining the internuclear distance vs time plot shown in fig 1.1 which shows that a cross-over region where r1=r2 is situated at roughly 0.9 Angstroms, it was setting the r1=r2 and giving them 0 momentum which allowed careful selection of this distance and validate that it is the transition state.
Reaction Path
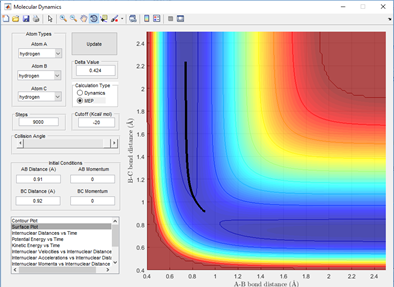
The reaction path also known as the minimum energy path (MEP) is a 'special trajectory' that can be followed which results from the transition state at infinitely slow motion. Using the MEP and setting the boundary conditions where the BC distance is slightly more (0.01 Angstroms) than the transition state structure, it can be seen that the products will form from this boundary. A line from this point traces the valley floor to the edge of the potential surface simply giving HA + HB-HC. This is not representative of the motion of gases through the air and is simply a snapshot from the transition state where there is no oscillation. This is shown in fig 2.1 by the lack of swaying in the bond distance through vibrations and inertial motion. This can be compared to the same boundary conditions but switching back to dynamics and the reaction path is similar but includes fluctuating of the bond distances, representing the inertial motion of the gases. This is shown in fig 2.2

Reactive Trajectories

From table 1.1 it can be seen that just small changes in momentum can have a drastic effect on the reactivity of a trajectory, as shown in the final two momentum example where a changes of 0.2 at a high momentum can cause a trajectory to go from unreactive to reactive.
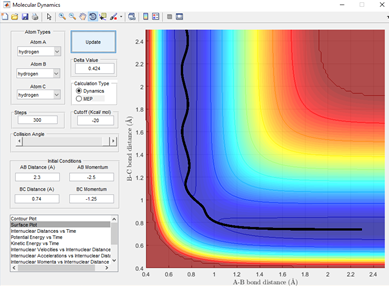
From figure 3.1, it can be seen that this trajectory with the momentum given in table 1.1 is a reactive trajectory. This is because the path of the reactant hydrogen A has sufficient energy to make it over the transition state and knock out the other hydrogen.

The Potential surface plot for fig 3.2 is an unreactive trajectory with a slightly lower momentum for the incoming hydrogen which results in not quite enough energy relative to the bonded hydrogens in order to get over the transition state.
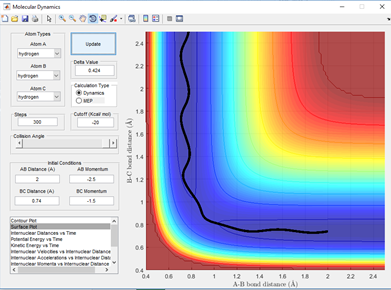
From fig 3.3 it can be seen this is a reactive trajectory. It is very similar to condition 1 and 2 but now the momentum of 2.5 of the incoming hydrogen is sufficiently high to get over the transition state and react with B-C. In the transition state the hydrogen C starts to be repelled by hydrogen A and B and is kicked out and the reaction is successful.
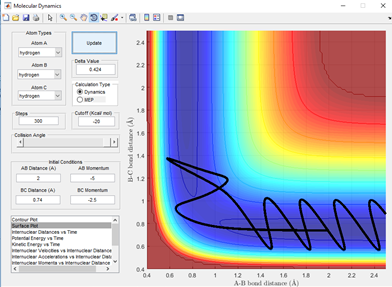
From fig 3.4 it can be seen that this is an unreactive trajectory. This is surprising given the high momentum of the incoming hydrogen atom, however this has a large vibration as a result of this causing large oscillations. This results in sufficient energy to cross the transition state, however as a result of the very large oscillations the hydrogen has too much energy relative to the hydrogens bonded and is repelled. This then does not have sufficient energy to return back and attempt a reaction again
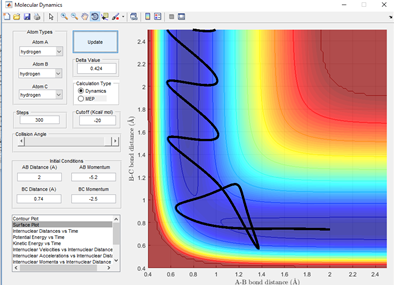
From fig 3.5 it can be seen that this is a reactive trajectory. This is surprising given the close momentum of the incoming hydrogen atom to condition 4. However, this has a large enough vibration to rebound after being repelled by BC. This results in sufficient energy the second time to cross the transition state.
Transition State Theory Approximations
In transition state theory in order to simplify the calculations and get an output for a reaction rate and reactivity, we make several assumptions. These are as follows: 1.There is no quantum mechanical effects that affect the energy of the system such as Quantum Tunneling-System obeys classical mechanics 2.Once the transition state is reached, the trajectory is reactive and it is the minimum energy pathway. 3.The energies follow the Boltzmann distribution in every degree of freedom which is 1/2KbT 4.All intermediates are sufficiently long-lived to reach a Boltzmann distribution of energies before proceeding to react with another intermediate or form the products.
As a result of some of these assumptions, at low temperature the Transition State theory often underestimates reaction rates and hence reactive trajectories as quantum tunneling effects are much more important at low temperature as it allows crossing of a energy barrier that classicaly wouldn't be available. At high temperature this wouldn't be as much of a problem as often the molecules have such high vibrational motion that they can overcome the activation barrier for a chemical reaction.
Furthermore, at high temperatures the transition state theory often overestimates the reaction rates and hence the reactive trajectories as it assumes that the reaction will proceed via the lowest energy saddle point. However, at high temperatures there are may more vibrational modes and overall kinetic energy of molecules and they may proceed via higher energy transition states and not the minimum energy one as assumed by transition state theory.
H-F-H System
PES Inspection
F + H2 and H + HF
In the F + H2 reaction, a visual inspection of the surface plot shows that the products have a lower energy than the reactants so therefore it can be inferred that this is an overall exothermic reaction.

In the H + HF reaction, a visual inspection of the surface plot shows that the energy of the products is higher than the reactants and therefore, this is an endothermic reaction.
This information corresponds to the idea that the bond strength of H-F is higher than the bond strength of H-H. This means that energy has to be put into the system to form a H-H bond and break the H-F bond. Which corresponds to the same idea that energy is released in the forming of the H-F bond and breaking the H-H bond. As overall, more energy is released when H-F is formed than is put in to break the H-H bond.
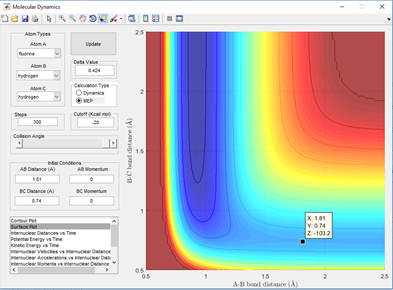
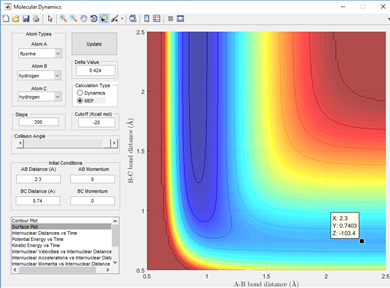
In the figures shown below, an approximate position of the transition states can be attributed to when potential energy is at its maximum value. The rough activation energy of these reactions can be estimated from the surface plot and potential energy vs time plot. This is done by following the reaction animation and bond distances to locate a rough estimation for when the bonds are in transition. Then by giving the atoms 0 momentum, the transition state can be located using the sphere on a mountain analogy. That is no external force acts on that sphere it will stay and this will show on the surface plot as a small dot as the bond distances and energies only oscillate. When treated as the minimum energy path there will be no motion and if it is a true transition state, by adding 0.01 Angstroms to one distance, the sphere will be pushed down the hill to either reactants or products. Using this technique the transition state was found at a F-H distance of 1.8105 Angstroms and at a H-H distance of 0.74 Angstroms. This is shown below in fig 4.0

Using the minimum energy path to find the energy of the reactants an estimation of -103.4 Kcal/Mol can be pinpointed by setting a cursor over that point when the F and H-H separation is large. The energy of the transition state can also be estimated using the same technique but pinpointing the energy at the transition state distance separation. This is found to be -103.2 Kcal/Mol and is shown below in figure 4.1 and 4.2.
Using this the activation energy of the F + H-H system can be found to be -103.2--103.4 Kcal/Mol = +0.2 Kcal/Mol
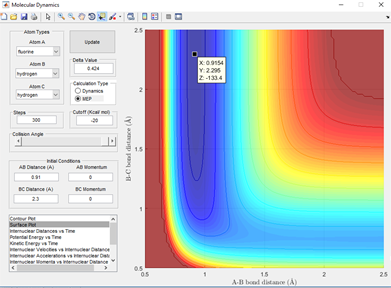
Using the surface and potential energy plots of the H + H-F system for when the reactants are at large separation and for the transition state as for the F H-H system. The potential energy of the reactants can be estimated to be -133.4 Kcal/Mol and the energy of the transition state can be estimated to be -103.2 kcal/Mol which is logical because it is expected that this should be the same potential energy as already worked out for the transition state which resemble the products of the F + H-H reaction. The newly worked out reactant energy is shown below in figure 4.3.
Therefore the activation energy of the H + H-F system can be found to be -133.4--103.2 kcal/Mol = +30.2 kcal/Mol
The potential energy vs time was used and could confirm these were minimum points of energy which was indicated at the transition state with an 'S-type curve' which represents the minimum energy for both the reactants and the transition state at the plateau points.
Energetics of Reaction System after collision
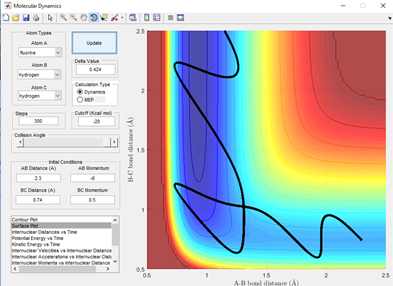
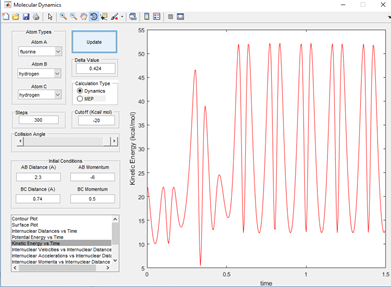
Once the new bond has been formed in the reaction and the other atom is kicked out. A large degree of oscillating potential is observed in the product well on the surface plot. This is shown in fig 5.1 for a generic F+H-H system. This shows there is even a larger degree of oscillation than in the reactants. This is because the incoming fluorine puts a lot of energy into the system and it can be seen below that as the reaction time proceeds, there is an increase in the kinetic energy of the products which is shown below in fig 5.2
In order to keep with the laws governming energy exchanges. This increase in extra kinetic energy has to be countered with a loss in some other form of energy in order to be keeping with the law 'Energy cannot be created or destroyed, only transferred from one form to another'. This law is held up by this system as it can be seen from a potential energy vs time plot that there is a decrease in potential energy matching the increases in kinetic energy. They are fluctuating with respect to one another. This is therefore the mechanism of release of energy from the system that has been generated from the reaction. The potential energy vs time plot is shown below in fig 5.3. As this shows evidence that kinetic energy is produced in the reaction. This is equal to an increase in molecular vibrations of atoms in the molecule/ system. This would be proportional to an increase in heat energy changes in the reaction. Therefore, a calorimeter would be able to measure the heat energy change of the reaction and it would be observed that as the reaction proceeded this would increase.

Varying Momentum and Hammonds Postulate Applications
Varying the Hydrogen gas momentum between high negative and positive values for a constant H-F momentum always give larger amounts of oscillation in the products section of the potential well. It can also be seen that the reaction trajectories are not reactive for high values of the H-H momenta even at -3, which is surprising given this energy put into the reaction is much higher than the activation energy barrier for a successful reaction. Moreover, when setting the H-F momentum slightly higher to -0.8 and making the H-H oscillation very small at around 0.1, a successful reaction is observed even though overall there is less energy being put into the system. Therefore it seems a large amount of H-H vibration inhibits the reaction despite adding a large amount of energy, while adding a small amount of momentum to the F atom allows the reaction to take place at a lower overall energy. One explanation could be that as the H-H's possess more kinetic energy, that when the incoming fluorine comes in on an approach trajectory, the hydrogen has sufficient energy to vibrate to a longer bond distance but then bounce back and repel the fluorine. This doesn't explain however, why for a reaction condition of pFH = -0.5 and pHH = 0.2 that the reaction is unsuccessful. Therefore, a small increase in the momentum to pFH=-0.8 and a large reduction in the pHH of the hydrogens to 0.1 was used to examine what effect a small increase in the fluorine/hydrogen momentum on a particular approach trajectory would be. Surprisingly, this was a reactive trajectory and this is shown below in fig 6.1. While there is large degree of bond making and forming and oscillatory behaviour in the Transition state region, it is a successful reaction. Possibly indicating that an increase in fluorine momentum and a small amount of hydrogen momentum are required for a successful reaction.

Polanyi's rules state that vibrational energy is more efficient at promoting a late barrier reaction than translation energy is[1]
for the reaction HH+F to form H-F + H the barrier is early hich can be seen by the early transition state on a surface plot where the transition state resembles the reactants more than the products. This is backed up as the F-H bond length are still a long way from an average H-F bond length of 0.91 Angstroms when the reaction is already at a saddle point in potential energy. Therefore, a low vibrational energy in H-H leads to reaction. The incoming Fluorine also needs to have high energy but not so high that it has enough vibrational energy going into the collision that it overpowers the bonding ability of the hydrogen atom to it. This is shown below in 3 examples in fig 6.2-6.4.
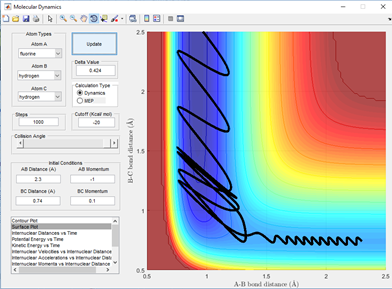
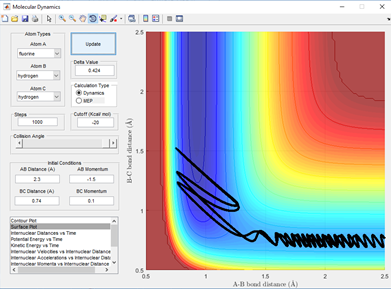
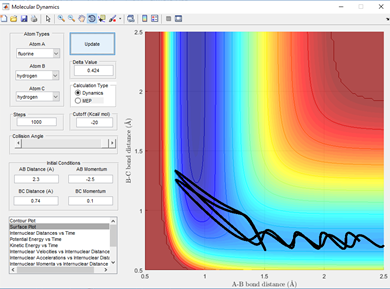
The opposite will be true for the reverse reaction which is the reaction of H-F + H. As here the barrier is late indicating that the transition state more closely resembles the products of the reaction where the H-F bond is long and the H-H bond is pretty much what a normal H-H bond length would be. A high vibrational energy of H-H as polanyi's rules predict will lead to reactive trajectories and hence the products of a successful reaction. This is shown below in fig 7.1 and 7.2 comparing two momenta and hence vibration energy sets for a reactive and unreactive trajectory of the H + H-F reaction.

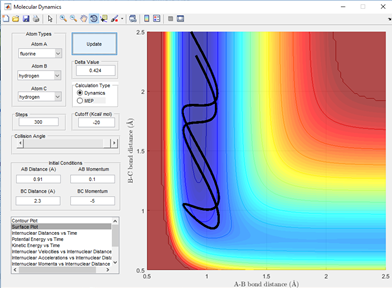
Nf710 (talk) 12:27, 9 June 2017 (BST) Well done for proving Polyanis rules, you could have done the reverse reaction to less vibration energy. You could have kept the report slightly more concise. but otherwise a good report.
References
<references> [1]
