RG1712
Introduction
The aim of this exercise is to conduct an in-depth investigation of the computational tools available for modelling organic molecules with a particular emphasis on their chiroptical properties. The biological activity of enantiomeric drug molecules has never been more important to pharmaceutical companies. In recent times, as computing power has increased and computational methodologies have become more advanced, a new tool is available to aid in the successful enantioselective synthesis of organic compounds. In the case of measurable properties such as optical rotatory power, the results of computation may even be used to corroborate the results of experiment. As such, the modern synthetic chemist would be well-advised to make use of this new avenue. The marriage of computation and traditional experiment enjoys enormous potential to enhance the chemical community's prescience in enantioselective synthesis.
Conformational Analysis using Molecular Mechanics
Introduction to Molecular Mechanics
Molecular Mechanics, in contrast to other computational techniques, differs in the way in which it arrives at an electronic energy for the molecule of interest. Ab Initio methodologies such as Hartree-Fock (HF) and Density Functional Theory (DFT) compute the electronic energy for a given set of nuclear coordinates explicitly to generate a potential energy surface 1. Molecular Mechanics, on the other hand, relies on parametric fitting of the nuclear coordinates to data obtained from either experiment or a higher level of computational theory. A number of parameter sets are available for fitting and these will often be indicated in the name of the method. As an example the suffix '94' in MMFF94 (Merck Molecular Force Field 1 indicates that the parameter set was released in the year 1994 1 .While the origin of all Ab Initio calculations lies with the electrons of the molecule and the associated Schrodinger equation, Molecular Mechanics methods may be seen to implement a more classical approach through direct consideration of the atoms. Although Molecular Mechanics calculations are often less computationally expensive, the drawback of such an approach is that quantum effects are often neglected 1. Nonetheless such a technique possesses an impressive utility in its ability to provide fast and approximately accurate energies for molecules. One may note striking similarities between the frameworks of Molecular Mechanics and general organic chemistry. In Molecular Mechanics atoms are divided into groups based on the type of bond, C-H for example, and are then subcategorised further into classes based on hybridisation. The assumption that bonds of the same type will show geometries that are independent of their molecular environment turns out to be quite a good one. Indeed, perhaps this should come as no surprise given that one of the fundamental axioms of organic chemistry states that functional groups exhibit reactivity that is more or less invariant on the precise details of the molecular form 1.
The Hydrogenation of Cyclopentadiene Dimer
Dimerisation - The Preferred Mode
| Molecule 1 | Molecule 2 | Molecule 3 | Molecule 4 |
|---|---|---|---|
 |
 |
 |
 |
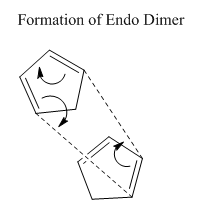
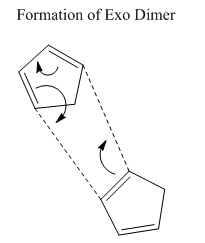
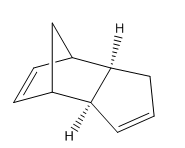
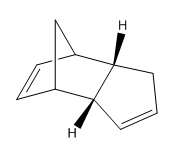
The first exercise illustrates how Molecular Mechanics may be used to determine whether a reaction is under thermodynamic or kinetic control. Knowing the experimentally observed product distribution one can carry out an energy calculation in order to determine the relative energies of the products. If it is the case that the calculated lowest energy product from the distribution is also the observed product of the reaction one would expect the reaction to be under thermodynamic control or indeed both thermodynamic and kinetic control. However, if the observed product is not the calculated lowest energy product one might suspect the reaction to be under kinetic control.
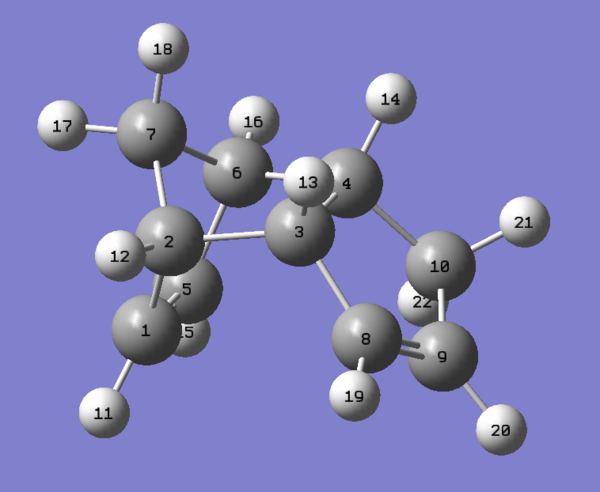
The dimerisation of cyclopentadiene is a reaction that has undergone extensive investigation in the literature. The mechanism involves a 4n + 2 thermal cycloaddition proceeding via a Huckel transition state. The two modes of dimerisation leading to the endo and exo products are illustrated in figures 1 and 2 respectively while the structures of the products themselves are given in table 1 and again in figures 3 and 4. The energies of molecules 1 and 2 were computed initially using three separate programs; Avogadro, ChemBio3D and Gaussview 5.0. The results, provided in table 2, emphasise the point that it is impossible to compare energies calculated using different programs directly. Each program possesses its own distinctive energy scale and so in order to ensure consistency the same program must be used for all calculations. This argument also applies to the level of theory used for a calculation. After performing computations with the three different programs it was decided that Avogadro would be used for subsequent calculations due to its relative ease-of-use.
| Program | Energy of Molecule 1 | Energy of Molecule 2 |
|---|---|---|
| Avogadro | 55.37325 kcal/mol | 58.19475 kcal/mol |
| ChemBio3D MM2 | 31.8766 kcal/mol | 33.9975 kcal/mol |
| Gaussian Mechanics UFF | 67.2599788711 kcal/mol | 69.6708433488 kcal/mol |
|
|
|---|
One may observe from the results of the energy calculation in table 3 that the total energy of the exo product is lower by 2.8215 kcal/mol. Geometry optimisations and energy calculations were performed using the MMFF94s force field method in conjunction with the conjugate gradient method for function minimisation. Conjugate gradient methods provide better convergence relative to the alternative steepest descent methods with the drawback that it is only possible to locate minima using such a method. This proves not to be a problem with the current calculations and so the conjugate gradient method represents the most logical choice. Despite the fact that the exo product is lower in energy, it is in fact the endo product that is observed experimentally, at least at normal temperatures 2. This outcome may be explained through the realisation that the reaction is under kinetic control. Indeed, the widely accepted theory is that secondary orbital overlap effects lower the energy of the transition state leading to the endo product 2. As can be seen in figure 1, the alkene fragment that is not participating in the cycloaddition on one cyclopentadiene molecule serves to stabilise the nascent double bond on the second molecule in the transition state. The fact that the exo product is obtained at very high temperatures provides evidence that it is the thermodynamic product of the reaction 2.
| Contribution | Molecule 1 | Molecule 2 |
|---|---|---|
| Total Bond Stretching Energy (kcal/mol) | 3.54456 | 3.45940 |
| Total Angle Bending Energy (kcal/mol) | 30.78036 | 33.33721 |
| Total Torsional Energy (kcal/mol) | -2.73278 | -0.2.96068 |
| Total van der Waals Energy (kcal/mol) | 12.79578 | 12.25305 |
| Total Electrostatic Energy (kcal/mol) | 13.01266 | 14.17129 |
| Total Energy (kcal/mol) | 55.37325 | 58.19475 |
The energy of the force field is composed of 5 main terms as shown in table 3. It should be noted that the out-of-plane energy term has not been considered as it provides a negligible contribution to the total energy in both cases. The values of each of these terms may be used to understand the structural features that make Molecule 1, the exo product, lower in energy than Molecule 2, the endo product. Of the contributions to the total energy, the total angle bending displays the greatest deviation between products, being 2.56 kcal/mol larger for the endo product. The bending energy is the energy that is needed to distort the angle made by 3 bonded atoms 1. Through an examination of the structures given in figures 3 and 4 one may quickly discern that the likely origin of the difference in angle bending energy in the two molecules lies with the geometries of the ring junction carbons. Bond angle measurements were taken by opening the .mol structure files from Avogadro in Gaussview 5.0. The results are presented in table 4.
| Linkage | Endo Dicyclopentadiene Bond Angle (degrees) | Exo Dicyclopentadiene Bond Angle (degrees) |
|---|---|---|
| C2-C3-C8 | 118.59 | 115.60 |
| C2-C3-H13 | 106.55 | 108.41 |
| C6-C4-H14 | 108.02 | 109.87 |
Given that the ring junction carbons are sp3 hybridised one may note a marked distortion from the ideal tetrahedral bond angle of 109.5 degrees for both molecules. The atoms labels of table 4 are given in figures 5 and 6. In the case of the exo product, the distortion of the angle described by the C2-C3-C8 linkage is less pronounced, being roughly 3 degrees closer to tetrahedral geometry than the corresponding angle in the endo product. Hence the Molecular Mechanics method has been used not only to calculate the energies of the two products but also to explain the origin of the energy difference.

An Analysis of the Hydrogenation Products
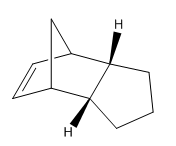
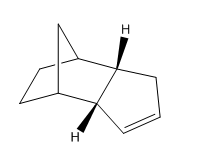
The general reaction scheme for the monohydrogenation of dicylopentadiene to dihydrododicylopentadiene (DHDCP is given in figure 7. The selective synthesis of DHDCP over its tetrahydrodicylcopentadiene (THDCP) analogue is a topic that has featured in the literature with a more recent example showcasing the use of Pd nanoparticles for selective monohydrogenation of dicyclopentadiene 3. This reaction too may be examined using Molecular Mechanics. Again, through the computation of the energies of the monohydrogenated products one can obtain the predicted thermodynamic product of the reaction. This being said one should always consult the literature before making such predictions. Experimental work has the potential to throw up unexpected results and it would be unwise not to pay heed to them.

| Contribution | Molecule 3 | Molecule 4 |
|---|---|---|
| Total Bond Stretching Energy (kcal/mol) | 3.31217 | 2.82309 |
| Total Angle Bending Energy (kcal/mol) | 31.93639 | 24.68541 |
| Total Torsional Energy (kcal/mol) | -1.47003 | -0.37830 |
| Total van der Waals Energy (kcal/mol) | 13.42904 | 10.63717 |
| Total Electrostatic Energy (kcal/mol) | 5.11946 | 5.14702 |
| Total Energy (kcal/mol) | 50.23777 | 41.25749 |
The chemical structures of molecules 3 and 4 are given in table 1. Energy calculations were once again performed using the MMFF94s level of theory in Avogadro in tandem with the conjugate gradient algorithm for optimisation. The results are shown in table 5. One may note that the monohydrogenated product with the norbornene double bond is higher in energy by 8.98 kcal/mol. Thus Molecule 4 might be hinted to be the thermodynamic product of monohydrogenation. On analysis of the various contributions to the total energy it may be seen that the two dominant contributors in this case are the angle bending and van der Waals terms. The latter gives some indication as to the non-bonding energy between atoms in the molecule. In other words the Van der Waals term compliments the electrostatic term in describing the covalent interaction energy that does not arise as a result of electrostatic energy due to atomic charges 1. The MMFF level of theory implements a Lennard-Jones type potential. The empirical constants and exponents for this potential are taken from data obtained in studies of rare gaseous atoms 1.
| Molecule 3 | Molecule 4 | ||||||
|---|---|---|---|---|---|---|---|
|
|
| Molecule | Feature |
|---|---|
| 3 | Bond Angle (Degrees) C5-C1-C2 = 107.24 |
| 3 | Bond Angle (Degrees) C5-C1-C11 = 126.38 |
| 3 | Van der Waals Distance (Angstrom) H11-H12 = 2.61 |
| 4 | Bond Angle (Degrees) C8-C9-C10 = 112.88 |
| 4 | Bond Angle (Degrees) C2-C5-C1 = 102.95 |
| 4 | Van der Waals Distance (Angstrom) H12-H13 = 2.50 |

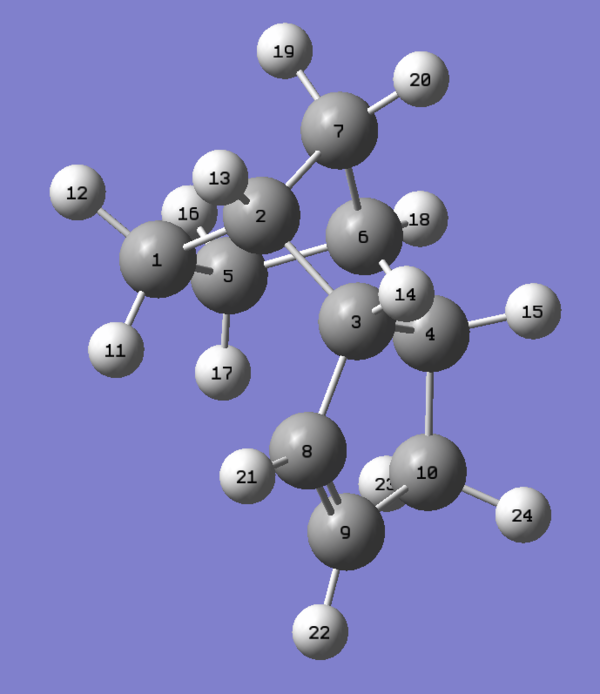
Information on the geometries of the two hydrogenated products was once again obtained by importing the .mol files into Gaussview 5.0. The largest contribution to the angle bending term in table 6 is highly likely to originate from the C5-C1-C2 linkage shown in figure 10 corresponding to the norbornene double bond. As one can see from the results presented in the table, the angle of 107.24 degrees is very much compressed relative to the ideal angle of 120 degrees for an sp2 carbon and so this will result in high energy angle strain 3. In comparison the C8-C9-C10 linkage shown in figure has an angle of 112.88 degrees, 5.64 degrees closer to the ideal of 120 degrees. Thus the cyclopentene double bond is less strained than the norbornene double bond accounting for the difference in angle bending energy. It has been reported by Skala and Hanika 5 that the hydrogenated cyclopentene product is in fact both the thermodynamic and the kinetic product of the reaction.
Which Atropisomer is more Stable?
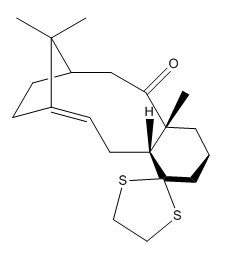
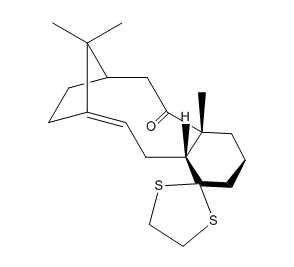
Figure 12 shows a key intermediate in the synthesis of the drug molecule Taxol. This intermediate was proposed by Paquette et al 6. The relative energy of the atropisomeric products shown will dictate the stereochemistry of addition to the carbonyl group in subsequent steps in the synthesis of Taxol. As such, it is important to know which of the two atropisomers will be obtained under the conditions of the reaction. Molecular Mechanics is used to compute the lower energy atropisomer and hence (maybe!) the thermodynamic product of the Oxy-Cope Rearrangement shown. Indeed Paquette's principle was that the establishment of a thermodynamic equilibrium would yield the lowest energy product exclusively 6 The calculations were performed at the MMFF94s level of theory and the results of the individual contributions to the energy are given in table 7. 4 distinct low energy conformations were found for each atropisomer comprising two chair and two twist-boat structures. These structures represent local minima on the potential energy surface. It was found in the process of carrying out the calculations that the conformation of the 6-membered ring dictated the overall energy of the molecule hence the reason for naming the local minima based on the conformation of the cyclohexane fragment in the tables below.

| Contribution | Chair A | Chair B | Twist-Boat A | Twist-Boat B |
|---|---|---|---|---|
| Total Bond Stretching Energy (kcal/mol) | 7.66046 | 8.20528 | 7.94310 | 8.46676 |
| Total Angle Bending Energy (kcal/mol) | 28.27840 | 34.09553 | 29.55517 | 33.97948 |
| Total Torsional Energy (kcal/mol) | 0.26823 | 3.70888 | 2.75559 | 6.62558 |
| Total van der Waals Energy (kcal/mol) | 33.13610 | 34.71858 | 34.67174 | 37.03457 |
| Total Electrostatic Energy (kcal/mol) | 0.30239 | 0.20415 | 0.32268 | 0.14205 |
| Total Energy (kcal/mol) | 70.54116 | 82.66261 | 76.28422 | 88.34056 |
| Contribution | Chair A | Chair B | Twist-Boat A | Twist-Boat B |
|---|---|---|---|---|
| Total Bond Stretching Energy (kcal/mol) | 8.69921 | 7.59059 | 7.84013 | 7.73903 |
| Total Angle Bending Energy (kcal/mol) | 22.01678 | 18.79130 | 21.10906 | 19.60251 |
| Total Torsional Energy (kcal/mol) | 5.77291 | 0.22653 | 4.40960 | 3.22152 |
| Total van der Waals Energy (kcal/mol) | 36.35491 | 33.29425 | 34.68360 | 35.01085 |
| Total Electrostatic Energy (kcal/mol) | 0.42507 | -0.05376 | -0.04710 | -0.04688 |
| Total Energy (kcal/mol) | 74.73553 | 60.55252 | 68.88457 | 66.32897 |
As may be seen from the information presented in tables 7 and 8 above the atropisomer with the carbonyl on the conformers of the atropisomer with the carbonyl group on the opposite face to the isopropyl bridge are in general lower in energy relative to their counterparts for the other atropisomer. For each conformer one of the two possible chair conformations has the lowest energy in both cases. This would be the expected outcome of the calculation given that in cyclohexane rings it is generally the case that the chair is energetically more favourable than the twist-boat conformation. However in the case of molecule 17 it is observed that one of the two chair conformations is in fact higher in energy than one of the twist-boat conformers. This may be rationalised by considering the location of the carbonyl relative to the hydrogens of the chair carbon. On examination of the structure of the abnormally high energy chair conformer it became apparent that there would be a significant repulsive interaction between the chair hydrogens and the carbonyl group. Hence this may be cited as the main reason for the particular instability of this conformer.
Hyperstable Alkenes
Both atropisomers considered in this exercise are examples of hyperstable alkenes. It has been noted by Paquette 7 that the presence of the double bond is responsible for the atropisomeric features of molecules 17 and 18. The corresponding alkanes are not atropisomers. In this case the presence of the bridgehead alkene provides a large enough barrier for the rotation of the carbonyl group such that isolation is possible. Hyperstable alkenes are defined by Maier et al 8 as being olefins that are more stable than their parent alkanes. In order to examine more closely the geometrical features that give rise to this unexpected stability the parent alkane of the lowest energy chair conformer of the downwards pointing carbonyl compound was optimised at the MMFF94s level of theory using Avogadro and compared with the olefin. The results are presented in table 9.
| Contribution | Chair B Saturated | Chair B Unsaturated |
|---|---|---|
| Total Bond Stretching Energy (kcal/mol) | 6.59857 | 7.59059 |
| Total Angle Bending Energy (kcal/mol) | 24.99257 | 18.79130 |
| Total Torsional Energy (kcal/mol) | 8.22306 | 0.22653 |
| Total van der Waals Energy (kcal/mol) | 31.14574 | 33.29425 |
| Total Electrostatic Energy (kcal/mol) | 0.000 | -0.05376 |
| Total Energy (kcal/mol) | 71.46292 | 60.55252 |
Both the torsional and angle bending energy terms show a marked difference on going from the olefin to the alkane. In order to observe the structural features that give rise to this disparity the .mol files were imported into Gaussview 5.0 and bond angles were measured. The values obtained may be found in table 10.
| Olefin | Saturated Analogue | ||||||
|---|---|---|---|---|---|---|---|
|
|
| Linkage | Bond Angle (Degrees) |
|---|---|
| C1-C2-C3 | 118.80 |
| C7-C2-C3 | 119.96 |
Spectroscopic Simulation using Quantum Mechanics
 |
 |
|---|
| Contribution | Molecule 17 Chair | Molecule 17 Twist-Boat | Molecule 18 Chair | Molecule 18 Twist-Boat |
|---|---|---|---|---|
| Total Bond Stretching Energy (kcal/mol) | 15.54108 | 15.79037 | 14.99919 | 14.39513 |
| Total Angle Bending Energy (kcal/mol) | 32.44685 | 31.65250 | 30.95279 | 28.01941 |
| Total Torsional Energy (kcal/mol) | 11.49253 | 13.82253 | 9.67927 | 14.09143 |
| Total van der Waals Energy (kcal/mol) | 51.30227 | 53.32757 | 49.38325 | 50.60224 |
| Total Electrostatic Energy (kcal/mol) | -7.64613 | -7.20194 | -6.05881 | -6.38635 |
| Total Energy (kcal/mol) | 104.35310 | 108.87272 | 100.49946 | 102.22434 |
NMR Spectra and Fluxional Processes
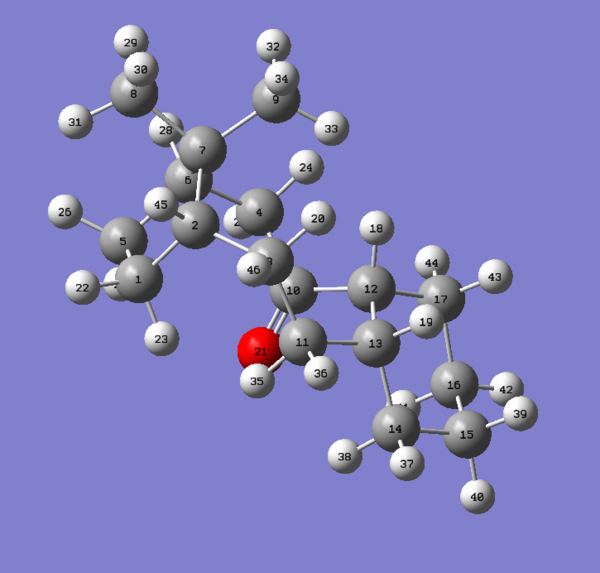
In Paquette's synthesis of molecule 17 an isomerisation was observed in which the carbonyl group of molecule 17 swapped faces in the 10 membered ring 6. This is an example of an atropisomerisation. An atropisomer is a curious case of a stereoisomer in which isolation of a rotamer becomes possible because the barrier to rotation about a bond is so high such that interconversion between conformers occurs at a very slow rate 9 Seeing as both atropisomers are isolable it would be possible to compute NMR spectra for both compounds in order to compare against the experimental literature. Following the computation of the energies of the low energy conformers of both compounds 17 and 18 it was decided that an NMR analysis of compound 18 would be performed at the DFT level of theory. The reason for this decision lies in the fact that the lowest energy conformers of molecule 18 are very close in energy. As such it is highly likely that the observed NMR spectrum would show a superposition of the individual spectra of the chair and twist-boat conformations. Hence a comparison of the computed and experimental values could show up a key drawback of the calculation: its inability to account for fluxional processes in generating a spectrum.
| Atropisomer | Conformer | Sum of Electronic and Thermal Energies (Hartrees) | Gibbs Free Energy Difference relative to Molecule 18 Chair (joules/mol) | Equilibrium Constant relative to Molecule 18 Chair | Equilibrium Constant relative to Molecule 17 Chair |
|---|---|---|---|---|---|
| Molecule 17 (Carbonyl pointing upwards) | Twist-Boat | -1651.407976 | 143621.60 | 1.45*10^25 | 1534.93 |
| Molecule 17 (Carbonyl pointing upwards) | Chair | -1651.414976 | 125436.39 | 9.48*10^21 | 1 |
| Molecule 18 (Carbonyl pointing downwards) | Twist-Boat | -1651.462785 | 1233.00 | 1.65 | |
| Molecule 18 (Carbonyl pointing downwards) | Chair | -1651.463260 | 0 | 1 |
In order to determine the extent to which fluxional processes would feature in the NMR spectrum the equilibrium constants for interconversion between conformers were calculated. The results are presented in table 10. It can clearly be seen that the equilibrium constant for molecule 18 is very small and so given its value of 1.65 one would expect a roughly 5:3 ratio of chair:twist-boat conformers in solution. In stark contrast molecule 18's equilibrium constant of 1534.93 indicates that the chair conformer will be the only one observed in solution. As a result one would expect a computed spectrum of molecule 17 to show better agreement with literature values relative to molecule 18. However in carrying out such a calculation one would be guilty of concealing the aforementioned drawback of the method in its neglect of fluxional processes. In summary, the more interesting molecule was chosen for analysis here. The electromagnetic field experienced by the molecule 18 will change as a function of time owing to its fluxionality 1 As such, a time dependent computational method could have been used. Such a method however, would have incurred considerable computational expense due to calculations involving many different frequencies.
Spectral Assignment - A Comparison with the Experimental Literature
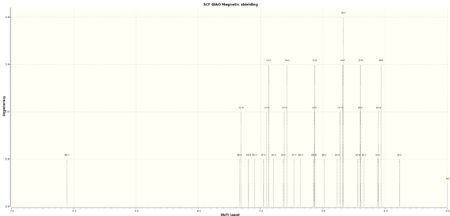
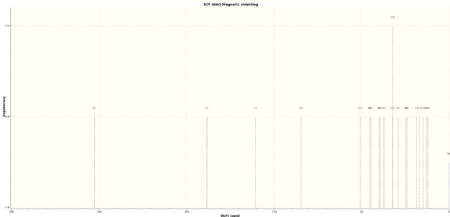
Both the NMR spectra of the chair and twist-boat conformers of molecule 18 were computed and are compared with the literature below. The TMS B3LYP/6-311+G(2d,p) reference was used when taking the NMR spectra as it was deemed to give the results most similar to the results that would have been given by a reference at the B3LYP/6-31G (d,p) level of theory, the level at which the optimisation and frequency analysis was carried out. This option was not available as a reference however. In accord with the principles of the Amsterdam Manifesto the citable DOIs of the calculations in addition to the spectra are given below in tables 10-13. A standard deviation from the literature values is also provided in column chart format.
 |
 |
 | |
| Calculated Chemical Shift (ppm) | Integration | Atom Label | Experimental Chemical Shift (ppm)- 300 MHz, C6D6 7. |
| 6.11 | 1.0000 | 26 | 5.21 |
| 3.33 | 2.0000 | 50,52 | 3.00-2.70 (6H, m) |
| 3.19 | 1.0000 | 53 | 3.00-2.70 (6H, m) |
| 3.10 | 1.0000 | 51 | 3.00-2.70 (6H, m) |
| 2.91 | 3.0000 | 27,33,24 | 3.00-2.70 (6H, m) |
| 2.79 | 1.0000 | 32 | 2.70-2.35 (4H, m) |
| 2.61 | 3.0000 | 30,35,34 | 2.70-2.35 (4H, m) |
| 2.46 | 1.0000 | 47 | 2.20-1.70 (6H, m) |
| 2.36 | 1.0000 | 38 | 2.20-1.70 (6H, m) |
| 2.14 | 3.0000 | 25,36,31 | 2.20-1.70 (6H, m) |
| 1.97 | 1.0000 | 29 | 2.20-1.70 (6H, m) |
| 1.71 | 4.0000 | 43,28,44,39 | 1.58 (1H, t) |
| 1.41 | 3.0000 | 48,40,37 | 1.50-1.20 (3H, m) |
| 1.34 | 1.0000 | 42 | 1.10 (3H, s) |
| 1.10 | 3.0000 | 41,45,46 | 1.07 (3H, s) |
| 0.77 | 1.0000 | 49 | 1.03 (3H, s) |
 |
 |
 | |
| Calculated Chemical Shift (ppm) | Integration | Atom Label | Experimental Chemical Shift (ppm) - 75 MHz, C6D6 7 |
| 202.52 | 1.0000 | 9 | 211.49 |
| 138.37 | 1.0000 | 2 | 148.72 |
| 110.43 | 1.0000 | 3 | 120.90 |
| 84.41 | 1.0000 | 12 | 74.61 |
| 50.72 | 1.0000 | 11 | 60.53 |
| 45.18 | 1.0000 | 6 | 51.30 |
| 44.49 | 1.0000 | 10 | 50.94 |
| 39.99 | 1.0000 | 7 | 45.53 |
| 39.43 | 1.0000 | 13 | 43.28 |
| 37.07 | 1.0000 | 23 | 40.82 |
| 32.09 | 2.0000 | 22,15 | 38.73 - 36.78 (2C) |
| 29.03 | 1.0000 | 4 | 35.47 |
| 24.43 | 1.0000 | 8 | 30.84 |
| 23.94 | 1.0000 | 19 | 30.00 |
| 18.45 | 1.0000 | 1 | 25.56 |
| 16.76 | 1.0000 | 17 | 25.35 |
| 14.84 | 1.0000 | 5 | 22.21 |
| 12.92 | 1.0000 | 16 | 21.39 |
| 12.01 | 1.0000 | 14 | 19.83 |
 |
 |
 | |
| Calculated Chemical Shift (ppm) | Integration | Atom Label | Experimental Chemical Shift (ppm) - 300 MHz, C6D6 7. |
| 5.52 | 1.0000 | 26 | 5.21 |
| 3.49 | 1.0000 | 50 | 3.00-2.70 (6H, m) |
| 3.28 | 1.0000 | 51 | 3.00-2.70 (6H, m) |
| 3.18 | 1.0000 | 53 | 3.00-2.70 (6H, m) |
| 3.11 | 1.0000 | 52 | 3.00-2.70 (6H, m) |
| 2.97 | 1.0000 | 27 | 3.00-2.70 (6H, m) |
| 2.68 | 1.0000 | 33 | 3.00-2.70 (6H, m) |
| 2.58 | 2.0000 | 30, 32 | 2.70-2.35 (4H, m) |
| 2.35 | 1.0000 | 35 | 2.70-2.35 (4H, m) |
| 2.25 | 2.0000 | 34, 34 | 2.70-2.35 (4H, m) |
| 2.12 | 4.0000 | 25, 36, 39, 31 | 2.20-1.70 (6H, m) |
| 2.00 | 1.0000 | 29 | 2.20-1.70 (6H, m) |
| 1.91 | 2.0000 | 38, 47 | 2.20-1.70 (6H, m)/1.58 (1H, t) |
| 1.81 | 1.0000 | 37 | 1.50-1.20 (3H, m) |
| 1.67 | 2.0000 | 44,43 | 1.50-1.20 (3H, m) |
| 1.54 | 1.0000 | 28 | 1.10 (3H, s) |
| 1.45 | 1.0000 | 49 | 1.10 (3H, s) |
| 1.23 | 4.0000 | 42, 40, 48, 41 | 1.07 (3H, s) |
| 1.11 | 2.0000 | 45,46 | 1.03 (3H, s) |
 |
 |
 | |
| Calculated Chemical Shift (ppm) | Integration | Atom Label | Experimental Chemical Shift (ppm)- 75 MHz, C6D6 7 |
| 202.54 | 1.0000 | 9 | 211.49 |
| 139.19 | 1.0000 | 2 | 148.72 |
| 108.84 | 1.0000 | 3 | 120.90 |
| 79.35 | 1.0000 | 12 | 74.61 |
| 57.87 | 1.0000 | 11 | 60.53 |
| 46.61 | 1.0000 | 10 | 51.30 |
| 45.84 | 1.0000 | 6 | 50.94 |
| 40.39 | 1.0000 | 7 | 45.53 |
| 37.12 | 1.0000 | 22 | 43.28 |
| 34.76 | 1.0000 | 23 | 40.82 |
| 31.59 | 1.0000 | 13 | 38.73 |
| 27.97 | 1.0000 | 4 | 36.78 |
| 26.58 | 1.0000 | 15 | 35.47 |
| 22.38 | 1.0000 | 8 | 30.84 |
| 19.36 | 1.0000 | 19 | 30.00 |
| 18.99 | 1.0000 | 1 | 25.56 |
| 16.16 | 1.0000 | 17 | 25.35 |
| 15.51 | 1.0000 | 5 | 22.21 |
| 13.58 | 1.0000 | 16 | 21.39 |
| 12.04 | 1.0000 | 14 | 19.83 |
The computed spectra show reasonably good agreement with the literature values considering the many sources of error present in the calculations. Although assignment of the shifts was attempted, the task was complicated, especially for the proton NMR, by the degeneracy tolerance of 0.05 for the calculation. In conjunction with the fact that the experimental 1H NMR spectra is quite complex in itself, showing up many multiplets, it was decided that a detailed comparison of the computed and experimental values for the chemical shift would not yield much information. One point of note however is the difference in the shift of atom number 26, the alkene proton, on going from the chair to the twist-boat conformation. The proton is more deshielded when the molecule lies in the chair conformation. An examination of the structure would seem to suggest that this is due to the differing number of van der Waals interactions between conformers. The maximum in the van der Waals H-H attraction occurs at 2.4 Angstroms 9. As such any hydrogen atom residing at roughly this distance from another is likely to be sharing some (non-bonded) electron density with the hydrogen atom in question. One could argue that the constrained geometry of the twist-boat conformation, although unfavourable relative to the chair conformation for the molecule as a whole, results in a better electronic stabilisation of the alkene proton thus moving its chemical shift upfield relative to its twist-boat counterpart. As mentioned in the computational toolbox, the calculation of the coupling constants would be a very time-consuming operation and so was not attempted for a molecule of these proportions.
Aside from an anomalous degeneracy of 2 for one of the carbon environments, the 13C NMR spectra obtained represent a much more promising testbed for the comparison of computationally and experimentally obtained results. The main trend on display in the data presented above is the consistent underestimate of the chemical shift of the computational values relative to those of experiment. One possible explanation for the consistent deviation would be a difference between the shift of the reference solvent used for optimisation and the reference solvent used for experiment. While CDCl3 is the solvent used under both computational and experimental conditions it could have been the case that an external reference was used in the experiment. Thus, if the reference points for measurement of the chemical shifts was different in both cases, the results would be consistently different as is the case in the data above.
Analysis of the Properties of the Synthesised Alkene Epoxides
Introducing the Two Catalytic Systems
 |
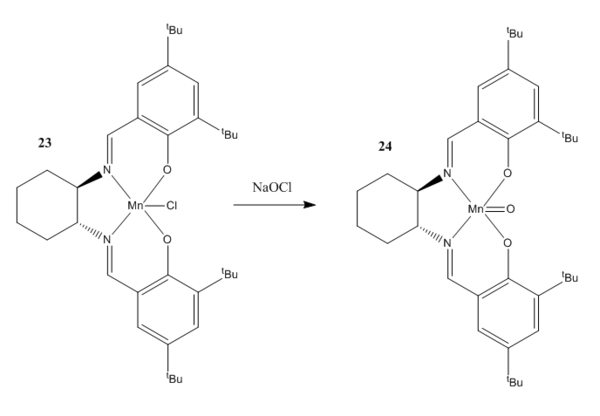 |
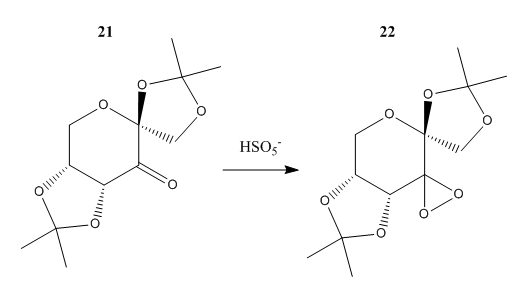
Both catalysts featured above are asymmetric catalysts for the enantioselective epoxidation of alkenes. The Jacobsen catalyst is characterised by an Mn metal centre coordinated to a tetradentate salen ligand while the Shi catalyst was one of the first examples of a non-metal catalyst 10. The Shi catalyst, derived from D-Fructose, and the Jacobsen are somewhat complementary in their applications. While the Jacobsen catalyst is particularly effective for epoxidation reaction on cis alkenes, the Shi catalyst is best-suited to epoxidation reactions of trans alkenes. The ability to synthesise enantiomerically pure drug molecules is of paramount importance to the pharmaceutical industry. Enantiomers may display markedly different behaviour with respect to their biological activities and so the utmost care must be taken to ensure that a drug molecule is enantiomerically pure. One striking illustration of the implications of non-enantiomerically pure drug molecules being marketed to the general public was seen in relatively recent years in the form of the "thalidomide disaster". In this case, although an enantiomerically pure drug (used to combat the effects of morning sickness) was being sold, the problem lay in the fact that thalidomide racemised inside the body, with the effect that the other enantiomer was harmful to human health. Nonetheless the drive to synthesise enantiomerically pure molecules is an incredibly topical area of research and as a result the number of articles pertaining to the use of the Jacobsen and Shi catalysts has risen exponentially since their inception in the 1990s.
Crystal Structures of the Two Catalysts
The crystal structures of the stable precursor to the Shi Catalyst (molecule 21) and the pre-catalyst for the Jacobsen catalyst (molecule 23) were located. Molecule 21 was obtained through a search of the Cambridge Crystal Database using the Conquest program while molecule 23 was obtained using a PubChem search. Through an analysis of the crystal structures of the catalysts it may be possible to determine which features are responsible for their observed enantioselectivity.
The Jacobsen Catalyst
The Mn(III) salen complex known as the Jacobsen catalyst given in figure was first reported in 1990 11. Indeed, complexes containing an Mn centre have been noted by both Jacobsen and Katsuki 12 to be more effective catalysts for asymmetric epoxidation (AE) relative to other metal complexes. It has been explained by Kastsuki that the enantioselection of the catalyst is dependent on two factors: the trajectory of approach for the incoming olefin to undergo epoxidation in addition to the olefin's particular conformational pose. An understanding of the various mechanisms by which the asymmetric epoxidation takes place could potentially lead to design of yet more efficient catalysts for AE. Hence it is with the hopes of achieving this aim that the crystal structure of the Jacobsen catalyst is examined below. By putting the topology of the Jacobsen catalyst under scrutiny it should be possible to hypothesise why certain pathways of approach are inherently disfavoured relative to others.
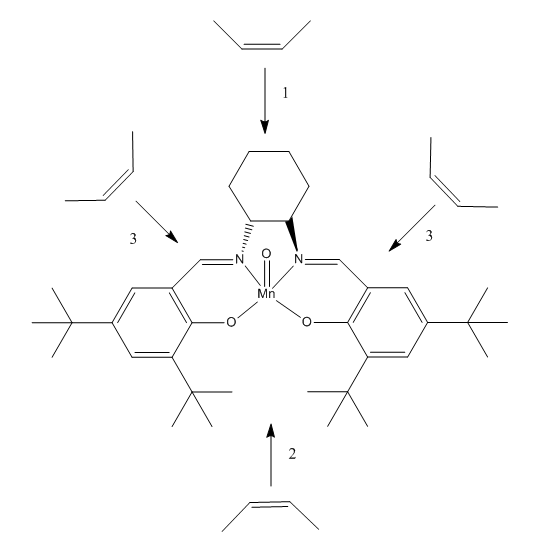
The possible approach trajectories are given in figure . Poor asymmetric induction was observed for Mn(III) salen complexes in which the non-bulky substituents were used in place of the tert-butyl groups present in the Jacobsen catalyst 12. As such it may be inferred that trajectories of approach that lie far from the stereogenic centres in the catalyst should show little enatioselectivity. The explanation for this comes from the fact that bulky groups such as tert-butyl substituents will provide significant steric hindrance for any approaching olefin and thus the pathway for coordination will be one other than pathway 2 in figure below. Pathway 1 was proposed by Jacobsen after his initial proposal of a pathway (not shown in the figure below) which involved approach in line with a tert-butyl group. Katsuki later proposed pathway 3 as an alternative.
Indeed Katsuki's suggested trajectory goes a long way in helping to ascertain the source of the enantioselection. Through considering the electronic environments that would be experienced for an olefin approaching along pathway 3 one may see that one side of the trajectory is electron rich whilst the other side is not. Ethylenediamine contains no pi electrons and hence will not repel an electron rich substituent on an olefin making its way to a coordination site on the Mn centre. The Ph ring of the salen ligand on the other hand will repel electron rich substituents in the olefin. This effect is particularly pronounced for olefins such as 1,2-dihydronapthalene which has an electron rich pi system. Hence this asymmetric electron distribution in the catalyst along trajectory 3 could well be the reason for the observed enantioselectivity with the net effect being the guidance of the olefin into the correct orientation for the formation of a specific enantiomer.
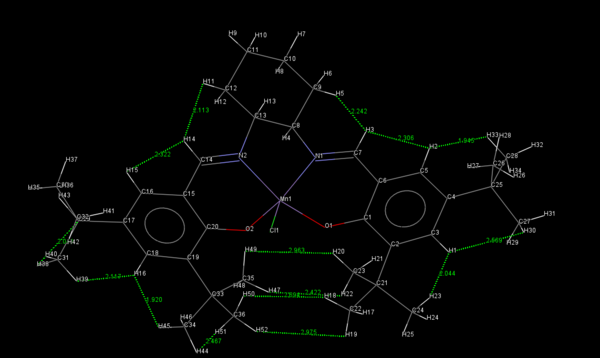
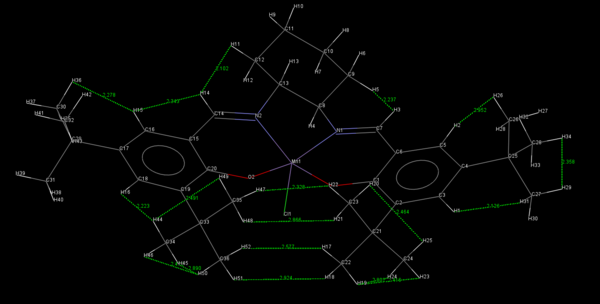
Two crystal structures of the Jacobsen catalyst are given below. It should be noted that the unimolecular as opposed to the bimolecular structure is provided for clarity. On examination of the structures it may be noted that the close approach of the two t-butyl groups could be key in explaining the enantioselectivity of the catalyst. In addition to being sterically repulsive, the proximity of the tert-butyl groups has the effect such as to provide many slightly attractive van der Waals interactions between the two groups. Thus any incoming olefin would break up these attractive interactions in addition to being repelled by the bulk of the groups. This reasoning is somewhat speculative it must be said. Perhaps the most convincing argument for the mechanistic steric hindrance is the square-based pyramidal geometry of the ligands on the bottom face 13 . This serves to reinforce the preference for coordination trajectories other than 2. It has been noted 12 that many of the reported crystal structures for Mn(III) salen compounds are very close to planar. Thus it is surprising that such a molecule would result in such high degrees of enantioselectivity. However Katsuki proposed that in solution, there would be non-planar conformations available to certain types of Mn(III) salen complexes and that chiral ligands could serve to enhance the degree of enantioselection exhibited by such conformations. Such a ligand is present in the Jacobsen catalyst.
 |
 |
The Shi Catalyst
Yian Shi first proposed a non-metal catalyst in 1996 that filled a previously unfilled niche in the market of reagents for enantioselective epoxidations 10 Although methods already existed for the successful transformations of allylic alcohols (Sharpless) and cis alkenes (Jacobsen, trans alkenes still represented a problem child for the field. The eponymous Shi catalyst however, has enjoyed considerable success in completing the full set of substrates able to undergo enantioselective epoxidation through tackling trans alkenes.

It is again the case that knowledge of the catalyst structure can help to gain insight into the mechanism of catalysis. Indeed, there have been many studies in the literature undertaken in part with this aim 14. One of the most obvious and stringent requirements is that the stereogenic portion of the catalyst is located close to the reactive carbonyl of the Shi catalyst. This proximity is obligatory in order to allow stereochemical communication between the catalyst and substrate. Other considerations reported by Shi in 2004 include the fact that spiro ketal fragments in the catalyst perform better than catalysts containing cyclic ketals and that smaller substituents on the ketal portion, e.g. methyl groups as opposed to ethyl groups, resulted in improved reactivity and enantioselectivity. Lastly the oxygen of the pyranose ring was found to have an important influence on both the reactivity and enantioselection of the catalyst.
Hence the requirement for the presence of the oxygen in the pyranose ring gives some clue as to the possible reasons for the success of the Shi catalyst. It is quite probably that reactivity is ameliorated through having a stable catalyst that is not prone to undergoing Baeyer-Villiger-like decomposition 14. Hence one can look towards stereoelectronic interactions in the catalyst structure in order to rationalise this stability and by extension, reactivity. The anomeric effect is one such stereoelectronic effect that is particularly prevalent in sugars. The modus operandi of this interaction involves a donor orbital on oxygen (lone pair) overlapping with a low energy acceptor orbital (sigma star orbital of the C-O bond) in order to produce a stabilising interaction. Thus carrying out an analysis of the crystal structure of the catalyst is a worthwhile undertaking in order to identify the presence of any anomeric interactions and rationalise their effect on the practical efficacy of the catalyst.
The C-O bond lengths of the Shi catalyst are given in table 17 with the linkages corresponding to anomeric centres provided in table 18. One may see that the acetal centre bond lengths are shorter relative to typical C-O bond lengths 15. Thus this is evidence of the anomeric effect. As described by Briggs et al 16 , the donation of an oxygen lone pair into a sigma star C-O orbital will serve to shorten the donor-C bond and lengthen the acceptor C-bond. It should be noted that an anti-periplanar alignment between donor and acceptor orbitals is required for an anomeric interaction. This requirement offers up a possible explanation for the relative shortness of the O4-C8-O2 linkage relative to the other anomeric centres. It could be the case that as the spiro group is only bound to the pyranose ring by one atom it has a greater amount of conformational freedom relative to a fused ring. Hence the orbitals at the spiro linkage possess a greater ability to move into antiperiplanar alignment and hence exhibit shorter bond lengths when compared to the anomeric centres at the ring junction.
| Atom Labels | Bond lengths (Angstroms) |
|---|---|
| C12-O1 | 1.437 |
| C12-O3 | 1.435 |
| C14-O4 | 1.434 |
| C14-O5 | 1.433 |
| C9-O3 | 1.432 |
| C13-O5 | 1.430 |
| C11-O2 | 1.428 |
| C8-O4 | 1.427 |
| C8-O2 | 1.424 |
| C7-O1 | 1.422 |
| Linkage |
|---|
| 01-C12-O3 |
| O4-C8-O2 |
| O5-C14-O4 |
Calculated NMR Properties of the Products
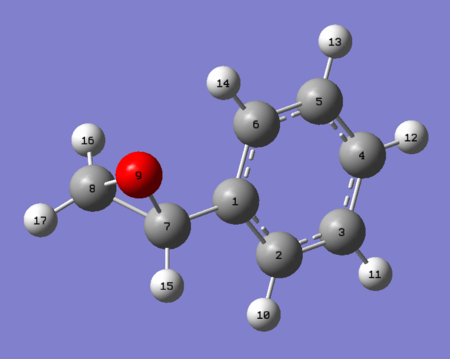
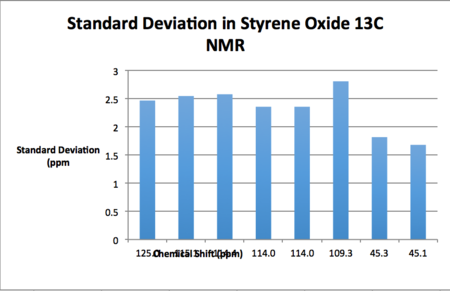
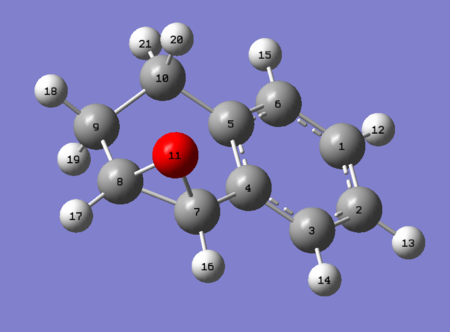
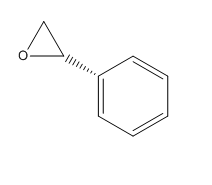
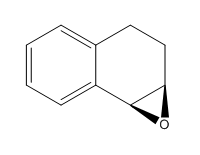
AE carried out on styrene and 1,2-dihydronapthalene results in the product distribution given in table 19. Tables 20 through 23 give the NMR spectra computed at the B3LYP 6-31G (d,p) level of theory. It should be noted that as enantiomers are chemically equivalent the observed NMR spectrum is the same regardless of the enantiomer used for calculation. For the synthetic chemist, an NMR analysis is necessary in order to ascertain whether or not one has made the intended epoxide. If it is the case that the NMR spectrum matches that of the literature one can then subsequently proceed to the assignment of the absolute configuration of the synthesised product.
 |
 |
 | |
| Calculated Chemical Shift (ppm) | Integration | Atom Label | Experimental Chemical Shift (ppm)- 400 MHz, CDCL3 17. |
| 7.00 | 4.00 | 13,11,10,12 | 7.25 (5H, m) |
| 6.74 | 1.00 | 14 | 7.25 (5H, m) |
| 3.32 | 1.00 | 15 | 3.88 (1H, dd) |
| 2.78 | 1.00 | 17 | 3.16 (1H, dd) |
| 2.26 | 1.00 | 16 | 2.88 (1H, dd) |
 |
 |
 |
 |
| Calculated Chemical Shift (ppm) | Integration | Atom Label | Experimental Chemical Shift (ppm)- 100 MHz, CDCL3 17. |
| 125.0 | 1.00 | 1 | 137.2 |
| 115.1 | 1.00 | 5 | 128.1 |
| 114.4 | 1.00 | 3 | 127.7 |
| 114.0 | 2.00 | 2, 4 | 125.1 |
| 109.3 | 1.00 | 6 | 125.1 |
| 45.3 | 1.00 | 8 | 51.9 |
| 45.1 | 1.00 | 7 | 50.8 |
 |
 |
 | |
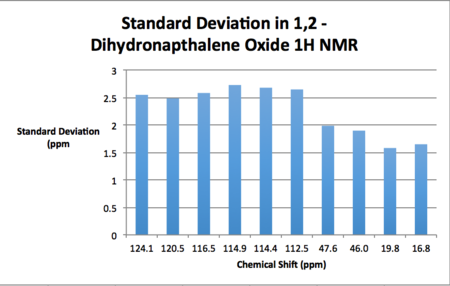
| Calculated Chemical Shift (ppm) | Integration | Atom Label | Experimental Chemical Shift (ppm)- 100 MHz, CDCL3 18. |
| 124.1 | 1.00 | 5 | 137.1 |
| 120.5 | 1.00 | 4 | 132.9 |
| 116.5 | 1.00 | 3 | 129.9 |
| 114.9 | 1.00 | 6 | 129.8 |
| 114.4 | 1.00 | 1 | 128.8 |
| 112.5 | 1.00 | 2 | 126.5 |
| 47.6 | 1.00 | 8 | 55.5 |
| 46.0 | 1.00 | 7 | 53.2 |
| 19.8 | 1.00 | 10 | 24.8 |
| 16.8 | 1.00 | 9 | 22.2 |
 |
 |
 | |
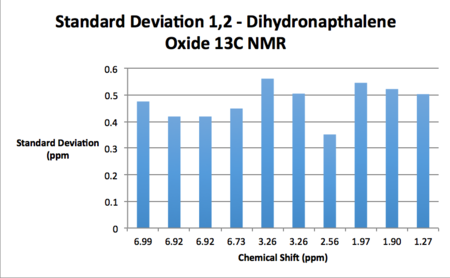
| Calculated Chemical Shift (ppm) | Integration | Atom Label | Experimental Chemical Shift (ppm)- 400 MHz, CDCL3 18. |
| 6.99 | 1.00 | 14 | 7.44 (1H, d) |
| 6.92 | 2.00 | 12, 13 | 7.33-7.21 (2H, m) |
| 6.73 | 1.00 | 15 | 7.13 (1H, d) |
| 3.26 | 2.00 | 16, 17 | 3.89 (1H, d). 3.77 (1H, t) |
| 2.56 | 1.00 | 21 | 2.83-2.79 (1H, m) |
| 1.97 | 1.00 | 20 | 2.59-2.55 (1H, m) |
| 1.90 | 1.00 | 19 | 2.49-2.41 (1H, m) |
| 1.27 | 1.00 | 18 | 1.80-1.76 (1H, m) |
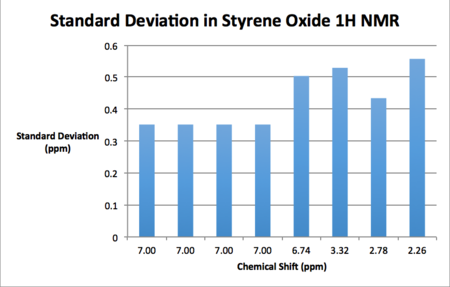
As may be seen from the results presented above, the standard deviations of the computed shifts from literature values are quite small. Thus one can claim good agreement between the simulated and literature shift values. Coupling constants were computed for 1,2-dihydronapthalene oxide although unfortunately these couldn't be used in conjunction with the gNMR software and an input structure in order to generate a spectrum as the input file was an unsupported file type.
Assigning the Absolute Configuration of the Products
In this part of the exercise the values for optical rotation and the vibration circular dichroism (VCD) spectra were calculated for each enantiomer. Secondly the predicted enantiomeric excess was obtained through an analysis of the free energies of the transition states for the reactions using the equation ee = [(R - S)/(R + S)] x 100. In this equation R and S represent the fraction of each enantiomer present. This will be discussed further in the section on the transition states. Another method, electronic circular dichroism was not carried out due to the fact that no appropriate chromophore exists for the epoxides. The Molecular Mechanics approach to assigning absolute configurations could gain significant traction given that the most commonly used experimental method of optical rotation is unreliable under certain circumstances. Thus a rare situation may arise where computational methods can be used to check the results of experiment! Further details of this will be given below.
Optical Rotation
An optically active compound will rotate an incident plane of polarised light. The angle of the transmitted light relative to the incident light is an experimentally measurable quantity. In the lab this measurement is carried out using a polarimeter. Facing towards the light source, those compounds that rotate the incident light clockwise are (+) optical isomers and those that rotate light anti-clockwise are (-) optical isomers. The optical rotation of a chiral compound is one of the only ways of distinguishing it from its enantiomer which would otherwise share identical chemical and physical properties. In practice the letter alpha denotes the specific rotation of a compound at a given wavelength and temperature. Two of the most popular wavelengths for carrying out such a measurement are 589 nm and 365 nm. The wavelength of 589 nm is often assigned the letter D in the literature as it corresponds to the D-line of a sodium lamp. Unfortunately there are not many examples of specific rotations for compounds measured using 365 nm light and so instead comparison of these values is made in a different manner. The generalisation that the specific rotation at 365 nm is approximately three times the specific rotation at 589 nm is used for comparison. It should be pointed out that experimental values for the specific rotation of compounds where alpha is less than 100 degrees are notoriously unreliable for alpha < 100 degrees.
| Product | Computed Specific Rotation 589 nm (degrees) | Literature Specific Rotation 589 nm (degrees) | Computed Specific Rotation 365 nm (degrees) | Estimate based on Generalisation 365 nm (degrees) |
|---|---|---|---|---|
| R Styrene DOI:10042/193975 | -30.81 | -24 19, -21.9 20 | -96.48 | -72 19 |
| S Styrene DOI:10042/193976 | 30.84 | +32.1 21 +28 22 | 96.45 | +96.3 21 |
| R,S Dihydronapthalene DOI:10042/193982 | 155.89 | +133 23 + 129 24 | 522.63 | 399 23 |
| S,R Dihydronapthalene DOI:10042/193974 | -155.65 | -144.9 25 -33.9 21 | -521.18 | -434.7 25 |
The first point worthy of note is that the computed values differ slightly in magnitude (opposite sign) for the same enantiomers. This discrepancy is likely to have arisen because of a slight difference in input structure to the Gaussian program. Indeed, the computed specific rotation is ultra sensitive to the geometry of the molecule. The same magnitudes were likely to have been obtained had the invert structure command in Gaussian been invoked. Given the sensitivity of both computational and experimental techniques for obtaining values for the optical rotation relatively good agreement has been achieved. In practice it would be impossible to attribute the error to either experiment or computation. The most reliable value would probably correspond to the average rotation of a compound over many experiments. Indeed this is why many references and not just one were used in order to compare the optical rotatory power.
Vibrational Circular Dichroism (VCD)
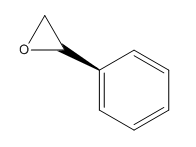
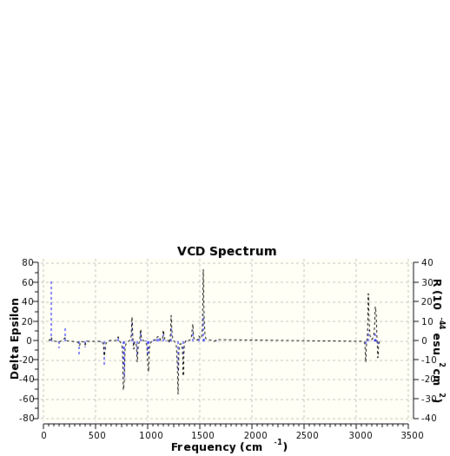
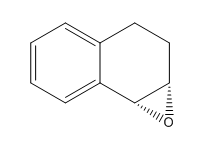
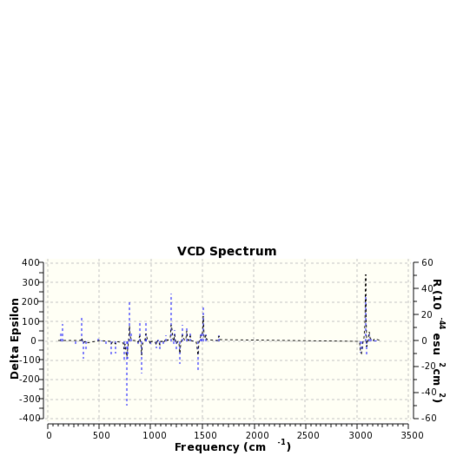
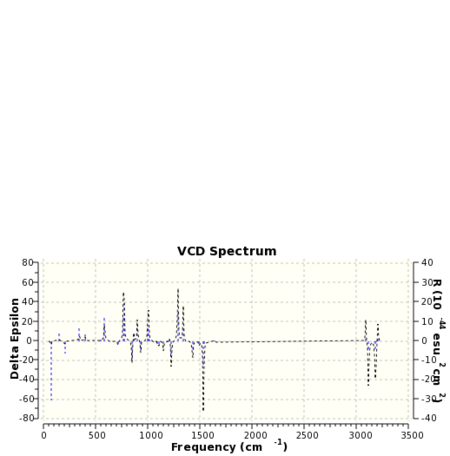
VCD is a relatively new spectroscopic technique that can be used to infer 3D structural information about a molecule. As such it may be used to distinguish between enantiomers. The means of operation of the technique involves the detection of differences in the attenuation of light transmitted from a sample. Absorption of this light results in vibration excitation. The computation of VCD spectra has particular utility in so far as for small molecules at least ab initio methods may be used to generate them. Once again the paradoxical situation is reached when it could be the case that computational techniques in this field may be used to verify the results of experiment! VCD spectra of the epoxide products were computed with the spectrum for styrene oxide being compared to the literature 26. The computed spectra are presented below in table 25.
 |
 |
 |
 |
 |
 |
 |
 |
The spectrum of styrene oxide shows good agreement to the literature in the range of 1000-1650 cm-1.For 1,2-dihydronapthalene oxide the appearance of the spectra for each enantiomer contains enough information to be able to ascertain whether or not the two molecules are enantiomers. Clearly one is the mirror image of the other.
Using the Properties of Transition States for the Reactions
As mentioned previously, through a comparison of the energies of the transition states one may predict the enantiomeric excess (ee) of a given reaction. What follows below is an analysis concerning the transition states of the epoxidation of styrene and 1,2-dihydronapthalene as catalysed by firstly the Shi catalyst and secondly the Jacobsen catalyst. The enantiomeric excesses of the respective enantiomers for each compound were calculated. The procedure by which this was performed was as follows: The transition states with the lowest total energy for each enantiomer were first isolated and the Gibbs free energy of these compounds was taken. Subsequently, the equation ΔG = -RTlnK was rearranged for K and the ratio of the diastereomeric transition states was found. As a final step the enantiomeric excess was computed using the equation previously cited, namely ee = [(R-S)/(R+S)] x 100. The computed ee's were then compared to literature values.
The Shi Catalyst - Epoxidation of Styrene
The links to the files for the transition states of the Shi-catalysed AE of styrene are provided in table 26 below. Unfortunately due to time constraints it was impossible to include rotatable Jmol animations for each of the transition states.
| R Styrene Oxide DOI | R Styrene Oxide Total Energy (Hartrees) | S Styrene Oxide DOI | S Styrene Oxide Total Energy (Hartrees) |
|---|---|---|---|
| DOI:10.6084/m9.figshare.822152 | -1304.11760 | DOI:10.6084/m9.figshare.823545 | -1304.11875 |
| DOI:10.6084/m9.figshare.828520 | -1304.11585 | DOI:10.6084/m9.figshare.822136 | -1304.11019 |
| DOI:10.6084/m9.figshare.822135 | -1304.12287 | DOI:10.6084/m9.figshare.828519 | -1304.11513 |
| DOI:10.6084/m9.figshare.822137 | -1304.12439 | DOI:10.6084/m9.figshare.826003 | -1304.12329 |
| R Styrene TS Gibbs Free Energy (Hartrees) | S Styrene TS Gibbs Free Energy (Hartrees) | ΔG (joules/mol) | Equilibrium Constant | ee(%) | ee(%) Literature |
|---|---|---|---|---|---|
| -1303.73804 | -1303.73850 | -1195.03 | 1.62 | 23.6 (S) | 24.3 (R) 27 |
The Shi Catalyst - Epoxidation of 1,2-Dihydronapthalene
| Temperature | R,S-1,2-Dihydronapthalene Oxide Total Energy (Hartrees) | S-R-1,2-Dihydronapthalene Oxide DOI | S-R-1,2-Dihydronapthalene Oxide Total Energy (Hartrees) |
|---|---|---|---|
| DOI:10.6084/m9.figshare.832492 | -1381.54382 | DOI:10.6084/m9.figshare.832538 | -1381.55280 |
| DOI:10.6084/m9.figshare.832510 | -1381.54726 | DOI:10.6084/m9.figshare.832536 | -1381.53608 |
| DOI:10.6084/m9.figshare.832511 | -1381.55620 | DOI:10.6084/m9.figshare.832545 | -1381.54761 |
| DOI:10.6084/m9.figshare.832512 | -1381.54990 | DOI:10.6084/m9.figshare.832544 | -1381.55813 |
| R,S-1,2-Dihydronapthalene TS Gibbs Free Energy (Hartrees) | S,R-1,2-Dihydronapthalene TS Gibbs Free Energy (Hartrees) | ΔG (joules/mol) | Equilibrium Constant | ee(%) | ee(%) Literature |
|---|---|---|---|---|---|
| -1381.13406 | -1381.13624 | -5663.39 | 9.82 | 81.6 (S,R) | 32 (S,R) 28 |
The Jacobsen Catalyst - Epoxidation of Styrene
| R Styrene Oxide DOI | R Styrene Oxide Total Energy (Hartrees) | S Styrene Oxide DOI | S Styrene Oxide Total Energy (Hartrees) |
|---|---|---|---|
| DOI:10.6084/m9.figshare.860446 | -3344.62472 | DOI:10.6084/m9.figshare.860441 | -3344.63237 |
| DOI:10.6084/m9.figshare.860449 | -3344.62638 | DOI:10.6084/m9.figshare.860445 | -3344.62765 |
| R Styrene TS Gibbs Free Energy (Hartrees) | S Styrene TS Gibbs Free Energy (Hartrees) | ΔG (joules/mol) | Equilibrium Constant | ee(%) | ee(%) Literature |
|---|---|---|---|---|---|
| -3343.96216 | -3433.96920 | 18289.13 | 1600.64 | 99.8 (S) | 48 (enantiomer not given) 29 |
The Jacobsen Catalyst - Epoxidation of 1,2-Dihydronapthalene
| R,S-1,2-Dihydronapthalene Oxide DOI | R,S-1,2-Dihydronapthalene Oxide Total Energy (Hartrees) | S-R-1,2-Dihydronapthalene Oxide DOI | S-R-1,2-Dihydronapthalene Oxide Total Energy (Hartrees) |
|---|---|---|---|
| DOI:10.6084/m9.figshare.909346 | -3422.05830 | DOI:10.6084/m9.figshare.903752 | -3422.06854 |
| DOI:10.6084/m9.figshare.907332 | -3422.05965 | DOI:10.6084/m9.figshare.907473 | -3422.06055 |
| R,S-1,2-Dihydronapthalene TS Gibbs Free Energy (Hartrees) | S,R-1,2-Dihydronapthalene TS Gibbs Free Energy (Hartrees) | ΔG (joules/mol) | Equilibrium Constant | ee(%) | ee(%) Literature |
|---|---|---|---|---|---|
| -3421.35950 | -3421.36903 | -24757.87 | 21758.64 | 99.99 (S,R) | 52 (R, S) 30 85 (enantiomer not given) 29 |
Enantiomeric Excess Calculations - Conclusions
One may observe a marked difference when comparing the computed values and the literature values for the ee's of the product epoxides. A matching assignment is only observed in one case between literature and computed assignment. Two assignments stand at odds with each other whilst one literature source only gives a magnitude for the ee and not the enantiomer of styrene that resides in excess. Such staggering differences could possibly be attributed to the computational methodologies' inability to account for solvent effects in the optimisation of the transition state. One reason for the lower enantiomeric excesses obtained by experiment as mentioned earlier could be the fact that in the case of the Shi catalyst, a Baeyer-Villiger decomposition route is available, impacting on the observed enantioselection.
Investigation of the Non-Covalent Interactions in the Active Site of the Reaction Transition State
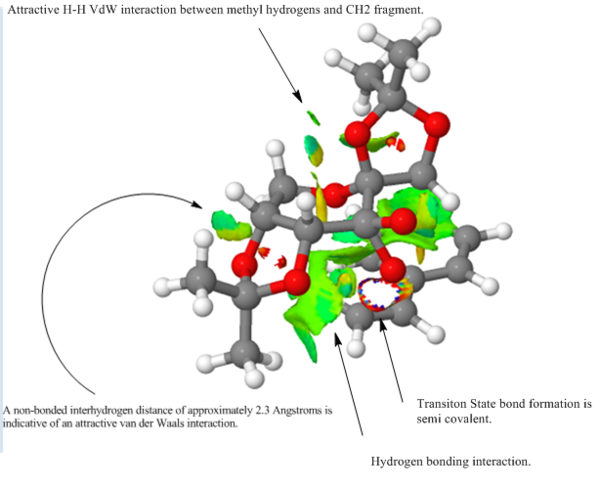
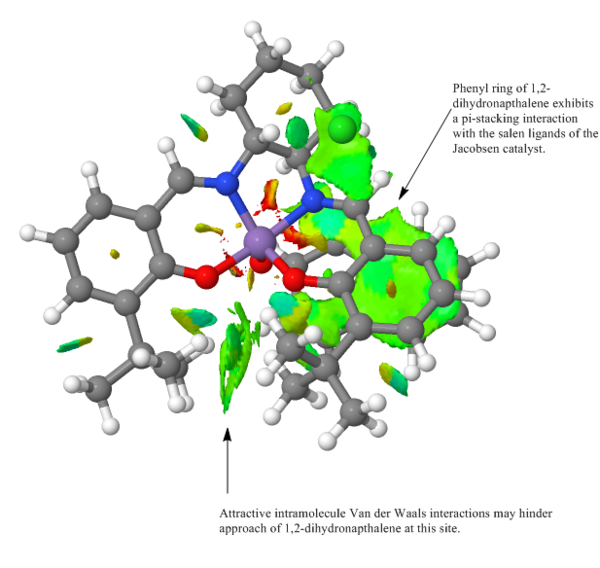
Non-covalent interaction or NCIs in very recent times would seem to gaining traction with respect to older methods of modelling such interactions 31 Such older methods include the use of bond critical points (BCPs). This approach will be considered as part of the QTAIM analysis. In the figures below the blue-green colour represents strongly attractive interactions, the green colour - mildly attractive interactions and the red colour - repulsive interactions. Ring critical points or RCPs may also be made out in the transition structures. These yellow regions are second order saddle points 31 . As noted previously, the proposed mechanism by which the Jacobsen catalyst derives its enantioselection relies on the argument that the incoming olefin experiences two very different electronic environments on approaching the Mn=O bond. This can be seen in figure where there are mildly attractive interactions (pi stacking for an olefin containing a Ph ring) on one side of the Mn=O bond and no interactions on the other side. Of course the nature of the interactions will depend on the alkene substrate. A pi rich substrate for example may experience repulsive interactions from the phenyl rings of the catalyst and not attractive interactions. The transition structure shown in different views in figures 24 and 25, despite exhibiting stabilising H-bonding interactions (illustrated by the blue-green circles) is higher in energy relative to some of its counterparts. The reason for this may be rationalised by the fact that the alkene substrate does not enjoy a stabilising interaction in the transition state and so the energy of the transition state is raised as a consequence.

Investigation of the Electronic Topology (QTAIM) in the Active Site of the Reaction Transition State
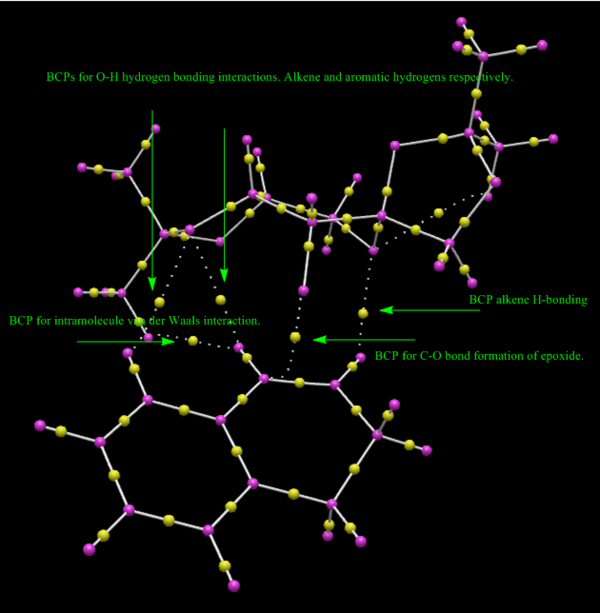
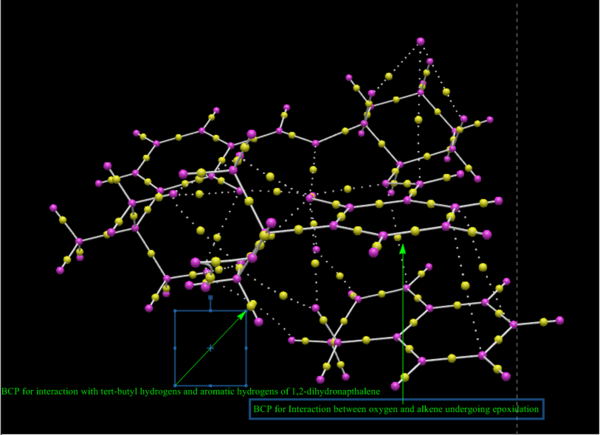
In the figures below, yellow dots represent bond critical points or BCPs in the QTAIM analysis. Commonly experienced problems with BCPs are that they sometimes fail to identify hydrogen-bonding interactions 31 The important transition states of the Shi catalysed epoxidation involve spirocyclic and planar geometries. Generally it is the spirocyclic transition state that is responsible for the observed enantioselectivity of the epoxidation. On close examination of the annotations in the figures below it is possible to reason why this might be the case. Hydrogen bonding interactions along with H-H distances at roughly the maximum van der Waals distance for attraction combine to lower the energy of the transition state considerably making the pathway through the spiro transition state more favourable. The BCPs in this case denote saddle points between maxima in electron density and thus give a good indication of where bonding interactions occur.

New Candidates for Investigation
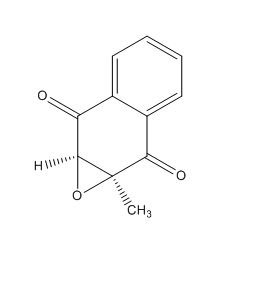
(2S, 3R)-2,3-epoxy-2-methyl-1,4-napthoquinone (Reaxys Registry number: 8111724 ) is a potential new candidate for computational studies involving the assignment of an absolute configuration.(2S, 3R)-2,3-epoxy-2-methyl-1,4-napthoquinone is reported to have an optical rotatory power of 356 degrees at 405 nm and 20°C 32. It's molecular weight of 188.183 g/mol is below the 200 g/mol threshold. The analogous alkene, menadione is commercially available and can be found in the Aldrich catalogue under sigma: M5625 33. Alternatively its CAS number is 58-27-5. It would be worthwhile to undertake a computational study on this molecule as an optical rotatory power measurement at 589 nm is yet to be reported it would appear. Mechanistically the molecule would prove to be very interesting. The electron-withdrawing carbonyl groups could yield important information about the electronic requirements of the olefin substrate in order to achieve high degrees of enantioelection. Further still the methyl olefin substituent could potentially throw up some interesting interactions for analysis using the NCI or QTAIM approaches.
The use of Digital Repositories for Sharing Data
Respecting the principles of the Amsterdam Manifesto, the DOIs of all HPC calculations are provided in the report. The DOIs for the references cited were also provided except in the cases where a DOI was unavailable. Particular problems in obtaining DOIs were experienced with the Tetrahedron journal.
References
1. F. Jensen, Introduction to Computational Chemistry, Wiley, Chichester, United Kindgom, 2nd edn., 2007.
2. N. H. Werstiuk, W. Sokol, Can. J. Chem., 2008, 86, 737-744, DOI:10.1139/V08-070 .
3. A. Behr, V. Manz, A. Lux, A. Ernst, Catal. Lett., 2013, 143, 241-245, DOI:10.1007/s10562-013-0960-3 .
4. R. S. Rowland, R. Taylor, J. Phys. Chem., 1996, 100(18), 7384-7391, DOI:10.1021/jp953141 .
5. D. Skala, J. Hanika, Petroleum and Coal, 45(3-4), 105-108.
6. S. W. Elmore, L. Paquette, Tetrahedron Lett. 1991, 32(3), 319-322, DOI:10.1016/S0040-4039(00)92617-0 10.1016/S0040-4039(00)92617-0 10.1016/S0040-4039(00)92617-0 .
7. L. A. Paquette, N. A. Pegg, D. Toops, G. D. Maynard, R. D. Rogers, J. Am. Chem. Soc., 1990, 112(1), 277-283, DOI:10.1021/ja00157a043 .
8. W. F. Maier, P. Von Rague Schleyer, J. Am. Chem. Soc., 1981, 103(8), 1891-1900, DOI:10.1021/ja003981003 .
9. Conformational Analysis, wwww.ch.ic.ac.uk/local/organic/conf/index.html.[Accessed February 2015].
10. Y. Tu, Z. Wang, Y. Shi, J. Am. Chem. Soc., 1996, 118, 9806-9807. DOI:10.1021/ja962345g .
11. W. Zhang, J. L. Loebach, S. R. Wilson, E. N. Jacobsen, J. Am. Chem. Soc., 1990, 112(7), 2801-2803, DOI:10.1021/ja001631052 .
12. T. Katsuki, Coord. Chem. Rev., 1995, 140, 189-214.
13. E. M. McGarrigle, D. G. Gilheany, Chem. Rev., 2005, 105(5), 1563-1602.
14. Y. Shi, Acc. Chem. Res., 2004, 37, 488-496. DOI:10.1021/ar030063x .
15. F. H. Allen, O. Kennard, D. G. Watson, L. Brammer, A. G. Orpen, R. Taylor, J. Chem. Soc., Perkin Trans. 2, 1987, S1-S19. DOI:10.1039/P298700000S1 .
16. A. J. Briggs, R. Glenn, P. G. Jones, A. J. Kirby, P. Ramaswamy, J. Am. Chem. Soc., 1984, 106(21), 6200-6206. DOI:10.1021/ja00333a014 .
17. Y. Kon, H. Hachiya, Y. Ono, T. Matsumoto, K. Sato, Synthesis, 2011, 7, 1092-1098, DOI:10.1055/s-0030-1258467 .
18. M. W. C. Robinson, A. Davies, R. Buckle, I. Mabbett, S. H. Taylor, A. E. Graham, Org. Biomol. Chem., 2009, 7, 2559-2564, DOI:10.1039/B900719A .
19. D. C. Forbes, S. V. Bettigeri, S. A. Patrawala, S. C. Pischek, M. C. Standen, Tetrahedron, 2009, 65, 70-76. DOI:10.1016/j.tet.2008.10.019 .
20. M. Hayashi, H. Miwata, N. Oguni, J. Chem. Soc. Perkin. Trans., 1991, 1, 1167-1171. DOI:10.1039/P19910001167 .
21. H. Lin, J. Qiao, Y. Liu, Z. Wu, J. Mol. Catal. B:Enzym., 2010, 67, 236-241. DOI:10.1016/j.mol.catb.2010.08.012. .
22. K. Huang, H. Wang, V. Stepanenko, M. De Jesus, C. Torruellas, W. Correa, M. Ortiz-Marciales, J. Org. Chem., 2011, 76(6), 1883-1886. DOI:10.1021/jo102294j .
23. D. R. Boyd, N. D. Sharma, R. Agarwal, N. A. Kerley, R. Austin, S. McMordie, A. Smith, M. Dalton, A. J. Blacker, G. N. Sheldrake, J. Chem. Soc. Commun., 1994, 1693-1694. DOI:10.1039/c39940001693 .
24. S. Pedrogosa-Moreau, A. Archelas, R. Furstoss, Tetrahedron, 1996, 52(13), 4593-4606. DOI:10.1016/0040-4020(96)00135-4 .
25. H. Sasaki, R. Irie, T. Hamada, K. Suzuki, T. Katsuki, Tetrahedron, 1994, 50(41), 11827-11838.
26. S. S. Thakur, S. Chen, W. Li, C. Shin, S. Kim, Y. Koo, G. Kim, J. Organomet. Chem., 2006, 691, 1862-1872. DOI:10.1016/j.jorganchem.2005.12.044 .
27. Z. Wang, Y. Tu, M. Frohn, J. Zhang, Y. Shi, J. Am. Chem. Soc., 1997, 119(46), 11224-11235. DOI:10.1021/ja972272g .
28. M. Frohn, Y. Shi, Synthesis, 2000, 14, 1979-2000. https://www.uni-bielefeld.de/chemie/oc3sewald/downloads/201011_ws/Shi.Syntesis.2001.1969.pdf [Accessed February 2015].
29. J. Hanson, J. Chem. Educ., 2001, 78(9), 1266-1268, DOI:10.1021/ed078p1266 .
30. P. Pietikainen, Tetrahedron Lett., 35(6), 941-944. DOI:10.1016/S0040-4039(00)76006-0 .
31. J. R. Lane, J. Contreras-Garcia, J. Piquemal, B. J. Miller, H. G. Kjaergaard, J. Chem. Theory Comput., 2013, 9(8), 3263-3266. DOI:10.1021/ct400420r .
32. A. Berkessel, M. Guixa, F. Schmidt, J. M. Neudorfl, J. Lex, Chem. Eur. J., 2007, 13(16), 4483-4498. DOI:10.1002/chem.200600993 .
33. Simga-Aldrich, http://www.sigmaaldrich.com/catalog/product/sigma/m5625?lang=en®ion=GB [Accessed February 2015].
