OliviaPiniInorganicLab
Optimising a Molecule of BH3
Method : B3LYP
Basis set : 6-31G
Summary Table :
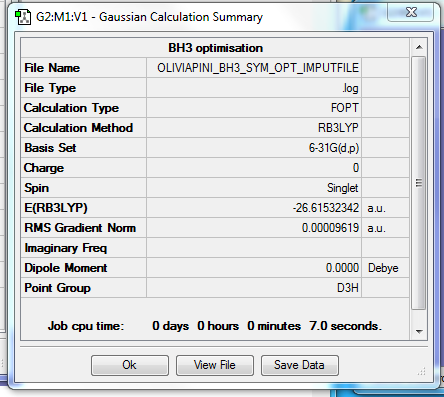
Fig. 1 = Summary Table of BH3
Item Table :
Item               Value     Threshold  Converged?
 Maximum Force            0.000192     0.000450     YES
 RMS     Force            0.000126     0.000300     YES
 Maximum Displacement     0.000763     0.001800     YES
 RMS     Displacement     0.000500     0.001200     YES
 Predicted change in Energy=-2.202660D-07
 Optimization completed.
    -- Stationary point found.
Table 1 = Item Table of BH3
Frequency File : Frequency file: OLIVIAPINI_BH3_FREQ_wiki.log
Low Frequencies :
Low frequencies ---   -0.2260   -0.1036   -0.0056   48.0278   49.0875   49.0880
Low frequencies ---   1163.7224 1213.6715 1213.6742
Table 2 = Low frequencies of BH3
Jmol dynamic image :
BH3 |
Fig. 2 = JMol of BH3
Vibrations :
| wavenumber (cm-1 | Intensity (arbitrary units) | symmetry | IR active? | type |
| 1163.72 | 92.4740 | A2 | Yes | Out-of-plane bend |
| 1213.67 | 14.0890 | E' | Very Slight | Bend |
| 1213.67 | 14.0926 | E' | Very Slight | Bend |
| 2579.74 | 0.0000 | A1' | No | Symmetric Stretch |
| 2712.67 | 126.4185 | E' | Yes | Asymmetric Stretch |
| 2712.67 | 126.4089 | E' | Yes | Asymmetric Stretch |
Table 3 = IR strechtes of BH3
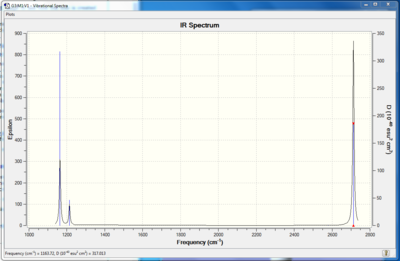
Fig. 3 = IR spectrum of BH3
This IR spectrum shows only 3 peaks, illustrating only 3 vibrations, however from Table 3 it can be seen that in fact BH3 has 6 vibrations. The reason only 3 are seen is firstly because the symmetric stretch that would appear at 2579.74cm-1 is IR inactive as it does not result in a change in dipole of the molecule. This means it will not absorb IR radiation and so doesn't give a peak. Also there are two peaks at both 1213.67 and 2712.67 cm-1 illustrating degenerate bends and asymmetric stretches respectively. Consequently only 1 peak will be seen in each case in the IR spectrum in stead of 2. This explains why three peaks are seen in the spectrum instead of the expected 6.
MO Diagram :
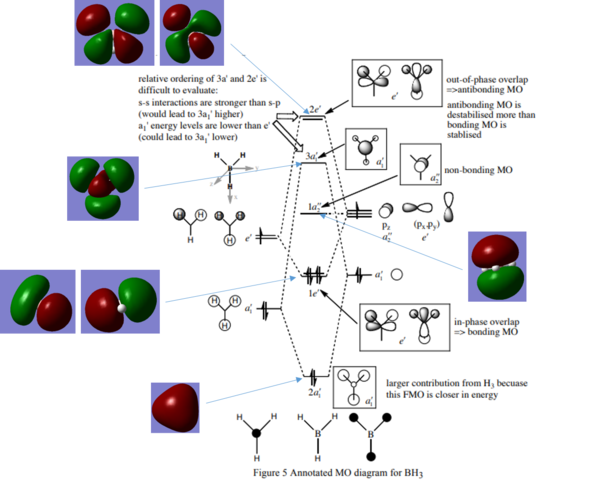
Fig. 4 = MO Diagram of BH3 (1)
As can be seen from Fig. 4 overall the qualitative MO theory predictions mainly match those computed by Gaussian and so it can be said that it is a useful and accurate qualitative procedure. All the computed orbitals appear in the same positions as those predicted by MO theory, however the unoccupied computed orbitals are more diffused then those occupied ones and that is not shown in the qualitative MO diagram. Additionally, for the computed antibonding orbitals the nodal planes are more pronounced, with the orbitals actually beginning to point away from each other due to repulsion, as seen especially in the top two orbitals and this is not depicted in the qualitative approach. However, overall the two are a good match with all orbitals being in the same positions and with the same phases and so confidence can be had in the qualitative MO theory and predictions.
Association energies: Ammonia-Borane
NH3
Method : B3LYP
Basis set : 6-31G
Summary Table :
Fig. 5 = Summary Table of NH3
Item Table :
Item               Value     Threshold  Converged?
 Maximum Force            0.000006     0.000450     YES
 RMS     Force            0.000004     0.000300     YES
 Maximum Displacement     0.000012     0.001800     YES
 RMS     Displacement     0.000008     0.001200     YES
 Predicted change in Energy=-9.843883D-11
 Optimization completed.
    -- Stationary point found.
Table 4 = Item Table of NH3
Frequency File : Frequency file: OLIVIAPINI_NH3_FREQ.log
Low Frequencies :
Low frequencies ---   -8.5646   -8.5588   -0.0047    0.0454    0.1784   26.4183
Low frequencies --- 1089.7603 1694.1865 1694.1865
Table 5 = Low frequencies of NH3
Jmol dynamic image :
NH3 |
Figure 6 = JMol of NH3
NH3BH3
Method : B3LYP
Basis set : 6-31G
Summary Table :
Figure 7 = Summary Table of NH3BH3
Item Table :
Item               Value     Threshold  Converged?
 Maximum Force            0.000222     0.000450     YES
 RMS     Force            0.000094     0.000300     YES
 Maximum Displacement     0.000799     0.001800     YES
 RMS     Displacement     0.000401     0.001200     YES
 Predicted change in Energy=-4.375842D-07
 Optimization completed.
    -- Stationary point found.
Table 6 = Item Table of NH3BH3
Frequency File : Frequency file: OLIVIAPINI_NH3BH3_FREQ.log
Low Frequencies :
Low frequencies ---   -0.0013   -0.0012    0.0006   20.2661   23.7950   39.7039
Low frequencies ---  266.0768  632.8452  639.9192
Table 7 = Low frequencies of NH3BH3
Jmol dynamic image :
NH3BH3 |
Figure 8 = JMol of NH3BH3
Energy
E(NH3)= -56.55777 a.u.
E(BH3)= -26.61532 a.u.
E(NH3BH3)= -83.22469 a.u.
Association energy:
ΔE = [E(NH3)+E(BH3)] - E(NH3BH3)= [(-56.55777) + (-26.61532)] - (-83.22469)= 0.0518 a.u. = 136 KJ/mol
This bond can be said to be of medium strength when compared to the C-C bond in isoelectronic ethane, which has a bond strength of 346 kJ/mol, as there is a difference of 210 KJ/mol. The difference can be attributed to this molecule having poorer orbital overlap as boron is less electronegtative then nitrogen so will have higher energy orbitals. Whereas in ethane, the two carbon atoms will have the exact same energy orbitals and so will have a larger energy splitting and so stabilization.(2)
Smf115 (talk) 16:23, 26 May 2018 (BST)Correct calculation and well chosen comparison with the literature value referenced. To improve, when manipulating the energies in calculations you can use more decimal places to remove any rounding errors, good consideration of the accuracy of reported energies though.
Using a mixture of basis-sets and psuedo-potentials - Create a Molecule of BBr3
BBr3
Method : B3LYP
Basis set : 6-31G(d,p)LANL2DZ
Summary Table :
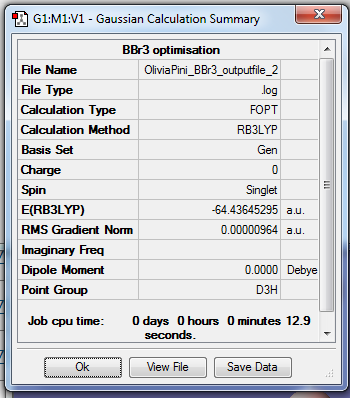
Figure 9 = Summary Table of BBr3
Item Table :
Item               Value     Threshold  Converged?
 Maximum Force            0.000019     0.000450     YES
 RMS     Force            0.000013     0.000300     YES
 Maximum Displacement     0.000116     0.001800     YES
 RMS     Displacement     0.000076     0.001200     YES
 Predicted change in Energy=-3.341339D-09
 Optimization completed.
    -- Stationary point found.
Table 8 = Item Table of BBr3
Frequency File : Frequency file published on Dspace: DOI:10042/202423
Frequency file from Gaussian: OliviaPini_BBr3_outputfile_frequency_4.log
Low Frequencies :
Low frequencies ---   -0.0126   -0.0064   -0.0047    2.6412    2.6412    4.9503
Low frequencies ---  155.9599  155.9619  267.6868
Table 9 = Low frequencies of BBr3
Jmol dynamic image :
BBr3 |
Figure 10 = JMol of BBr3
Smf115 (talk) 16:24, 26 May 2018 (BST)Excellent section 1 with well presented structure information.
Aromaticity
Benzene
Method : B3LYP
Basis set : 6-31G
Summary Table :
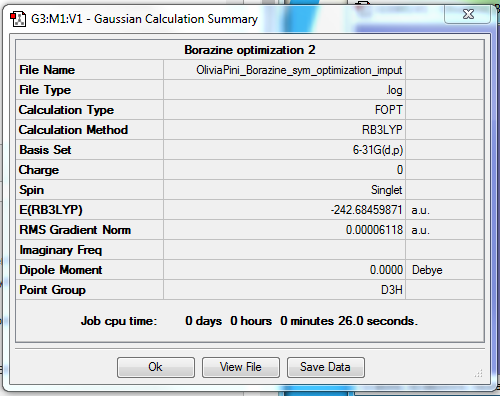
Figure 11 = Summary Table of benzene
Item Table :
Item               Value     Threshold  Converged?
 Maximum Force            0.000194     0.000450     YES
 RMS     Force            0.000077     0.000300     YES
 Maximum Displacement     0.000824     0.001800     YES
 RMS     Displacement     0.000289     0.001200     YES
 Predicted change in Energy=-4.246203D-07
 Optimization completed.
    -- Stationary point found.
Table 10 = Item Table of benzene
Frequency File : Frequency file: OLIVIAPINI_BENZENE_SYM_OPT_3.log
Low Frequencies :
Low frequencies ---   -2.1456   -2.1456   -0.0089   -0.0043   -0.0042   10.4835
Low frequencies ---  413.9768  413.9768  621.1390
Table 11 = Low frequencies of benzene
Jmol dynamic image :
Benzene |
Figure 12 = JMol of benzene
Borazine
Method : B3LYP
Basis set : 6-31G
Summary Table :
Figure 13 = Summary Table of borazine
Item Table :
 Item               Value     Threshold  Converged?
 Maximum Force            0.000083     0.000450     YES
 RMS     Force            0.000031     0.000300     YES
 Maximum Displacement     0.000238     0.001800     YES
 RMS     Displacement     0.000071     0.001200     YES
 Predicted change in Energy=-8.544777D-08
 Optimization completed.
    -- Stationary point found.
Table 12 = Item table of borazine
Frequency File : Frequency file: OLIVIAPINI_BORAZINE_FREQUENCY_2.log
Low Frequencies :
Low frequencies ---   -6.7608   -6.7277   -6.2964   -0.0097    0.0561    0.1335
Low frequencies ---  289.2382  289.2486  403.7829
Table 13 = Low frequencies of borazine
Jmol dynamic image :
Borazine |
Figure 14 = JMol of borazine
MO Comparisons
Charge Distribution analysis
| Atom | Charge Distribution |
| C | (-0.239) |
| H | (0.239) |
Table 14: Charge Distribution in benzene.
| Atom | Charge Distribution |
| N | (-1.102) |
| B | (0.747) |
| H(attached to B) | (-0.077) |
| H(attached to N) | (0.432) |
Table 15: Charge Distribution in borazine.
Figure 15: Charge Distribution using colour in benzene.
Figure 16: Charge Distribution using colour in borazine.
From both of the above methods of depicting charge it can be seen that in benzene the charge is the same for all the carbons and so all of the hydrogen's. Also overall it is much more neutral then borazine as it is made only of carbons and so all the carbons have the same electronegativity, meaning the charge is shared equally over all the atoms. This equal distribution of charge supports the idea of having a symmetric molecule with complete even delocalisation of electron density all over the molecule. The hydrogen's have a positive charge distribution compared to the carbons as they are less electronegative and so will attract less electron density towards themselves. Whereas in borazine, the nitrogen's have a much more negative charge density, both then the boron's as well the carbons in benzene, as they are more electronegative and so pull the electrons in both the sigma and pi bonds towards themselves. Like in benzene, the hydrogen's attached to the nitrogen have a more positive charge density, as they are more electropositive. Whereas, the hydrogen's attached to the boron are basically neutral. This is because hydrogen is more electronegative then boron and so should have a more negative charge distribution but hydrogen's don't want to hold so much electron density and so appear almost neutral. The boron's in borazine have a positive charge distribution as they are less electronegative then nitrogen so do not attract electron density towards themselves as well. Overall, benzene has a symmetric charge distribution, due to it being made of only carbons and hydrogen's, whereas borazine has a less symmetric distribution due to differences in electronegativity between nitrogen and boron. Additionally, the charge distribution of the carbons in benzene is in between that of the nitrogen's and boron's in borazine, which is expected as carbons electronegativity is intermittent of that of boron and nitrogen (it is more electronegative then boron but less electronegative then nitrogen).
Smf115 (talk) 18:42, 26 May 2018 (BST)Clear presentation of the tabulated charges and the same colour range used to highlight the charge distribution across both molecule. Good analysis of the charges which could be improved by the developing the explainations more, such as mentioning the point groups and symmetry reduction between the molecules, and considering the lack of net charge for both molecules.
Concept of aromaticity
There are many ways to categorize if a molecule is aromatic or not. One of these ways is using Huckel's Rule, which states that a planar compound with a contiguous, cyclic array of p-orbitals perpendicular to the plane of the molecule will be aromatic if it has (4n + 2) p-electrons. These aromatic compounds will also display an increased level of stabilization. If a molecule has all these characteristics but only (4n) p-electrons then using this theory, it is named anti-aromatic and should display particular destabilization and instability. Both benzene and borazine are planar with interacting p-orbitals on all the atoms and have 6 p-electrons (4n +2 = 6 when n=1), meaning using Huckel's rule they are both aromatic.
Other ground state properties have also been discovered to indicate if a molecule is aromatic or not and these are (3):
- Aromatic compounds will be more stable then if they were to have localized single and double bonds and this difference in energy is referred to as resonance energy.
- The bond lengths will be in between those expected for the typical single and double bonds of that system, illustrating the delocalisation of the electrons all over the molecule.
- Placing these systems in an external magnetic field causes a pi-electron ring current, causing the hydrogen's outside the ring to have a higher chemical shift value. The hydrogen's in exocyclic environments feel both the external magnetic field as well as the induced pi current, meaning they are more deshielded.
- Aromatic molecules normally take part in reactions in which the pi-electron structure is reformed (e.g. aromatic substitution), as it allows the extra stabilization of these systems to be regained.
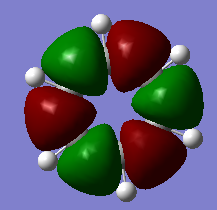
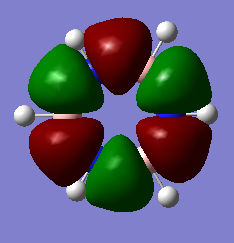
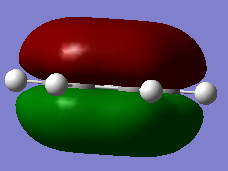
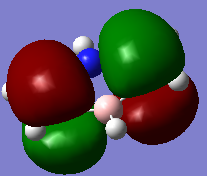
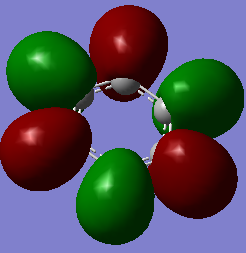
One of the common basic ideas of aromaticity is that there is delocalisation of electron density over the whole molecule. The real MOs represent this very effectively as all the orbitals representing pi-bonds illustrated continuously bonded p-orbitals orthogonal to the plane of the ring, forming electron clouds above and below the plane of the ring, showing delocalisation. However, many other MOs were computed with sigma character that would also have played a part in the overall bonding of the molecule and so it can be seen that aromaticity is much more complex then just a cyclic array of continuously conjugated p-orbitals perpendicular to the plane of the ring with (4n + 2) p-electrons.
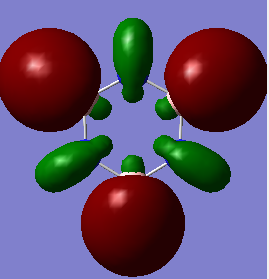
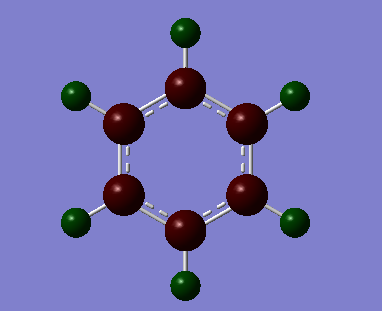
The overlapping of pz-orbitals is not a good description for aromaticity as other orbitals also take part in bonding that leads to delocalisation. For example in the first valence MO of both benzene and borazine (Fig. 17) there is overlap of a 2s-orbitals on all the atoms, forming a delocalised cloud of electrons that will help add to the aromatic character of the molecules. Additionally, the p-orbitals in the plane of the ring can also overlap in a sigma fashion (head-on overlap) and again form a delocalised cloud of electron density, creating aromaticty (Fig. 18). Therefore, overall it is not just the p-orbitals orthogonal to the plane of the ring that can overlap causing delocalisation and aromaticity - s-orbitals and the p-orbitals in the plane of the ring can also take part in delocalised bonding adding to the overall aromaticity of the molecule. This is known as σ-aromaticty and demonstrates why just using overlapping pz-orbitals is not a perfect representation of the bonding in the molecule.
Fig. 17 = s-orbitals overlapping causing delocalisation so adding to aromaticity. a) Benzene b) Borazine
Fig. 18 = p-orbitals in the plane of the ring overlapping in a sigma fashion, causing delocalisation so adding to aromaticity. a) Benzene b) Borazine
Smf115 (talk) 18:46, 26 May 2018 (BST)Great discussion of the key concepts of aromaticity and some more complex ideas. Great reference to the MOs just visualised to explain why overlapping pZ AOs are a bad descriptor and to illustrate sigma-aromaticity.
Smf115 (talk) 18:46, 26 May 2018 (BST)Overall a very good and well presented report.
References
1) Hunt Research Group, http://www.huntresearchgroup.org.uk/teaching/teaching_comp_lab_year2a/Tut_MO_diagram_BH3.pdf, (accessed May 2018).
2)Chemistry 301, https://ch301.cm.utexas.edu/section2.php?target=thermo/thermochemistry/enthalpy-bonds.html, (accessed May 2018).
3) M. Palusiak, T. M. Krygowski, Chem. Eur. J. 2007, 13, 7996 – 8006.

