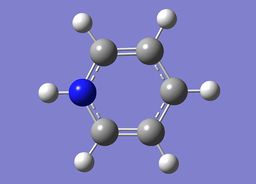
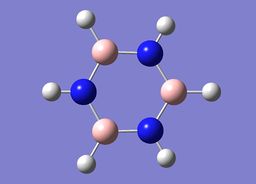
OliverConnor
Introduction
The extensibility and analytical capacity of computational chemistry with regard to inorganic molecules was explored within this study. Within GaussView 5.0, inorganic molecules were optimised with defined basis sets to provide valuable structural data. Frequency analysis of the optimised molecules provided details of the vibrational frequencies present and thus allowed for the prediction of infra-red spectra. Further computations yielded data regarding molecular orbitals and their respective energies as well as the charge distribution and bonding composition within the molecule. Where more sophisticated calculations were employed during the study, input files were submitted from GaussView 5.0 to the HPC.
BH3
Optimisation of BH3
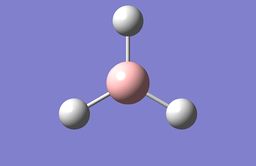
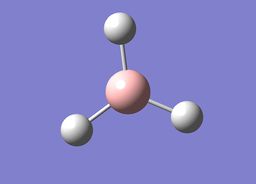
A BH3 molecule(shown below) was created using GaussView, with each B-H bond fixed at a length of 1.5 A. The BH3 molecule was subjected to an optimisation calculation [OPT] using B3LYP as the method and a basis set of 3-21G. The B3LYP method is related to the approximations enforced during the Schrödinger calculation and the basis set 3-21G determines the accuracy. Although 3-21G is of low accuracy it results in a very rapid calculation.
The file for the BH3 [3-21G] optimisation is found here.
The table below shows that the 3-21G optimisation was successful with both the force and displacements converging:
 Item                        Value     Threshold  Converged?
 Maximum Force            0.000413     0.000450     YES
 RMS     Force            0.000271     0.000300     YES
 Maximum Displacement     0.001610     0.001800     YES
 RMS     Displacement     0.001054     0.001200     YES
 Predicted change in Energy=-1.071764D-06
 Optimization completed.
    -- Stationary point found.
The Schrödinger equation is solved under the constraints defined by the Born-Oppenheimer approximation [i.e nuclei position is assumed to be stationary with regard to electron motion]. Within the process of optimisation the Schrodinger equation is solved for the electrons with varying nuclei position, until the energy obtained is at a minimum. Thus, the optimisation procedure can be considered with regard to a Potential Energy Surface (PES), whereby the energy is dictated by the nuclei and electron coordinates. The molecule will experience forces F(R) when a change in position [ΔR] causes a change in energy E(R). When this criteria is not fulfilled i.e the nuclear and electron are in equilibrium, the molecule will experience no forces. The force experienced by the molecule is related to the potential energy and nuclei displacement through F= -dE/dr [where E is the potential energy and r is the nuclei displacement]. Thus, at equilibrium structure the gradient of the curve, which is the first derivative dE/dr, would be zero. Hence, the force experienced at equilibrium is zero.
As seen in the table above, the maximum force and displacement values are lower than the threshold value. This reflects the molecules movement along the PES surface, towards the equilibrium position and hence experiencing a lower force.
Energy and gradient changes during optimisation of BH3 molecule
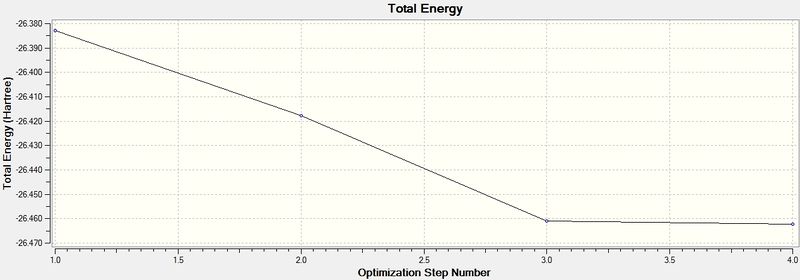
The graph above represents the program traversing the Potential Energy Surface (PES) to attain the minimum energy structure of BH3. At an initial high energy, this reflects the close proximity of the nuclei (hence a repulsive interaction). Thus, the gradual decrease in energy during the optimisation reflects the movement towards the stable equilibrium position.
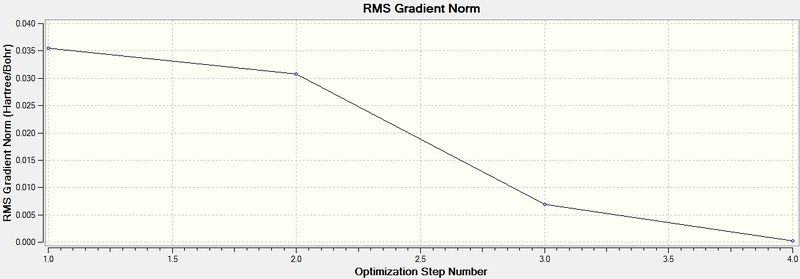
The graph above represents the Root Mean Square Gradient, showing clearly the gradient of the Potential Energy Surface tending towards zero as the equilibrium structure of BH3 is obtained.
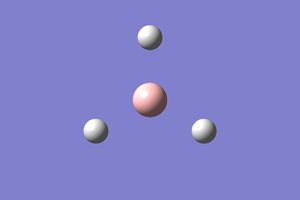
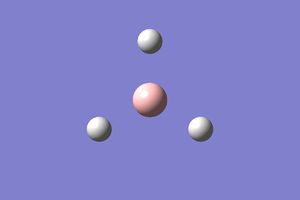
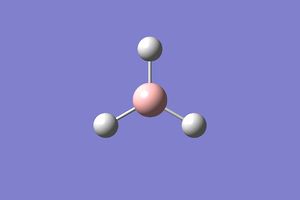
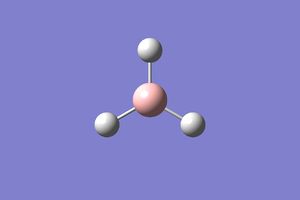
Depiction of structure at each optimisation step
Higher level basis set
As the basis sets directly correlates to the number of functions describing the electronic structure, a higher basis set offers a more accurate result. Thus, progressing from the B3LYP basis set, a higher level basis set was used in the form of 6-31G (d,p). It should be noted that the structure energy obtained from this optimisation can't be compared to the previous 3-21G optimisation as the same basis-sets were not used in the calculation.
The file for the BH3 [6-31G (d,p)] optimisation is found here.
This B-H bond distance of 1.19Å is the identical to that found in literature, 1.19Å.[1].
The table below shows that the 6-31G (d,p) optimisation was successful with both the force and displacements converging:
 Item                      Value     Threshold  Converged?
 Maximum Force            0.000433     0.000450     YES
 RMS     Force            0.000284     0.000300     YES
 Maximum Displacement     0.001702     0.001800     YES
 RMS     Displacement     0.001114     0.001200     YES
 Predicted change in Energy=-1.189019D-06
 Optimization completed.
    -- Stationary point found.
TBr3
Optimisation of TlBr3
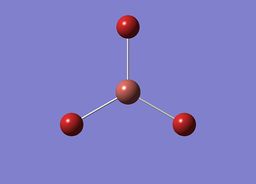
Having examined the optimisation of BH3 under differing criteria, an investigation into TlBr3 was undertaken using a medium level basis set. TlBr3 is a very electronic rich molecule owing to the 35 electrons on each Br atom [Electron configuration: 1s22s22p63s23p64s23d104p5] in addition to 81 electrons on Thallium. Both atoms exhibit relativistic effects which can't be recovered using the standard Schrödinger equation. Thus, pseudo-potentials are enforced in attempt to recover some of these effects.
The file for the TlBr3 [LANL2DZ] optimisation is found here.
Published in D-Space:DOI:10042/22524
The observed bond length in Tl-Br [2.65Å] is in agreement with literature, 2.52Å [2].
The table below shows that the LANL2DZ optimisation was successful with both the force and displacements converging:
 Item                      Value     Threshold  Converged?
 Maximum Force            0.000002     0.000450     YES
 RMS     Force            0.000001     0.000300     YES
 Maximum Displacement     0.000022     0.001800     YES
 RMS     Displacement     0.000014     0.001200     YES
 Predicted change in Energy=-6.084075D-11
 Optimization completed.
    -- Stationary point found.
BBr3
Optimisation of BBr3
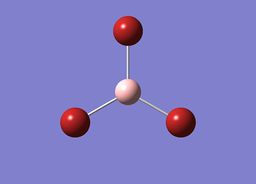
Given the heavier nature of the bromine atoms in BBr3 relative to the hydrogen atoms in BH3 the use of pseudo-potentials is required. Thus, by using a normal 6-31G (d,p) for the central Boron atom and a LanL2DZ pseudo-potential for the Bromine atoms a more accurate calculation can be undertaken on the BBr3 molecule. This criteria was enforced a GEN basis set.
The file for the BBr3 Gen optimisation is found here.
Published in D-space:DOI:10042/22525
The B-Br bond distance calculated [1.93Å] is in accordance with that found in literature, 1.89Å [3]
The table below shows that the Gen optimisation was successful with both the force and displacements converging:
Item                        Value     Threshold  Converged?
 Maximum Force            0.000008     0.000450     YES
 RMS     Force            0.000005     0.000300     YES
 Maximum Displacement     0.000036     0.001800     YES
 RMS     Displacement     0.000023     0.001200     YES
 Predicted change in Energy=-4.027672D-10
 Optimization completed.
    -- Stationary point found.
Structural analysis BH3,BBr3 and TlBr3
| Bond length analysis | ||
|---|---|---|
| Molecule | Bond length [Å] | |
| BH3 | 1.19359 | |
| TlBr3 | 2.65095 | |
| BBr3 | 1.93396 | |
There is a significant disparity in the bond lengths observed within the optimised molecules, BH3, BBr3 and TlBr3. The electronic configurations for the central atoms and ligands present are shown in the table below:
| Atom | Electronic Configuration |
| H | 1s1 |
| B | 1s22s22p1 |
| Br | 1s22s22p63s23p64s23d104p5 |
| Tl | [Xe] 4f145d106s26p1 |
As shown in the table above BrBr3 has a larger bond length relative to that of BH3. The molecules differ only in the ligands attached to the central boron atom, thus any disparity can be accounted for by considering the nature of Hydrogen [Period 1] and Bromine [Period 4] atoms. Bromine has a significantly higher nuclear charge [Zeff] compared to that of Hydrogen, thus the electrons within the Bromine atoms bonded to the Boron experience significantly greater shielding. The valence orbital of Bromine [4p] is significantly larger and more diffuse that of Hydrogen [4p]. Thus, a weaker orbital overlap occurs between Bromine's 4p orbital and Boron's 2p valence orbital, relative to the orbital overlap between Boron's 2p orbital and Hydrogen's 1s orbital. This accounts for the shorter bond length between Boron and Hydrogen.
With regards to the Pauling scale, Hydrogen has a an electronegativity of 2.2, Boron 2.0 and Bromine 2.96. The difference in electronegativities between two atoms has a direct effect on the nature of the bond between them. The greater difference observed between Boron and Bromine suggests that the bond is more polar than that of Boron and Hydrogen. In essence the electron density within the molecule will be distorted towards the Bromine ligands.
In the optimisation of the TlBr3, the central Boron atom [Period 2] was replaced with a more electron-rich element, Thallium [Period 6]. The valence electron within Thallium is in a larger more diffuse orbital [6p1] relative to that of Boron [2p]. Thus, the valence orbital of Boron 2p orbital has a greater overlap with the 4p orbital of the Bromine atom within BBr3 compared to the overlap observed between the Thallium 6p and Bromine 4p orbital. This is in concurrence with the short B-Br bond [1.93Å] observed and longer Tl-Br bond distance [2.65Å].
As an exponent of the inert pair effect, Tl(III) is the less common oxidation form of Thallium, relative to Tl( I). Thus, a three coordinate Thallium compound is relatively unstable compared to the more commonly observed BR3 compound [B(III) oxidation state].
Defining a bond
As can be seen from the structure of BH3 after one optimisation step, there are no bonds present. The depiction of bonds within Gaussview is purely dependent on distance criteria, thus the absence of a bond is a consequence of the bond length exceeding a threshold value within the Gaussview programme. In accordance with valence bond theory, a covalent bond can be defined as the build up of electron density between two or more nuclei as a consequence of the overlap of their respective valence atomic orbitals. This a theory extended from Lewis' initial definition of a covalent bond, whereby atoms share a pair of electrons. With regards to the nature of an ionic bond, one can provide a definition based on the electrostatic attraction between oppositely charged ions.
Frequency Analysis of BH3
By considering the potential energy surface [PES] of BH3, one can determine whether a defined position on the curve is a minima or maxima by calculating the second derivative,d2y/dx2. Thus, calculating the second derivative is the essence of frequency, hence, if the calculated frequencies are all positive this suggests a minimum on the curve.
Using the optimised 6-31G (d,p) BH3 molecule a "Frequency" job type was enforced to acquire a set of low frequencies and ensure the optimised BH3 molecule was a minimum.
The file for the frequency analysis of BH3 is found here.
The first line of low frequencies corresponds to the -6 component of the 3N-6 vibrational frequencies observed within any given molecule. These frequencies are due to the motions of the center of mass of the molecule and are within an acceptable range of +/- 15 cm-1. They are an order of magnitude smaller than the "real" frequencies [which are always positive] found on the second line.
Low frequencies ---   -7.0794   -7.0439   -0.0279   -0.0006    0.7084    6.6303

Low frequencies --- 1163.0023 1213.1577 1213.1579
Having run this calculation, the point group of the BH3 molecule was fixed as D3H and the frequency calculation repeated.
The file for the frequency analysis with D3H point group imposed is found here.
Low frequencies ---   -6.9471   -6.9095   -0.0273   -0.0003    0.7219    6.7701

Low frequencies --- 1163.0029 1213.1581 1213.1583
| Frequency analysis of BH3 | ||||||||
|---|---|---|---|---|---|---|---|---|
| No. | Image | Form of vibration | Frequency (cm-1) | Infrared | Symmetry Point Group | |||
| 1 |
|
3H Symmetrical in and out-of-plane bending, Boron moves in opposite direction | 1163 | 92.5653 | A2' | |||
| 2 |
|
3H asymmetric rocking [2H same direction, 1H opposite] | 1213.16 | 14.0563 | E1‘ | |||
| 3 |
|
2H in-plane scissoring 1H stationary | 1213.16 | 14.0558 | E1‘ | |||
| 4 |
|
3H Symmetric stretching | 2582.48 | 0.0000 | A1‘ | |||
| 5 |
|
2H Asymmetric stretching 1H slight bending | 2715.61 | 126.3355 | E1‘ | |||
| 6 |
|
2H Symmetric stretching 1H anti-symmetric stretching | 2715.61 | 126.3294 | E1‘ | |||
Infrared Spectrum of BH3
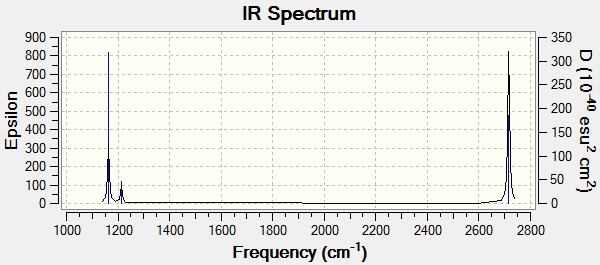
Although 6 vibrations have been calculated, there are only three peaks observed in the spectrum. The first peak is due to 3H symmetrical bending [1163cm-1], whilst degeneracy occurs with the two vibrations at 1213.16cm-1 [E1‘ point group] and the two vibrations at 2715.61cm-1 [E1‘ point group], hence only one peak is observed at their respective wavenumbers. In order for a vibrational mode within any molecule [in this case BH3] to be infra-red active, there must be a change in dipole. Hence, for the vibration that occurs at 2582.48cm-1 there is no change of dipole moment and no peak is observed in the IR spectrum.
Frequency analysis of TlBr3
Using the optimised LANL2DZ TlBr3 molecule a "Frequency" job type was enforced to acquire a set of low frequencies and ensure the previously optimised TlBr3 structure is a minimum. The lowest real frequency is 46.7cm-1.
The file for the frequency analysis is found here.
Published in D-space: DOI:10042/22526
These frequencies are due to the motions of the center of mass of the molecule and are within an acceptable range of +/- 15 cm-1. They are an order of magnitude smaller than the "real" frequencies found on the second line.
Low frequencies ---   -0.0013   -0.0006    0.0000    1.8492    2.6414    2.6414
Low frequencies ---   46.6990   46.6991   51.9486
| Frequency analysis of TlBr3 | ||||||||
|---|---|---|---|---|---|---|---|---|
| No. | Image | Form of vibration | Frequency (cm-1) | Infrared | Symmetry Point Group | |||
| 1 |
|
2Br In-plane scissoring 1Br stationary | 46.70 | 3.6816 | E‘ | |||
| 2 |
|
3Br asymmetric rocking [2Br same direction, 1Br opposite] | 46.70 | 3.6816 | E1‘ | |||
| 3 |
|
3Br Symmetric in and out-of-plane bending, Tl atom moves in opposite direction | 51.95 | 5.8464 | A2' | |||
| 4 |
|
3Br Symmetric stretching | 165.28 | 0.0000 | A1 | |||
| 5 |
|
2Br Symmetric stretching 1Br asymmetric sretching | 210.76 | 25.4735 | E1‘ | |||
| 6 |
|
2Br Asymmetric stretching 1Br stretches out of phase | 210.76 | 25.4736 | E1‘ | |||
Infrared spectrum of TlBr3
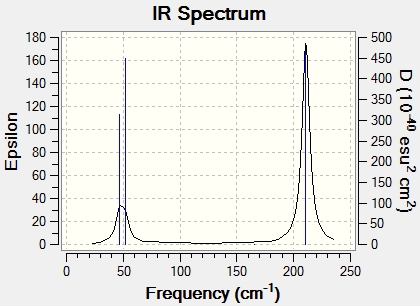
Although 6 vibrations have been calculated, there are only three peaks observed in the spectrum. The first peak is due to 3Br symmetrical bending [51.95cm-1], whilst degeneracy occurs with the two vibrations at 46.7cm-1 [E1‘ point group] and the two vibrations at 165.28cm-1 [A1 point group], hence only one peak is observed at their respective wavenumbers. In order for a vibrational mode within any molecule [in this case TlBr3] to be infra-red active, there must be a change in dipole. Hence, for the vibration that occurs at 165.28cm-1 there is no change of dipole moment and no peak is observed in the IR spectrum.
Comparison of BH3 and TlBr3 vibrational frequencies
| Frequency analysis | ||
|---|---|---|
| No. | Frequency BH3[cm-1] | Frequency TlBr3[cm-1] |
| 1 | 1163 | 46.70 |
| 2 | 1213.16 | 46.70 |
| 3 | 1213.16 | 51.95 |
| 4 | 2582.48 | 165.28 |
| 5 | 2715.61 | 210.76 |
| 6 | 2715.61 | 210.76 |
By direct comparison of vibrational frequencies, it is clear that those observed in BH3 are significantly higher than those found within TlBr3. The magnitude of bonds vibrational frequencies is related to the intrinsic strength of the bond in question. This is in accordance with the harmonic oscillator approximation which is derived from Hooke's law. Hooke's law states that the deviation of a system from its equilibrium position is proportional to the restoring force i.e F= -kx [where F is the restoring force, k is a positive force constant and x is the displacement]. The vibrational energy levels within a harmonic oscillator are computed as Ev = (v+1/2)ħω with the frequency,ω, defined as ω = (kf/μ)½ [where μ(reduced mass)= m1m2/m1+m2]. Due to the inverse relation between the frequency and reduced mass,μ, the larger the summation of two atoms within a particular bond, the smaller the vibrational frequency. Thallium possess a molecular mass of 204.4, whereas, Bromine has a significantly lower mass of 79.9. Thus, in the case of TlBr3 the larger reduced mass of the Tl-Br bond relative to that of B-Br results in a lower vibrational frequency observed.
As expected from the isostructural nature of BH3 and TlBr3, both possess six vibrational frequencies. There has however has been a rearrangement of vibrational modes present. In the case of BH3 the frequencies increase in the order A2', E1',E1',A1,E1',E1' whereas for TlBr3 an E1', E1',A2',A1,E1',E1' arrangement is observed.
Molecular vibrations can be broadly categorized into either stretching or bending modes [i.e rocking,scissoring, wagging, twisting]. The frequency at which at which a stretch mode [i.e energy required to stretch a bond,as E = hω] is higher than that of a corresponding bending mode. Hence, in the case of both BH3 and TlBr3 the bending modes appear at a significantly lower frequency than those of a stretching nature.
The close proximity of the A2 and E1' as well as A1' and E1' vibrational modes [at a higher energy] is a notable feature of the vibrational analysis of BH3 and TlBr3. The lower E1' modes and A2 vibrational mode in both molecules exhibit identical rocking,scissoring and bending vibrational motions. These bending modes require a similar amount of energy to cause each perturbation hence the similar energies observed [BH3 : A2 1163cm-1 and E1' 1213.16cm-1 : TlBr3 E1' 46.70cm-1 and 51.95cm-1 A1'].
However, in the case of TlBr3, the A2' mode is at a higher energy compared to the lower energy E1' vibrations. This is due to the heavy mass of the Bromine atoms requiring a larger frequency to bend the ligands in and out of plane. In the case of BH3 the A2' mode is below the E1' vibrations due to the ease at which the small and relatively light Hydrogen ligands can be bend in and out of plane.
Both spectrum contain three peaks despite the presence of 6 calculated vibrations. The degeneracy of the lower and higher E1‘ modes, results in only one peak observed at their respective wavenumbers. Whilst, the absence of a peak at 2582.48cm-1 in BH3 and 165.28cm-1 in TlBr3 165.28cm-1 is due to a lack of dipole moment change, therefore no peak is observed in the IR spectrum i.e the mode is IR inactive.
It should be noted that the same method and basis set must be used for both optimisation and frequency calculations otherwise the the calculation is invalid and incomparable.
Molecular orbital analysis of BH3
Having considered the optimisation and frequency output obtained from previous calculations, the electronic structure of BH3 was subsequently analysed. Through the use of an "Energy" methodology the quantitative molecular orbitals of BH3 were realized.
The file for the molecular orbital analysis of BH3 is found here.
Published in D-space: DOI:10042/22460
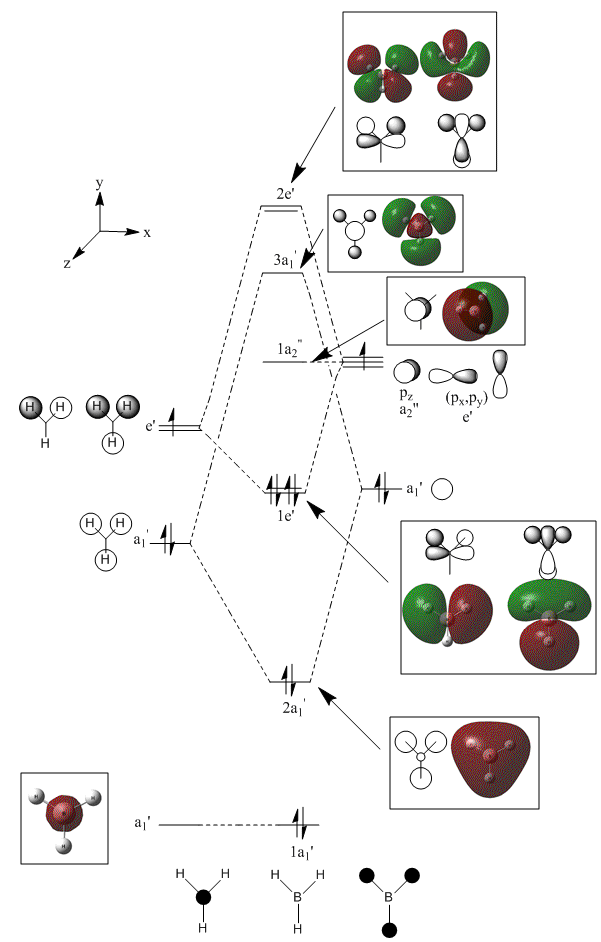
As shown in the diagram above, the real molecular orbitals are very similar to LCAO molecular orbitals. This shows both the high quality and accuracy of the qualitative molecular orbital calculated.
NH3
Optimisation of NH3
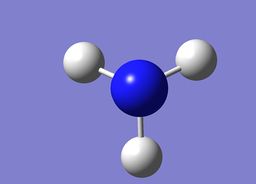
A NH3 molecule(shown below) was created using GaussView. The NH3 molecule was subjected to an optimisation calculation [OPT] using B3LYP as the method and a basis set of 6-31G (d,p).
The file for the optimised NH3 [6-31G (d,p)] optimisation is found here.
The computed N-H bond distance [1.02Å] is in agreement with that referenced in literature, 1.01Å[4].
The table below shows that the 6-31G (d,p) optimisation was successful with both the force and displacements converging:
Item               Value     Threshold  Converged?
 Maximum Force            0.000024     0.000450     YES
 RMS     Force            0.000012     0.000300     YES
 Maximum Displacement     0.000088     0.001800     YES
 RMS     Displacement     0.000056     0.001200     YES
 Predicted change in Energy=-1.756558D-09
 Optimization completed.
    -- Stationary point found.
Frequency analysis for NH3
Using the optimised 6-31G (d,p) NH3 molecule a "Frequency" job type was enforced to acquire a set of low frequencies and ensure the optimised NH3 structure is a minimum
The file for the frequency analysis is found here.
Published in D-space: DOI:10042/22527
The first line of low frequencies corresponds to the motions of the center of mass of the molecule and are within an acceptable +/- 15 cm-1. They are an order of magnitude smaller than the "real" frequencies found on the second line.
Low frequencies ---   -8.7643   -0.0003    0.0003    0.0013    9.3391   13.7048
Low frequencies --- 1089.3130 1693.9216 1693.9467
| Frequency analysis of NH3 | ||||||||
|---|---|---|---|---|---|---|---|---|
| No. | Image | Form of vibration | Frequency (cm-1) | Infrared | ??Symmetry Point Group | |||
| 1 |
|
3H wagging | 1089.31 | 145.4451 | E‘ | |||
| 2 |
|
2H in-plane scissoring 1H out of plane bend | 1693.92 | 13.5608 | E‘ | |||
| 3 |
|
2H in-plane scissoring 1H out-of plane wagging | 1693.95 | 13.5562 | A2“ | |||
| 4 |
|
3H Symmetric stretching | 3461.28 | 1.0589 | A1 | |||
| 5 |
|
2H Symmetric stretching 1H asymmetric sretching | 3589.76 | 0.2690 | E1‘ | |||
| 6 |
|
2H Asymmetric stretching 1H stationary | 3589.93 | 0.2700 | E1‘ | |||
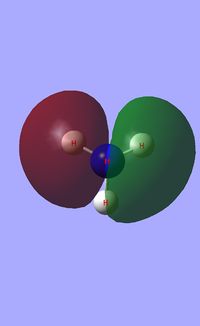
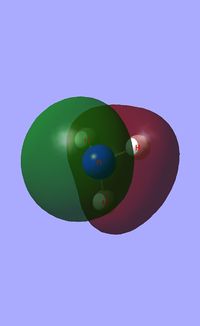
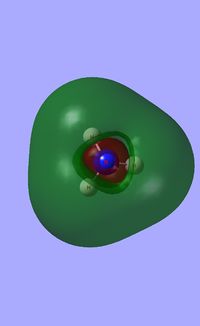
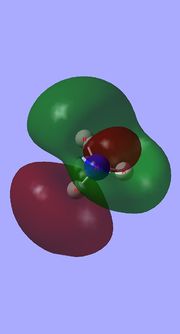
Molecular orbital analysis of NH3
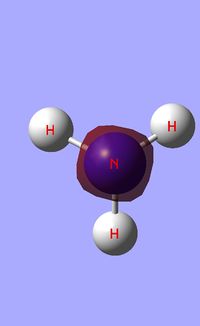
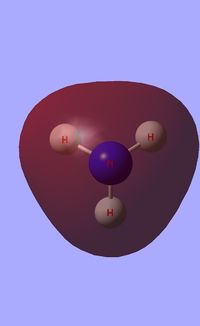
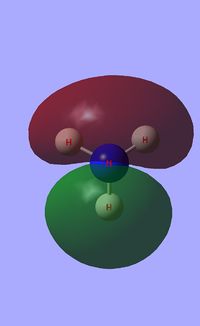
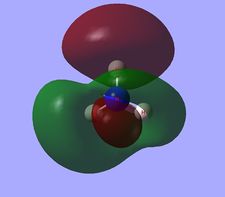
Having considered the optimisation and frequency output obtained from previous calculations, the electronic structure of NH3 was subsequently analysed. Through the use of an "Energy" methodology the quantitative molecular orbitals of NH3 were realized.
Published in D-space: DOI:10042/22528
Natural Bond Orbital Analsyis
Natural bond orbital analysis [NBO] was then undertaken on the log.file computed for the optmisied NH3 molecule.
The charge range for the NBO charge distribution was -1.0 to +1.0.
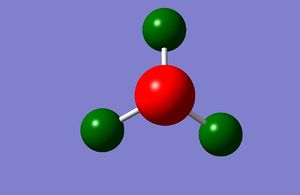
The specific NBO charges for nitrogen and hydrogen were then analsyed. Nitrogen has a negative charge,-1.125, and hydrogen a positive charge, 0.325. This distribution is as expected given the electronegative nature of nitrogen, withdrawing electron from the three coordinating hydrogens.

The table below outlines the charge distribution observed within NH3.
Summary of Natural Population Analysis:

                                       Natural Population
                Natural  -----------------------------------------------
    Atom  No    Charge         Core      Valence    Rydberg      Total
 -----------------------------------------------------------------------
      N    1   -1.12515      1.99982     6.11104    0.01429     8.12515
      H    2    0.37505      0.00000     0.62250    0.00246     0.62495
      H    3    0.37505      0.00000     0.62250    0.00246     0.62495
      H    4    0.37505      0.00000     0.62249    0.00246     0.62495
As shown in the table above, a greater contribution from the N orbitals is observed in the 2c-2e N-H bond. The nitrogen 24.87%s 75.05%p is essentially sp3 hybridised. The 1s atomic orbital of nitrogen [core orbital] is 100% in character. With regard to the lone pair on nitrogen, this is 24.38%s 75.52% p in nature i.e sp3 hybridised. The orbital is formally occupied, hence the observed occupancy close to 2 [1.99721].
NH3BH3
NH3BH3 optimisation
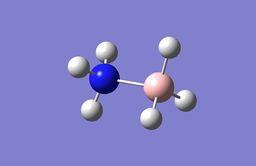
A NH3BH3 molecule was created using Gaussview and was subjected to an optimisation calculation [OPT] using B3LYP as the method and a basis set of 6-31G(d,p).
The optimised file is found here.
The table below shows that the 6-31G (d,p) optimisation was successful with both the force and displacements converging:
Item               Value     Threshold  Converged?
 Maximum Force            0.000134     0.000450     YES
 RMS     Force            0.000038     0.000300     YES
 Maximum Displacement     0.000751     0.001800     YES
 RMS     Displacement     0.000176     0.001200     YES
 Predicted change in Energy=-1.149280D-07
 Optimization completed.
    -- Stationary point found.
NH3BH3 Frequency analysis
Using the optimised 6-31G (d,p) NH3BH3 molecule a "Frequency" job type was enforced to acquire a set of low frequencies and ensure the optimised NH3BH3 structure is a minimum.
The file for the frequency analysis is found here.
Published in D-space: DOI:10042/22529
The first line of low frequencies corresponds to the motions of the center of mass of the molecule and are within an acceptable +/- 15 cm-1. They are an order of magnitude smaller than the "real" frequencies found on the second line.
Low frequencies ---  -12.1463    0.0004    0.0005    0.0005    8.6735    9.9410
Low frequencies ---  262.8488  631.1119  637.9670
Association energies
By computing the energy difference beetween NH3BH3 and its component molecules NH3 and BH3 one can determine the association energy of combining NH3 and BH3 [conversely, the dissociation energy of NH3BH3]
| Molecular energy comparison | ||
|---|---|---|
| Molecule | Energy [a.u] | |
| BH3 | -26.61532252 | |
| NH3 | -56.55776872 | |
| NH3BH3 | -83.22468975 | |
1 a.u = 2625.50 kJmol-1.
ΔE=E(NH3BH3)-[E(NH3)+E(BH3)]= -135.5 kJmol-1
This computed association energy of NH3 and BH3 is similar, although slightly lower than the -172.1kJmol-1 energy that is referenced in literature [5].
Aromaticity Project
Benzene
Benzene Optimisation
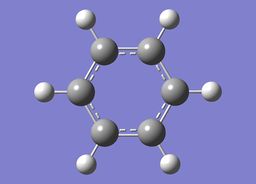
A Benzene molecule was created using GaussView and was subjected to an optimisation calculation [OPT] using B3LYP as the method and a basis set of 6-31G(d,p).
The file for the Benzene [6-31G(d,p)] optimisation is found here.
Published in D-space: DOI:10042/22546
The table below shows that the 6-31G (d,p) optimisation was successful with both the force and displacements converging:
Item               Value     Threshold  Converged?
 Maximum Force            0.000092     0.000450     YES
 RMS     Force            0.000025     0.000300     YES
 Maximum Displacement     0.000311     0.001800     YES
 RMS     Displacement     0.000105     0.001200     YES
 Predicted change in Energy=-4.900903D-08
 Optimization completed.
    -- Stationary point found.
Frequency Analysis of Benzene
Using the optimised 6-31G (d,p) Benzene molecule a "Frequency" job type was enforced to acquire a set of low frequencies and ensure the optimised Benzene structure is a minimum.
Published in D-space: DOI:10042/22560
The first line of low frequencies corresponds to the motions of the center of mass of the molecule and are within an acceptable +/- 15 cm-1. They are an order of magnitude smaller than the "real" frequencies found on the second line.
Low frequencies ---   -8.7213   -8.5863   -3.8819    0.0007    0.0009    0.0011
 Low frequencies ---  414.5002  414.5185  621.0668
| Frequency analysis of benzene | |||||||
|---|---|---|---|---|---|---|---|
| No. | Image | Form of vibration | Frequency (cm-1) | Infrared | |||
| 1 |
|
6H in and out of plane wagging | 694.82 | 74.2296 | |||
| 2 |
|
4H ortho and meta symmetric rocking, 2H para stationary | 1066.51 | 3.3868 | |||
| 3 |
|
4H ortho and meta asymmetric rocking, 2H para symmetric rocking | 1066.58 | 3.3889 | |||
| 4 |
|
4H ortho and meta symmetric rocking, 2H para stationary | 1524.53 | 6.6198 | |||
| 5 |
|
6H symmetric rocking | 1524.57 | 6.6157 | |||
| 6 |
|
4H ortho and meta asymmetric stretch, 2H para asymmetric stretch | 3196.52 | 46.6420 | |||
| 7 |
|
4H ortho and meta symmetric stretch, 2H para asymmmetric stretch | 3196.57 | 46.6253 | |||
Molecular Orbital Analysis of Benzene
Having considered the optimisation and frequency output obtained from previous calculations, the electronic structure of Benzene was subsequently analysed. Through the use of an "Energy" methodology the quantitative molecular orbitals of Benzene were realized.
Published in D-space: DOI:10042/22565
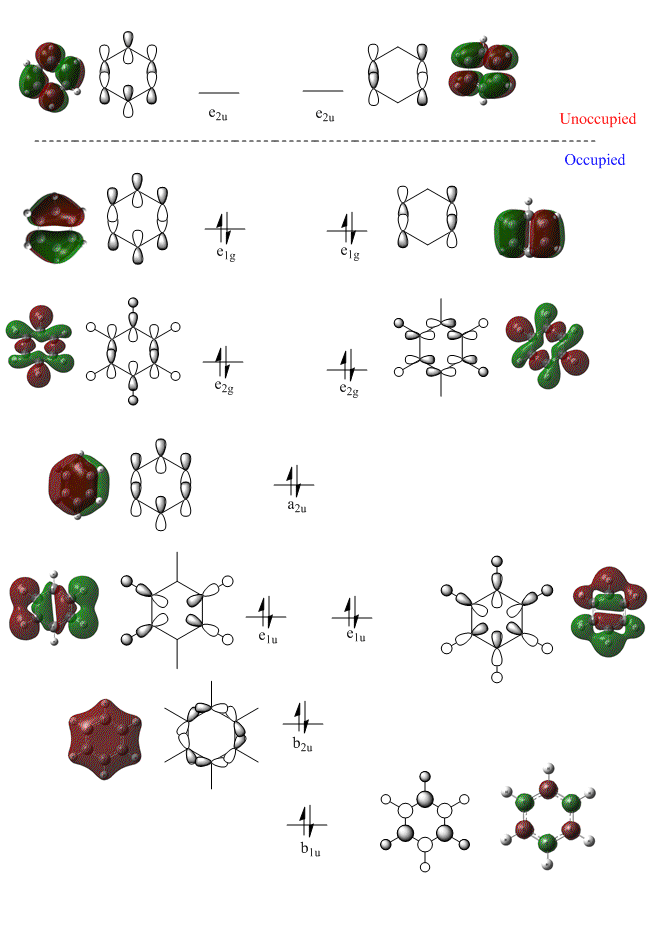
The molecular orbital diagram of benzene [shown below] includes the doubly degenerate e1g HOMO and e2uLUMO orbitals.
Natural Bond Orbital Analysis of Benzene
Natural bond orbital analysis [NBO] was then undertaken on the log.file computed for the optimised benzene molecule.
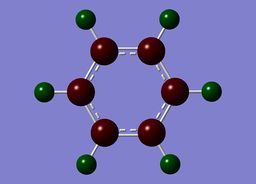
The charge range for the NBO charge distribution was -1.0 to +1.0.
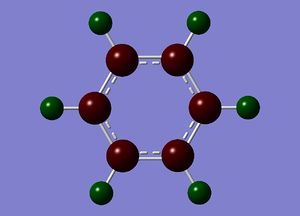
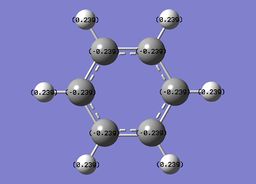
The specific NBO charges for carbon and hydrogen were then analsyed. Carbon has a negative charge,-0.239, and hydrogen a positive charge, +0.239 as expected given carbons relative electronegativity. This is shown in the image below.
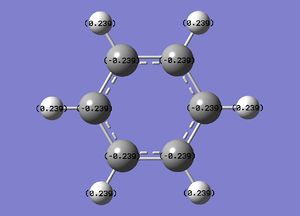
The table below outlines the charge distribution observed within Benzene.
 Summary of Natural Population Analysis:

                                       Natural Population
                Natural  -----------------------------------------------
    Atom  No    Charge         Core      Valence    Rydberg      Total
 -----------------------------------------------------------------------
      C    1   -0.23859      1.99910     4.22617    0.01331     6.23859
      C    2   -0.23860      1.99910     4.22619    0.01331     6.23860
      C    3   -0.23856      1.99910     4.22615    0.01331     6.23856
      C    4   -0.23859      1.99910     4.22617    0.01331     6.23859
      C    5   -0.23860      1.99910     4.22619    0.01331     6.23860
      C    6   -0.23856      1.99910     4.22615    0.01331     6.23856
      H    7    0.23858      0.00000     0.75998    0.00144     0.76142
      H    8    0.23859      0.00000     0.75998    0.00143     0.76141
      H    9    0.23858      0.00000     0.75998    0.00144     0.76142
      H   10    0.23858      0.00000     0.75998    0.00144     0.76142
      H   11    0.23859      0.00000     0.75998    0.00143     0.76141
      H   12    0.23858      0.00000     0.75998    0.00144     0.76142
 =======================================================================
   * Total *    0.00000     11.99462    29.91689    0.08849    42.00000
| Benzene NBO analysis | ||
|---|---|---|
| ||
| Nature of bond | Hybridisation | |
| Carbon - 50.0% Carbon - 50.0% | Carbon 35.20%s 64.76%p | |
| Carbon - 62.04%% Hydrogen - 37.96% | Carbon 29.57%s 70.39%p
Hydrogen 100%s | |
As shown in the table above, the carbon atoms witihin benzene are sp2 hybridised consistent with the delocalised pi electron density and aromaticity.
Boratabenzene
Optimisation of Boratabenzene
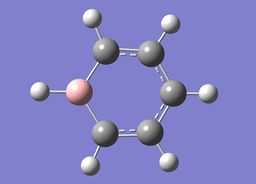
A Boratabenzene molecule was created using GaussView by replacing a C-H unit within benzene with a B-H unit. The molecule was subjected to an optimisation calculation [OPT] using B3LYP as the method and a basis set of 6-31G(d,p).
Published in D-space: DOI:10042/22616
The table below shows that the 6-31G(d,p) optimisation was successful with both the force and displacements converging:
Item               Value     Threshold  Converged?
 Maximum Force            0.000061     0.000450     YES
 RMS     Force            0.000018     0.000300     YES
 Maximum Displacement     0.000219     0.001800     YES
 RMS     Displacement     0.000071     0.001200     YES
 Predicted change in Energy=-3.221297D-08
 Optimization completed.
    -- Stationary point found.
Frequency analysis of Boratabenzene
Using the optimised 6-31G (d,p) Boratabenzene molecule a "Frequency" job type was enforced to acquire a set of low frequencies and ensure the optimised Boratabenzene structure is a minimum.
Published in D-space: DOI:10042/22622
The first line of low frequencies corresponds to the motions of the center of mass of the molecule and are within an acceptable +/- 15 cm-1. They are an order of magnitude smaller than the "real" frequencies found on the second line.
Low frequencies ---   -7.2845   -0.0002    0.0004    0.0011    0.7640    5.4591
 Low frequencies ---  371.2970  404.4143  565.1056
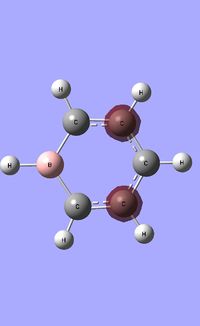
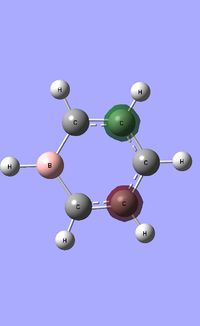
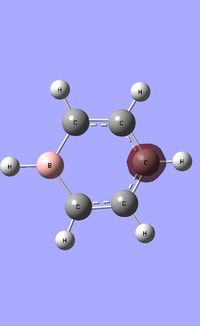
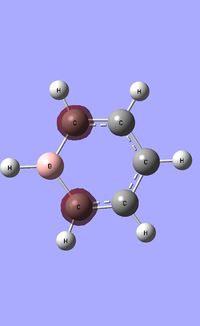
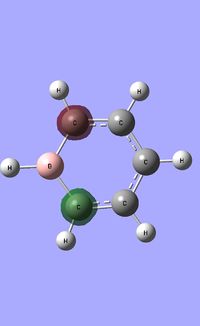
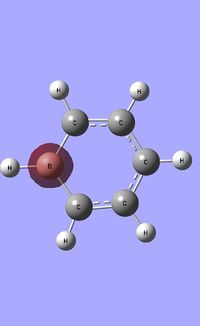
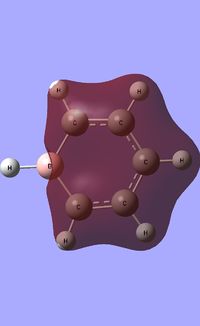
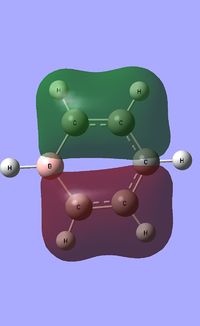
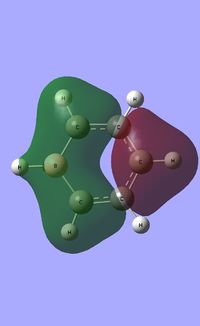
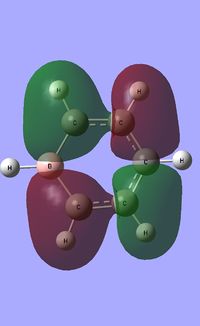
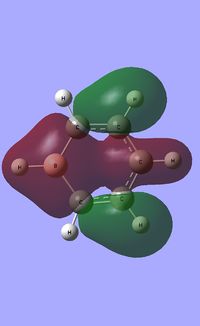
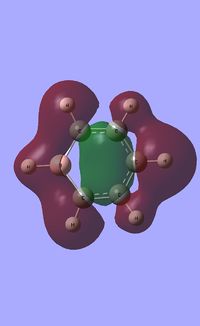
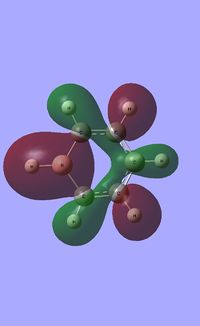
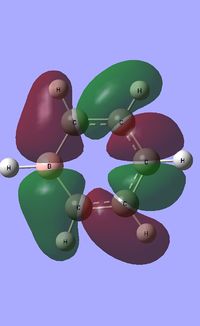
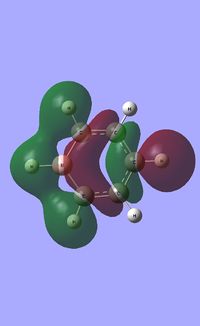
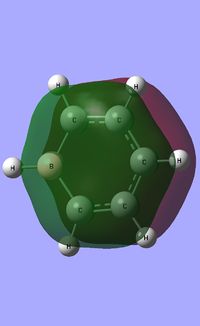
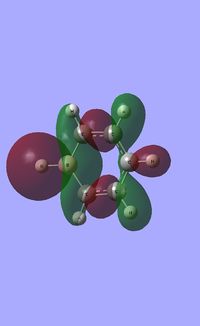
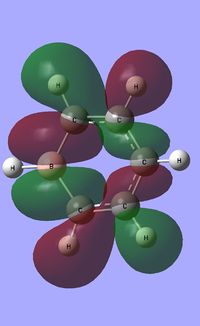
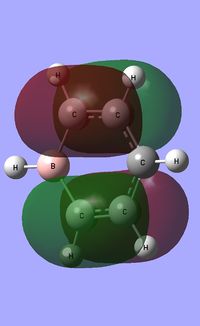
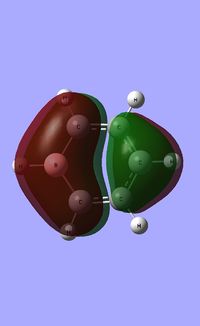
Molecular orbital analysis of Boratabenzene
Having considered the optimisation and frequency output obtained from previous calculations, the electronic structure of Boratabenzene was subsequently analysed. Through the use of an "Energy" methodology the quantitative molecular orbitals of Boratabenzene were realized.
Published in D-space: DOI:10042/22627
| Occupied molecular orbitals of Boratabenzene | ||||
|---|---|---|---|---|
 |
 |
 |
 |
|
 |
 |
 |
 |
|
 |
 |
 |
 |
|
 |
 |
 |
 |
|
| ||||
Natural Bond Orbital Analysis of Boratabenzene
Natural bond orbital analysis [NBO] was then undertaken on the log.file computed for the optimised boratabenzene molecule.
The charge range for the NBO charge distribution was -1.0 to +1.0.
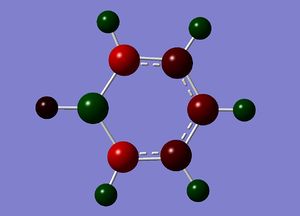
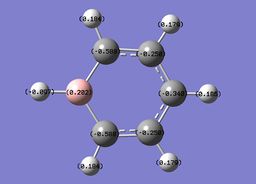
The specific NBO charges for boron, carbon and hydrogen were then analsyed. Boron has a positive charge, with carbon possessing a charge of -0.588 due to the relative electropositivity of boron. The associated hydrogens hold a charge in the range -0.179 and +0.186.This is shown in the image below.
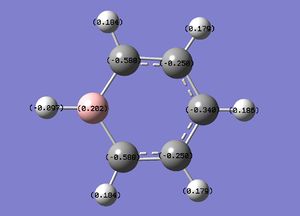
The table below outlines the charge distribution observed within Boratabenzene.
Summary of Natural Population Analysis:

                                       Natural Population
                Natural  -----------------------------------------------
    Atom  No    Charge         Core      Valence    Rydberg      Total
 -----------------------------------------------------------------------
      C    1   -0.58807      1.99901     4.57728    0.01178     6.58807
      C    2   -0.25031      1.99910     4.23708    0.01413     6.25031
      C    3   -0.34002      1.99907     4.32711    0.01384     6.34002
      C    4   -0.25031      1.99910     4.23708    0.01413     6.25031
      C    5   -0.58807      1.99901     4.57728    0.01178     6.58807
      H    6    0.18387      0.00000     0.81394    0.00218     0.81613
      H    7    0.17898      0.00000     0.81839    0.00263     0.82102
      H    8    0.18573      0.00000     0.81228    0.00199     0.81427
      H    9    0.17898      0.00000     0.81839    0.00263     0.82102
      H   10    0.18387      0.00000     0.81394    0.00218     0.81613
      H   11   -0.09651      0.00000     1.09598    0.00054     1.09651
      B   12    0.20185      1.99906     2.78748    0.01160     4.79815
 =======================================================================
   * Total *   -1.00000     11.99436    29.91623    0.08941    42.00000
As shown in the table above, all carbon atoms are sp2 hybridised [37.60%s 62.37%p] with the exception of C-B which is 42.00%s 57.99%p. This increase in s character may be due to the negative charge on the boron atom, donating electron density to the adjacent carbon atoms, which is subsequently held in the small,less diffuse s orbitals close to the carbon nucleus. The boron atoms are all sp2 hybridised. The sp2 hybridised carbon atoms have a similar bonding coefficient [C: 49.23%-C:50.77%] to that observed within benzene [C: 50.0%-C:50.0%]
Pyridinium
Optimisation of Pyridinium
A Pyridinium molecule was created using GaussView by replacing a C-H unit within benzene with N-H. The molecule was subjected to an optimisation calculation [OPT] using B3LYP as the method and a basis set of 6-31G(d,p).
Published in D-space: DOI:10042/22645
The table below shows that the 6-31G (d,p) optimisation was successful with both the force and displacements converging:
Item               Value     Threshold  Converged?
 Maximum Force            0.000086     0.000450     YES
 RMS     Force            0.000028     0.000300     YES
 Maximum Displacement     0.000678     0.001800     YES
 RMS     Displacement     0.000207     0.001200     YES
 Predicted change in Energy=-1.044727D-07
 Optimization completed.
    -- Stationary point found.
Frequency analysis of Pyridinium
Using the optimised 6-31G (d,p) Pyridinium molecule a "Frequency" job type was enforced to acquire a set of low frequencies and ensure the optimised Pyridinium structure is a minimum.
Published in D-space: DOI:10042/22646
The first line of low frequencies corresponds to the motions of the center of mass of the molecule and are within an acceptable +/- 15 cm-1. They are an order of magnitude smaller than the "real" frequencies found on the second line.
Low frequencies ---   -9.5421   -4.9909   -0.0011    0.0001    0.0007    3.3584
 Low frequencies ---  391.9528  404.3089  620.2421
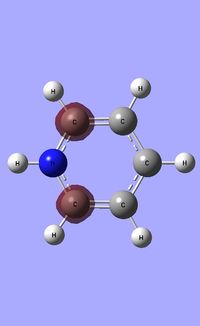
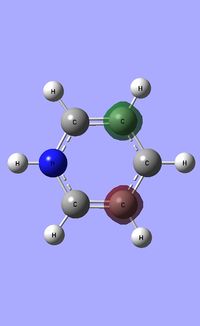
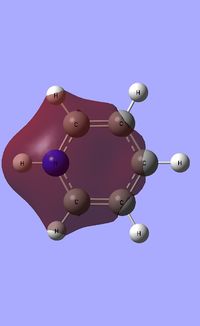
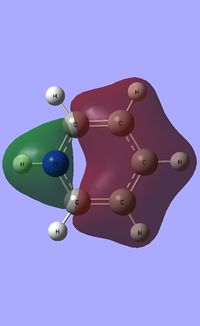
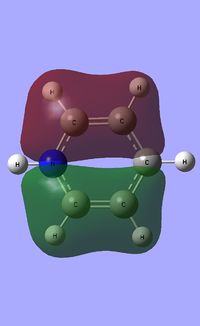
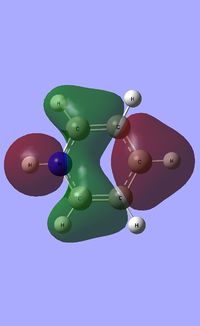
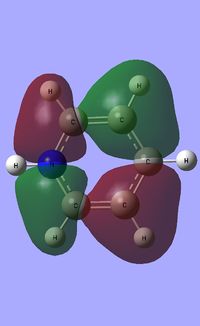
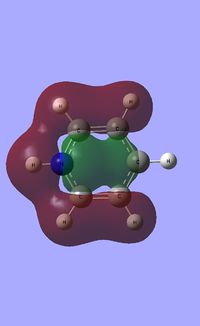
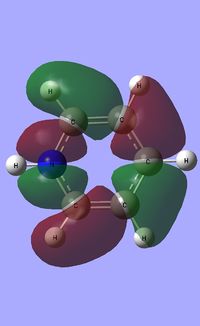
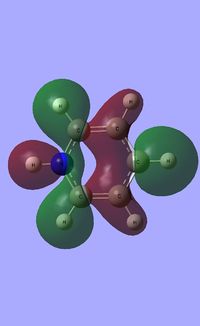
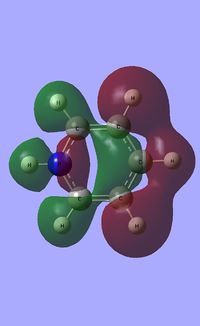
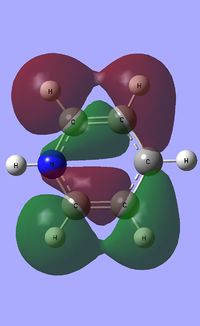
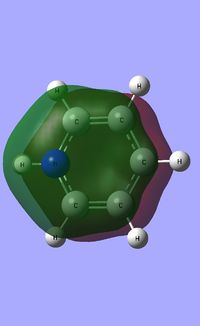
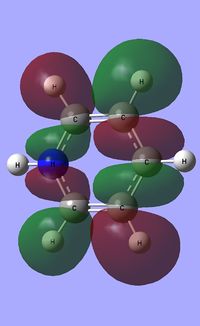
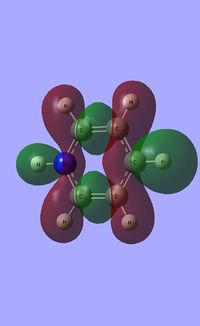
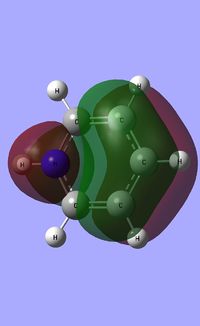
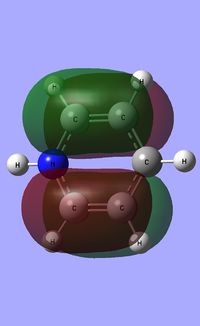
Molecular orbital analsyis of Pyridinium
Having considered the optimisation and frequency output obtained from previous calculations, the electronic structure of Pyridinium was subsequently analysed. Through the use of an "Energy" methodology the quantitative molecular orbitals of Pyridinium were realized.
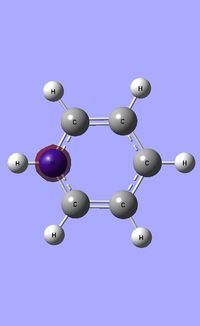
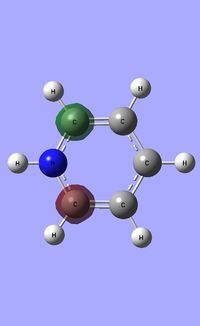
Published in D-space: DOI:10042/22649
| Occupied molecular orbitals of Pyridinium | ||||
|---|---|---|---|---|
 |
 |
 |
 |
|
 |
 |
 |
 |
|
 |
 |
 |
 |
|
 |
 |
 |
 |
|
| ||||
Natural Bond Orbital analysis of Pyridinium
Natural bond orbital analysis [NBO] was then undertaken on the log.file computed for the optimised Pyridinium molecule.
The charge range for the NBO charge distribution was -1.0 to +1.0.
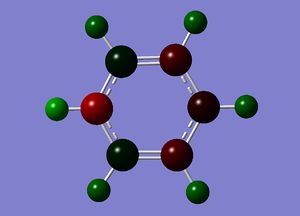
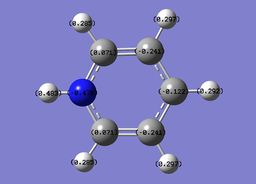
The specific NBO charges for nitrogen, carbon and hydrogen were then analsyed. Nitrogen has a negative charge of -0.476 [due to its high electronegativity], the carbons hold a charge in the range of +0.071 and -0.241. The associated hydrogens possess a charge in the range +0.483 to +0.285. This is shown in the image below.
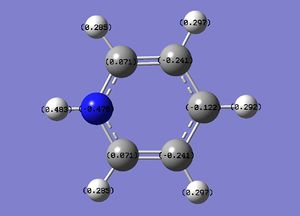
The table below outlines the charge distribution observed within Pyridinium.
Summary of Natural Population Analysis:

                                       Natural Population
                Natural  -----------------------------------------------
    Atom  No    Charge         Core      Valence    Rydberg      Total
 -----------------------------------------------------------------------
      C    1    0.07097      1.99918     3.91070    0.01916     5.92903
      C    2   -0.24111      1.99912     4.22867    0.01331     6.24111
      C    3   -0.12229      1.99913     4.10930    0.01386     6.12229
      C    4   -0.24111      1.99912     4.22867    0.01331     6.24111
      C    5    0.07096      1.99918     3.91070    0.01916     5.92904
      H    6    0.28494      0.00000     0.71396    0.00110     0.71506
      H    7    0.29719      0.00000     0.70178    0.00103     0.70281
      H    8    0.29171      0.00000     0.70716    0.00113     0.70829
      H    9    0.29719      0.00000     0.70178    0.00103     0.70281
      H   10    0.28494      0.00000     0.71396    0.00110     0.71506
      H   11    0.48278      0.00000     0.51476    0.00246     0.51722
      N   12   -0.47617      1.99937     5.46751    0.00929     7.47617
 =======================================================================
   * Total *    1.00000     11.99510    29.90894    0.09595    42.00000
As shown in the table above, the carbon and nitrogen atoms present within pyridinium are sp2 hybridised. As expected the nitrogen atom has a greater bonding coefficient in both C-N and N-H bonds, due to the electronegative nature of nitrogen and the electron withdrawing effect it exerts.
Borazine
Optimisation of Borazine
A Borazine molecule was created using GaussView and was subjected to an optimisation calculation [OPT] using B3LYP as the method and a basis set of 6-31G(d,p).
Published in D-space: DOI:10042/22665
The table below shows that the 6-31G (d,p) optimisation was successful with both the force and displacements converging:
Item               Value     Threshold  Converged?
 Maximum Force            0.000158     0.000450     YES
 RMS     Force            0.000052     0.000300     YES
 Maximum Displacement     0.000793     0.001800     YES
 RMS     Displacement     0.000242     0.001200     YES
 Predicted change in Energy=-4.309736D-07
 Optimization completed.
    -- Stationary point found.
Frequency analysis of Borazine
Using the optimised 6-31G (d,p) Borazine molecule a "Frequency" job type was enforced to acquire a set of low frequencies and ensure the optimised Borazine structure is a minimum.
Published in D-space: DOI:10042/22671
The first line of low frequencies corresponds to the motions of the center of mass of the molecule and are within an acceptable +/- 15 cm-1. They are an order of magnitude smaller than the "real" frequencies found on the second line.
Low frequencies ---   -8.9517   -6.2845   -0.0009   -0.0004    0.0008    3.3015
 Low frequencies ---  289.5839  289.6592  404.7068
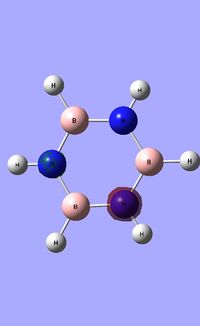
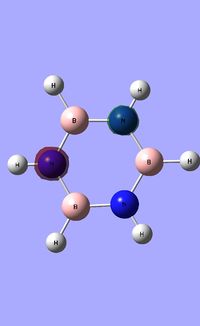
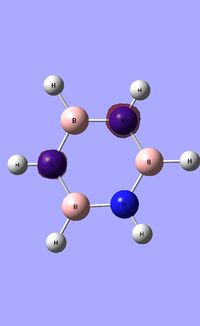
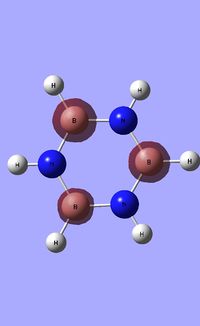
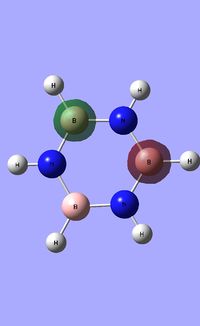
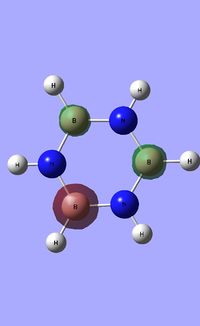
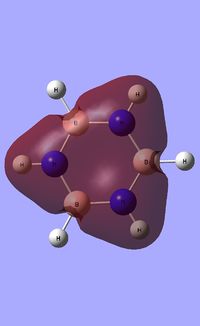
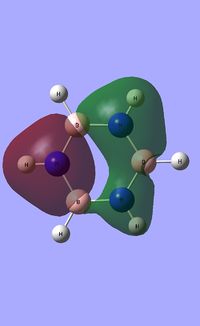
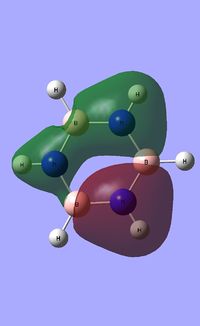
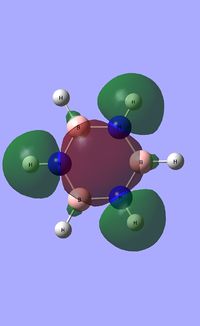
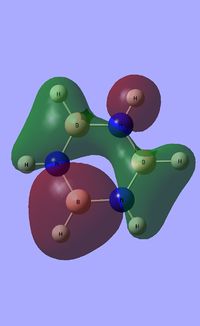
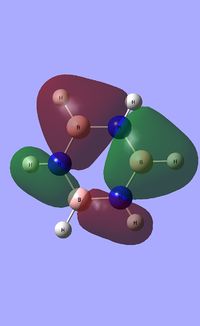
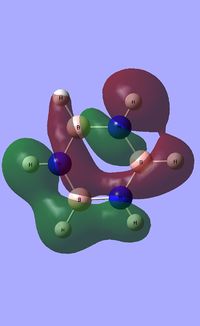
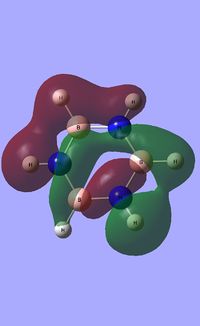
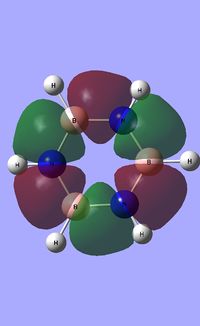
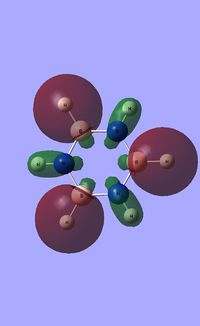
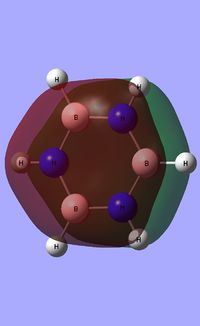
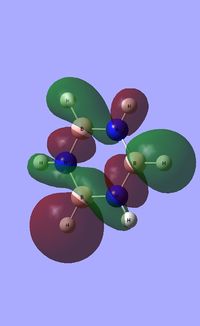
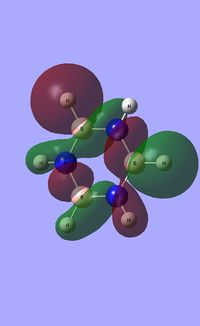
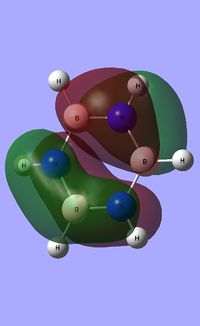
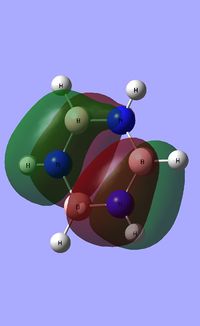
Molecular orbital analysis of Borazine
Having considered the optimisation and frequency output obtained from previous calculations, the electronic structure of Borazine was subsequently analysed. Through the use of an "Energy" methodology the quantitative molecular orbitals of Borazine were realized.
Published in D-space: DOI:10042/22673
| Occupied molecular orbitals of Borazine | ||||
|---|---|---|---|---|
 |
 |
 |
 |
|
 |
 |
 |
 |
|
 |
 |
 |
 |
|
 |
 |
 |
 |
|
| ||||
Natural Bond Orbital analysis of Borazine
Natural bond orbital analysis [NBO] was then undertaken on the log.file computed for the optimised Borazine molecule.
The charge range for the NBO charge distribution was -1.0 to +1.0.
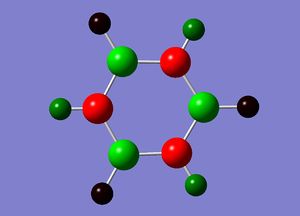
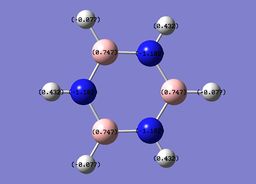
The specific NBO charges for nitrogen,boron and hydrogen were then analsyed. Nitrogen [electronegative] has a charge of -1.102 with the assocaited hydrogen holding a charge of +0.432. Conversely, each boron [electropositive] holds a charge of +0.747 with the attached hydrogen possessing a charge of -0.077.This is shown in the image below.
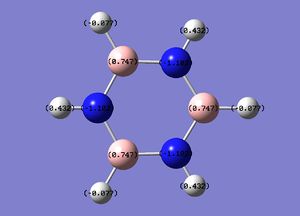
The table below outlines the charge distribution observed within Borazine.
Summary of Natural Population Analysis:

                                       Natural Population
                Natural  -----------------------------------------------
    Atom  No    Charge         Core      Valence    Rydberg      Total
 -----------------------------------------------------------------------
      H    1   -0.07651      0.00000     1.07582    0.00069     1.07651
      H    2    0.43192      0.00000     0.56579    0.00229     0.56808
      H    3   -0.07652      0.00000     1.07583    0.00069     1.07652
      H    4    0.43192      0.00000     0.56579    0.00229     0.56808
      H    5   -0.07652      0.00000     1.07582    0.00069     1.07652
      H    6    0.43192      0.00000     0.56579    0.00229     0.56808
      N    7   -1.10236      1.99943     6.09815    0.00478     8.10236
      N    8   -1.10235      1.99943     6.09814    0.00478     8.10235
      N    9   -1.10236      1.99943     6.09815    0.00478     8.10236
      B   10    0.74697      1.99917     2.23866    0.01520     4.25303
      B   11    0.74692      1.99917     2.23870    0.01520     4.25308
      B   12    0.74695      1.99917     2.23867    0.01520     4.25305
 =======================================================================
   * Total *    0.00000     11.99579    29.93532    0.06889    42.00000
As shown in the table above, boron is sp2 hybridised. Nitrogen has a greater bonding coefficient in both the N-B and N-H bonds, due to the electronegative nature of nitrogen. Conversely, hydrogen provides a greater contribution to the B-H bond as a consequence of boron's electropositivity.
Comparative charge distribution study of Benzene, Boratabenzine, Pyridinium and Borazine
| Charge distribution analysis | |||
|---|---|---|---|
| Benzene | Boratabenzene | Pyridinium | Borazine |
 |
 |
 |
|
 |
 |
 |
|
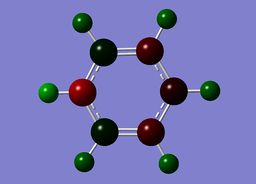
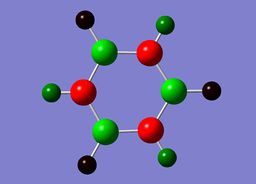
Benzene contains a conjugated C-C system, with pi electron density observed above and below the ring structure. Each C-C within the conjugated system has sp2 hybridisation. Given, the D6H point group of benzene, there is a symmetric distribution of charge observed throughout the molecule. Each carbon atom has a charge of -0.239, with each hydrogen attached within the molecule exhibiting an equal and opposite +0.239 charge. This is consistent with the increased electronegativity of carbon relative to hydrogen.
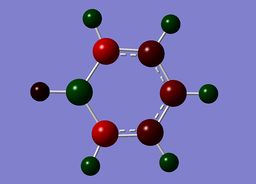
Boratazine contains a 6-membered ring as observed in benzene, with one C-H unit displaced by a B-H unit. The two molecules are isoelectronic, yet unlike the neutral benzene molecule, boratazine contains a formal negative charge. Despite being isoelectronic the NBO analysis yields significant disparities between the two molecules. The single boron atom possess a chargge of +0.202, with its associated hydrogen carrying a charge of -0.097. This reflects the electropositivity of boron compared to the hydridic bonded hydrogen. The presence of the sp2 boron atom within boratabenzene causes a significant disruption to the pi electron density observed within benzene. Whereas, in the case of benzene a symmetric charge distribution was observed, within boratabenzene the electron denisty is polarised towards the carbons ortho to the boron atom. Thus, both ortho carbons hold a higher proportion of charge [-0.588] relative to the charge observed on the meta [-0.250] and para [-0.340] carbons. Each "C-H" hydrogen carries a positive charge owing to its electropositivity relative to carbon.
Pyridinium contains a conjugated pi system as observed in benzene, however, as in the case of boratabenzene one carbon atom has been replaced. Within pyridinium one nitrogen atom is present within the ring, it is isoelectronic with benzene due to a formal positive charge on this nitrogen. The heteroatom nitrogen has a charge of -0.476 with its associated hydrogen carrying a charge of +0.438. This is in accordance with the polarity of the N-H unit, owing to the increased electronegativity of nitrogen and the protic nature of the hydrogen. As in the case of boratabenzene, the prescene of a heteroatom causes a pertubation of the electron density. Due to the significant electronegativity of nitrogen and the strong I- inductive efect, the ortho carbons directly adjacent carry a relatively positive charge [+0.071]. As in boratabenzene, the effect diminishes for the meta and para carbons, which exhibit a more negative charge [-0.241 and -0.122]. Once again, each "C-H" hydrogen carries a positive charge owing to its electropositivity relative to carbon.
Borazine has a six-membered ring comprised of alternating N-H and B-H units. It exhibits a symmetric distribution of charge, unlike both boratabenzene and pyrdinium. Given the more electronegative nature of nitrogen compared to boron, each nitrogen atom holds a greater amount of charge [-1.102] compared to each boron atom [+0.747]. Each N-H unit hydrogen displays a charge of +0.432 due to its lower electronegativity compared to the bonding nitrogen. Conversely, each B-H unit hydrogen displays a charge of -0.077 as a result of its higher electronegativity compared to that of boron. |}
Comparison of molecular orbitals
Three molecular orbitals [specifically the HOMO, HOMO-1 and fully pi bonded orbitals] for each benzene analogue were analysed with respect to those computed for benzene.
| Molecular orbitals | ||||
|---|---|---|---|---|
| Molecule | Benzene | Boratabenzene | Pyridinium | Borazine |
| HOMO | 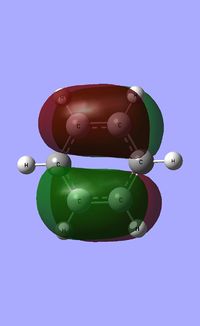 |
 |
 |

|
| LCAOs |  |
 |
 |

|
| Energy (a.u) | -0.24690 | +0.010904 | -0.47886 | -0.27589 |
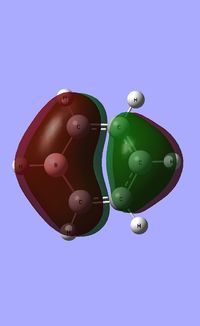
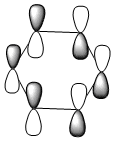
The HOMO [Highest Occupied Molecular Orbital] of benzene contains a nodal plane perpendicular to the six-carbon ring system. A symmetric distribution of charge is observed either side of the nodal plane. In the case of boratabenzene the overall negative charge associated with the single boron atom causes a asymmetric perturbation of the electron cloud. Thus, a greater proportion of the electron density encapsulates the boron atom and adjacent carbons [nodal plane separates this region]. Pyridinium exhibits a nodal plane perpendicular to the ring the ring through the para nitrogen and carbon atoms, with no electron density observed on the nitrogen atom. The absence of this electron density is consistent with the formal positive charge on the nitrogen within pyridinium. Borazine also contains a nodal plane,perpendicular to the boron-nitrogen ring system. Given the disparity in the electronegativities between boron and nitrogen, there is a slight distortion in the electron density towards the nitrogen atom that lies along the nodal plane.
| Molecular orbital analysis | ||||
|---|---|---|---|---|
| Molecule | Benzene | Boratabenzene | Pyridinium | Borazine |
| HOMO-1 | 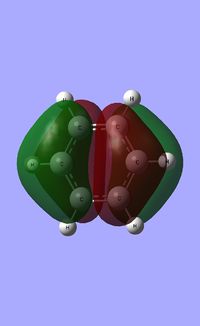 |
 |
 |

|
| LCAO | 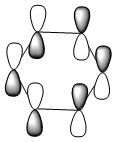 |
 |
 |
|
| Energy (a.u) | -0.24692 | -0.03483 | -0.50847 | -0.27589 |
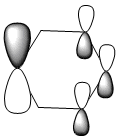
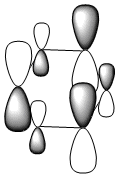
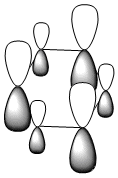
Due to the symmetry asssociated with benzene and borazine, both molecules contain a doubly degenerate HOMO. This degeneracy is lost in the case of boratabenzene and pyridiunium as a consequence of the heteroatoms present. Nitrogen [electronegative] causes a lowering in the energy of the molecular orbital, whilst boron [electropositive] causes a raising in energy. The benzene HOMO,shown in the table above, contains a nodal plane that is perpendicular to its degenerate molecular orbital. In contrast to the polarised electron density towards boron observed within the HOMO of boratabenzene; the HOMO-1 has a distinct absence of electron density on the boron atom [as shown by the LCAOs above], with a nodal plane passing through the para boron and carbon atoms. In accordance with the electropositivity of boron, this lack of electron density surrounding the boron has a stabilising effect, hence this molecular orbital is lower in energy than the boratabenzene HOMO. Significant deviations in electron density distribution are also observed within the HOMO and HOMO-1 of pyridinium. Unlike the HOMO of pyridinium, where the nitrogen is relatively bare with regard to electron density; the HOMO-1 shows a significant localisation of electron density on the electronegative nitrogen atom,which is isolated by a nodal plane passing across the ortho carbons. As a consequence of nitrogen's electronegativity, this build up of electron density has a stabilising effect, hence the lower energy of the HOMO-1 of pyridinium. The LCAO above depicts the distribution of charge within the HOMO-1, the larger nitrogen 2p orbital exerts an electron-withdrawing effect, reducing the electron density on the adjacent carbons. The borazine HOMO [shown in the table above], features a nodal plane across the ring structure and an asymmetric electron density distribution with more electron density observed on the N-B-N unit due to the electronegativity of the nitrogen atoms. It should be noted that the reduced aromaticity of borazine compared to that of benzene is a consequence of the alternating boron and nitrogen atoms present. The electropositive boron atomic orbitals contribute more to the anti-bonding molecular orbitals whereas the electronegative nitrogen atoms contribute more to the bonding molecular orbitals. This disparity in orbital coefficients causes an uneven distribution in pi electron density and hence the lower aromaticity observed.
| Charge distribution analysis | ||||
|---|---|---|---|---|
| Molecule | Benzene | Boratabenzene | Pyridinium | Borazine |
| Fully pi bonding | 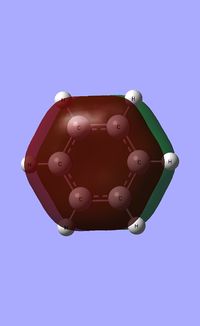 |
 |
 |

|
| LCAO | 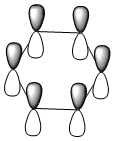 |
 |
 |
|
| Energy (a.u) | -0.35996 | -0.13211 | -0.64064 | -0.36131 |
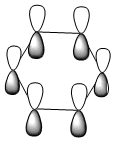
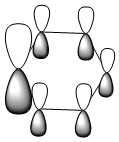
All four isonodal [one node present in the plane of the ring] molecular orbitals, shown above, are fully pi bonded in nature with delocalised electron density spread across the ring. Benzene exhibits a even and symmetric spread of electron density across the entirity of the molecule. Due to the negative charge present on boron within boratabenzene the 2pz orbital on boron is filled and thus can contribute to [i.e delocalise] the electron rich pi ring system. The electropositivity of boron causes a slight reduction in the electron density surrounding the boron atom. Conversely, the high electronegativity of nitrogen within pyridinium causes a polarisation of the electron density towards the single nitrogen atom within the ring. Deviations in electron density are limited within borazine due to the alternating nitrogen-boron ring system; hence any difference in electronegativities are diminished across the whole system. This results in a reasonably even electron distribution across the borazine molecule.
The energy of the molecular orbitals is dependent on the atomic orbitals present within the ring system. The molecular orbitals increase in the order pyridinium,borazine,benzene,boratabenzene. The lower energy of pyridinium is consistent with the presence of an electronegative atom within the system. The larger the electronegativity of the atomic orbital the lower the observed energy, therefore the lowest molecular orbital energy observed is pyridinium. Conversely, the presence of an electropositive atom, boron, in boratabenzene substantiates its position as the highest pi molecular orbital. Despite the presence of electronegative nitrogen atoms in borazine the alternating boron atoms serve to diminish this effect, thus borazine is a higher energy than pyridinium. Benzene is one place above boratabenzene within this intermediate level.
References
- ↑ M. Schurman, W. Allen, H. Schaefer, Journal of Computational Chemistry, 2005, 26, pg 1106
- ↑ J. Blixt et al., J. Am. Chem. Soc. , 117, 1995, pg 5089 - 5104
- ↑ W.M Haynes,CRC handbook of Chemistry and Physics,2011,92nd Ed., pg 920
- ↑ W.M Haynes,CRC handbook of Chemistry and Physics,2012, 93rd Ed., pg 26
- ↑ Yu. Kh. Shaulov; G. O. Shmyreva; V. S. Tubyanskaya, Zhurnal Fizicheskoi Khimii, 1966, 40,122-124

