Nw3817
EX3 Section
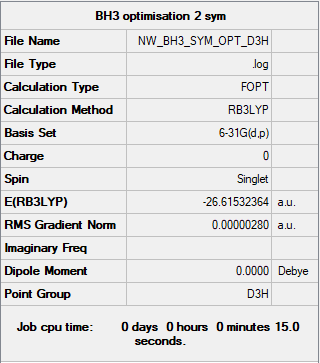
BH3
B3LYP/6-31G(d,p) level
         Item               Value     Threshold  Converged?
 Maximum Force            0.000006     0.000450     YES
 RMS     Force            0.000004     0.000300     YES
 Maximum Displacement     0.000022     0.001800     YES
 RMS     Displacement     0.000015     0.001200     YES
Frequency analysis log file: NW3817_BH3_FREQ.LOG
Low frequencies ---   -2.2126   -1.0751   -0.0055    2.2359   10.2633   10.3194
Low frequencies --- 1162.9860 1213.1757 1213.1784
BH3 |
Vibrational spectrum of BH3
| wavenumber (cm-1) | Intensity (arbitrary units) | symmetry | IR active? | type |
| 1163 | 93 | A2 | yes | out-of-plane bend |
| 1213 | 14 | E' | very slight | bend |
| 1213 | 14 | E' | very slight | bend |
| 2582 | 0 | A1' | no | symmetric stretch |
| 2715 | 126 | E' | yes | asymmetric stretch |
| 2715 | 126 | E' | yes | asymmetric stretch |
While there are six vibrational modes, only three peaks are seen on the spectrum. This is because there are E' vibrations that are of degenerate energy (thus the vibrations have the same frequency), meaning only one peak is seen at 1213(cm-1) and 2715(cm-1), when each peak corresponds to two vibrations. The vibration at 2582(cm-1) is a symmetric stretch with no overall change in dipole moment, thus the vibration is not IR active. The result is that there are only three peaks in the spectrum.
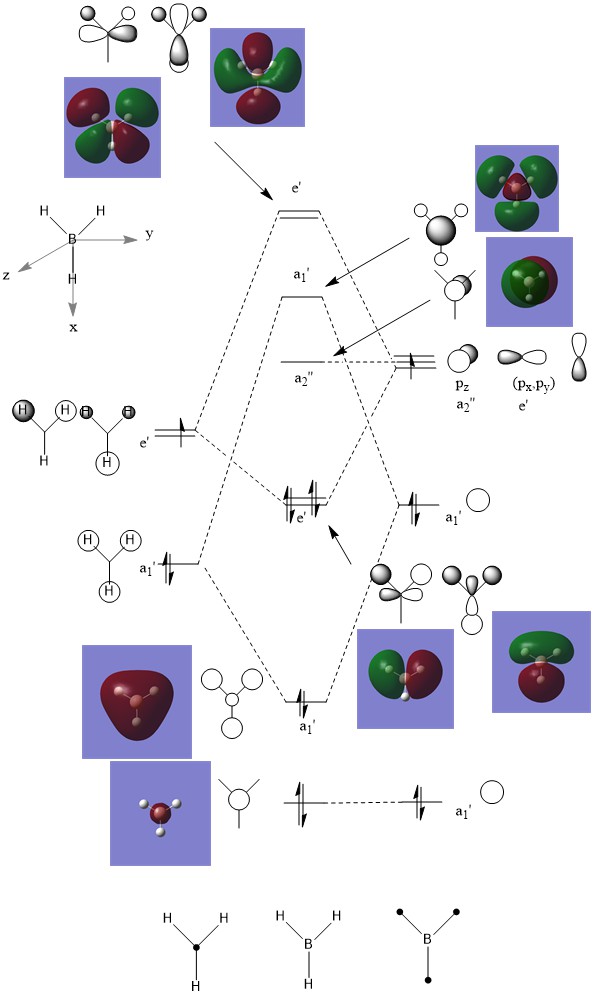
When comparing calculated MOs with their corresponding LCAOs, one can see that regions in the same phase fuse together and regions that are not in the same phase distort away from one another. There are clear similarities between the qualitative LCAOs and the corresponding real MOs, but the more complex the atomic orbital, the further the LCAO is from the real MO. For example, the boron 1s a1' is exactly as the LCAO predicts, but the anti bonding e' orbitals are distorted from the LCAO, with lobes of different phases distorting away from each other. This illustrates how qualitative MO theory is very useful for predicting the MOs of simple systems, and even in more complex systems can be used to sort out which atomic orbitals contribute to real MOs, but to get a truly accurate idea of real MOs in more complex systems than this (anti bonding orbitals especially), we must calculate them.
Clear inclusion of the calculated MOs on to the MO diagram with the corresponding LCAOs. You have highlighted the similarities and differences well using the example orbitals which is really good. However, note that the lack of 'fusing together' in the LCAOs is more a convention of how they are drawn, and some parts of your explanation aren't too clear in terms of the wording. Overall, nice discussion though! Smf115 (talk) 21:53, 1 June 2019 (BST)
NH3
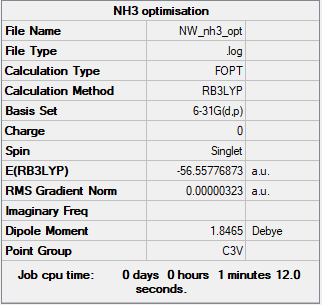
B3LYP/6-31G(d,p) level
         Item               Value     Threshold  Converged?
 Maximum Force            0.000006     0.000450     YES
 RMS     Force            0.000004     0.000300     YES
 Maximum Displacement     0.000012     0.001800     YES
 RMS     Displacement     0.000008     0.001200     YES
Frequency analysis log file: NW_NH3_FREQ.LOG
 Low frequencies ---   -0.0136   -0.0021    0.0018    7.0783    8.0932    8.0937
 Low frequencies --- 1089.3840 1693.9368 1693.9368
NH3 |
NH3BH3
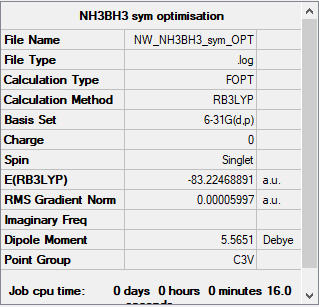
B3LYP/6-31G(d,p) level
         Item               Value     Threshold  Converged?
 Maximum Force            0.000122     0.000450     YES
 RMS     Force            0.000058     0.000300     YES
 Maximum Displacement     0.000531     0.001800     YES
 RMS     Displacement     0.000296     0.001200     YES
Frequency analysis log file: NW_NH3BH3_SYM_OPT_FREQ.LOG
 Low frequencies ---   -0.0251   -0.0031    0.0007   17.1236   17.1259   37.1326
 Low frequencies ---  265.7816  632.2034  639.3483
NH3BH3 |
Association Energy
E(NH3)=-56.558 a.u.
E(BH3)=-26.615 a.u.
E(NH3BH3)=-83.225 a.u.
ΔE=E(NH3BH3)-[E(NH3)+E(BH3)]=-0.052 a.u. = -136 kJ/mol
Ethane has a similar structure to NH3BH3, the same number of atoms, and is isoelectronic to it. The carbon-carbon single bond in ethane is about -377 kJ/mol[1]. This C-C bond is a strong bond and much deeper in energy than the N-B bond here. Another bond strength to compare is the o-o peroxide bond of strength -142 kJ/mol [2]. The peroxide bond is a weak bond and the N-B bond is calculated to be even weaker than this, so the N-b dative bond is a weak bond.
Correct calculation, however, note that your a.u. energies can be left to 5 d.p. in terms of accuracy. Good, referenced comparisons used to evaluate the bond strengths although positive values referring to bond dissociation energies are usually used and should be for the discussion. Smf115 (talk) 21:58, 1 June 2019 (BST)
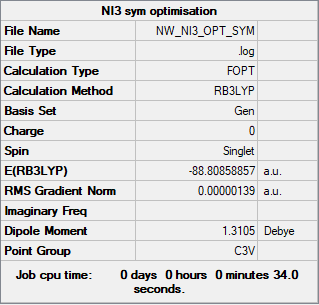
NI3
B3LYP/6-31G(d,p)LANL2DZ level
frequency file: NW_NI3_FREQ.LOG
         Item               Value     Threshold  Converged?
 Maximum Force            0.000002     0.000450     YES
 RMS     Force            0.000002     0.000300     YES
 Maximum Displacement     0.000022     0.001800     YES
 RMS     Displacement     0.000014     0.001200     YES
Low frequencies ---  -12.5522  -12.5460   -6.0047   -0.0040    0.0191    0.0664
Low frequencies ---  100.9969  100.9977  147.3377
NI3 |
Optimised N-I distance: 2.184 Å
Good implementation of the pseudopotential and structure information throughout, although, the summary tables should relate to the frequency calculations (not optimisations) to confirm that they are minima. Very good first section though! Smf115 (talk) 22:00, 1 June 2019 (BST)
Project Section: Metal Carbonyls
Predictions
Given knowledge of metal-ligand back bonding from this year's Transition Metals and Organometallics lecture course, and given that these compounds are isoelectronic d6, back bonding should decrease as the metal center used goes from Ti to Fe across the period. The metal oxidation state increases (becomes more positive) from Ti2- to Fe2+ so the metal can less readily donate electrons into the C-O π* anti bonding orbital.
Since back bonding donates electrons into the C-O π* anti bonding orbital, increased back bonding decreases C-O bond strength, and thus C-O bond stretch frequency. C-O bond frequency should then increase with decreasing back bonding, therefore increasing across the period.
Another consequence of back bonding is increasing electron density around the carbonyl carbon, so as back bonding decreases from Ti2- to Fe2+, the trend should show increasingly positive charge density on the C atom.
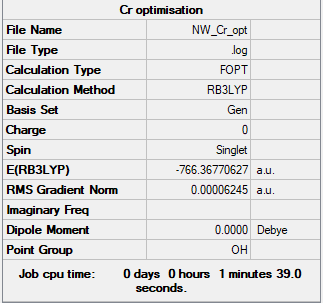
[Cr(CO)6]
B3LYP/6-31G(d,p)LANL2DZ level
         Item               Value     Threshold  Converged?
 Maximum Force            0.000110     0.000450     YES
 RMS     Force            0.000041     0.000300     YES
 Maximum Displacement     0.000709     0.001800     YES
 RMS     Displacement     0.000336     0.001200     YES
Frequency analysed log file: NW_CR_FREQ.LOG
 Low frequencies ---   -0.0008    0.0008    0.0009   11.7424   11.7424   11.7424
 Low frequencies ---   66.6546   66.6547   66.6547
[Cr(CO)6] |
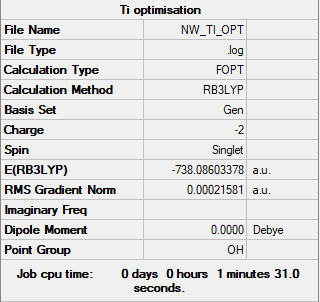
[Ti(CO)6]2-
B3LYP/6-31G(d,p)LANL2DZ level
         Item               Value     Threshold  Converged?
 Maximum Force            0.000334     0.000450     YES
 RMS     Force            0.000121     0.000300     YES
 Maximum Displacement     0.000726     0.001800     YES
 RMS     Displacement     0.000282     0.001200     YES
Frequency analysed log file: NW_TI_FREQ.LOG
 Low frequencies ---    0.0012    0.0015    0.0015   13.3364   13.3364   13.3364
 Low frequencies ---   29.8194   29.8194   29.8194
[Ti(CO)6]2- |
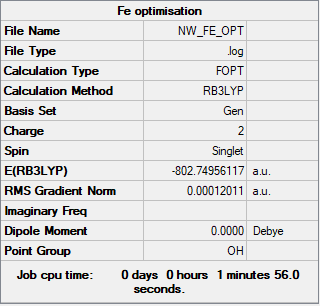
[Fe(CO)6]2+
B3LYP/6-31G(d,p)LANL2DZ level
         Item               Value     Threshold  Converged?
 Maximum Force            0.000222     0.000450     YES
 RMS     Force            0.000077     0.000300     YES
 Maximum Displacement     0.000254     0.001800     YES
 RMS     Displacement     0.000094     0.001200     YES
Frequency analysed log file: NW_FE_FREQ.LOG
 Low frequencies ---   -9.5131   -9.5131   -9.5131    0.0006    0.0010    0.0010
 Low frequencies ---   82.3908   82.3908   82.3908
[Fe(CO)6]2+ |
Analysis
Values for V(CO)6- and Mn(CO)6+ calculated by Benedek Stadler in colaboration, his wiki can be found here:https://wiki.ch.ic.ac.uk/wiki/index.php?title=Bs517-Y2Inorganic
| Complex | C-O bond length (Å) | C-O asymmetric bond stretch frequency (cm-1) | C-O symmetric bond stretch frequency (cm-1) | Charge on Carbon atom (e) |
| Ti(CO)62- | 1.183 | 1857 | 1992 | 0.261 |
| V(CO)6- | 1.166 | 1970 | 2097 | 0.326 |
| Cr(CO)6 | 1.149 | 2086 | 2189 | 0.367 |
| Mn(CO)6+ | 1.136 | 2199 | 2265 | 0.408 |
| Fe(CO)62+ | 1.125 | 2297 | 2322 | 0.463 |
The trend in C-O bond length largely goes as expected, decreasing from Ti to Fe as the metal center is more and more oxidised, and thus engages in less and less back bonding to the C-O π* anti bonding orbital. The result is that the C-O bond is less destabilised and thus shorter. Since bond stretch frequency is proportional with bond strength, the trend in asymmetric C-O bond stretch frequency is that it increases from Ti2- to Fe2+.
Another Trend investigated was the charge density on the carbonyl carbon in each complex. As expected, the charge on C becomes more positive from Ti(CO)62- to Fe(CO)62+, since back bonding increases electron density on the C atom, the carbon attached to the more electron donating Ti2- has a less positive charge on it than the one connected to the poorly donating Fe2+.
Very good predictions and analysis and really nice to see it across the full five compounds, great collaboration! Your explanations are clear and the data calculated is correct, however, you should have used the NBO charges for the charge analysis. To improve, you could have considered plotting some of the data and explaining why the back-bonding decreases with the increasing metal charge would be good. Smf115 (talk) 14:10, 31 May 2019 (BST)
Inspecting the completely symmetric C-O bond stretch frequency, one can see that it as with the asymmetric stretch frequency, it increases across the period (increasing with C-O bond strength). These Frequencies cannot however be tested experimentally with IR as their being completely symmetrical means that they cause no change in dipole moment and are thus not IR active, and will not show up in an IR spectrum of the complex.
Correct in that it cannot be determined experimentally, but what about computationally? Smf115 (talk) 14:10, 31 May 2019 (BST)
Calculated MOs of Cr(CO)6:
MO number 43: eg
- Occupied MO
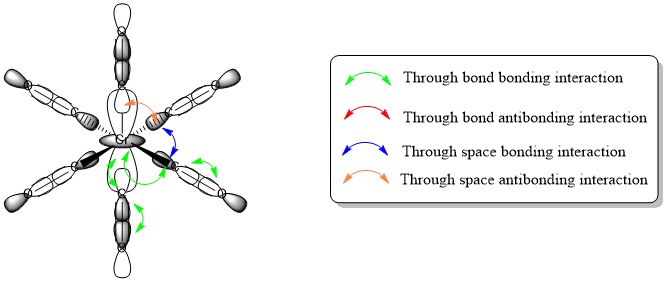
There is through bond bonding interaction through each bond in this MO, and through space bonding interactions between the orbitals of the equatorial C-O σ orbitals. There is also through space anti bonding interactions between the axial C-O σ orbitals and the neighbouring equatorial C-O σ orbitals. The combination of anti bonding and bonding through space interactions will be slightly anti bonding overall, since each interaction is through the same amount of space, and each of the two axial C-O groups will have anti bonding interactions with it's four neighbours (8 total through space anti bonding), whereas the through space bonding character will exist between the four equatorial C-O groups (4 through space bonding). However, since there strong is through bond bonding interaction on each C-O bond and on each M-C bond, there is an overall strong bonding character to this MO, which is why it is occupied and deeper in energy than the HOMO.
MO number 47: t2g
- Occupied MO
Axial C-O groups do not take part in this MO. There is strong through bond bonding character on the four M-C bonds, and through space bonding character between each carbon. There is however strong through bond anti bonding character on each C-O bond. Thus there is an overall bonding character to the MO, but only slightly, and the relatively weak through space bonding interactions are likely all that make the overall MO bonding. This overall bonding character is why the MO is occupied, but the fact that it is only weakly bonding and thus not very deep in energy is why it is also the HOMO.
MO number 56: t2g
- Unoccupied MO
As with the previous MO, axial C-O groups do not take part. There is still a through space bonding interaction between Carbons like in the previous MO, but here the strong through bond interaction for both the M-C bonds and the C-O bonds are anti bonding in nature. Thus the MO is anti bonding overall, and is higher in energy even than the LUMO.
Ok MO analysis and a good selection of MOs. Your LCAOs are correct and you've evaluated the overall MO character well. To improve, consider using π- and σ- to describe orbital overlap, the degeneracy of the orbitals, the metal d orbitals used or the relative contributions (either in the ligand FO or the overall MO) are example details which you could have also thought about. Smf115 (talk) 14:18, 31 May 2019 (BST)
Overall a very good and well-presented report. Smf115 (talk) 22:01, 1 June 2019 (BST)
References
- ↑ CRC Handbook of Chemistry and Physics, 96th Edition.
- ↑ http://www.wiredchemist.com/chemistry/data/bond_energies_lengths.html[Accessed 23 May 2019]

