Ns35162018
BH3 Section
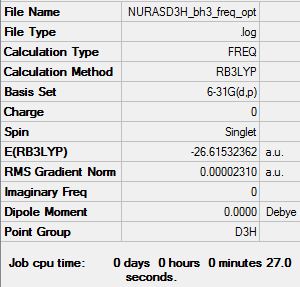
This was done using the RB3LYP calculation method and with the 6-31G basis set.
Item                      Value     Threshold  Converged?
Maximum Force            0.000049     0.000450     YES
RMS     Force            0.000032     0.000300     YES
Maximum Displacement     0.000195     0.001800     YES
RMS     Displacement     0.000127     0.001200     YES
The optimisation file is linked to here
Low frequencies ---   -0.4072   -0.1962   -0.0054   25.2514   27.2430   27.2460

Low frequencies ---   1163.1897 1213.3128 1213.3155
NH3 molecule |
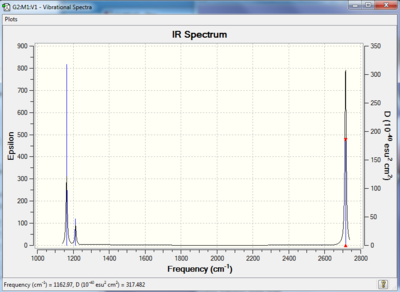
Vibrational spectrum for BH3
| wavenumber (cm-1 | Intensity (arbitrary units) | symmetry | IR active? | type |
| 763 | 260 | A2 | yes | out-of-plane bend |
| 1745 | 14 | E' | very slight | bend |
| 1745 | 14 | E' | very slight | bend |
| 3390 | 1 | A1' | no | symmetric stretch |
| 3543 | 1 | E' | yes | asymmetric stretch |
| 3543 | 1 | E' | yes | asymmetric stretch |
MO for BH3
These are snapshots of the real MO's next to the theoratically determined LCAO MO's:
Initially the differences between the real and LCAO MOs are minimal however they tend to become more different the more complex the structure.
MO theory is the very best tool we have to visualize MOs however it is not completely perfect.
NH3
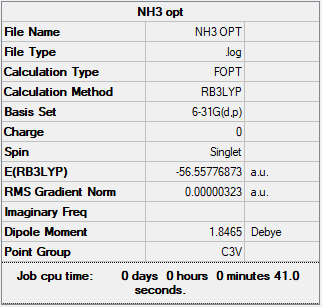
For the optimisation of NH3 a method and basis set of RB3LYP/G6-31G (d,p) was used.
The summary table provided by Gaussian for the optimisation can be found by the image below.
Provided below are the results of the optimisation.
        Item               Value     Threshold  Converged?
Maximum Force            0.000006     0.000450     YES
RMS     Force            0.000004     0.000300     YES
Maximum Displacement     0.000014     0.001800     YES
RMS     Displacement     0.000009     0.001200     YES
Below I have provided a link to the frequency file calculated when I carried out a frequency analysis to confirm the minimum structures.
The frequency file is linked to here
Low frequencies ---   -8.5646   -8.5588   -0.0041    0.0455    0.1784   26.4183

Low frequencies ---  1089.7603  1694.1865 1694.1865
NH3 molecule |
NH3BH3
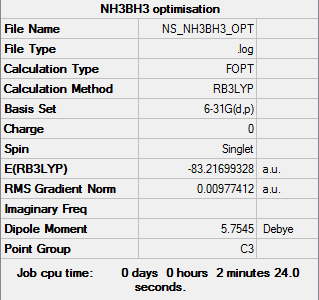
For the optimisation of this molecule a method and basis set of RB3LYP/6-31G (d, p) was used.
The summary table provided by Gaussian for the optimisation can be found by the image below.
Provided below are the results of the optimisation.
        Item               Value     Threshold  Converged?
Maximum Force            0.000164     0.000450     YES
RMS     Force            0.000035     0.000300     YES
Maximum Displacement     0.000901     0.001800     YES
RMS     Displacement     0.000338     0.001200     YES
Below I have provided a link to the frequency file calculated when I carried out a frequency analysis to confirm the minimum structures.
The frequency file is linked to here
Low frequencies ---  -12.2274   -0.2192   -0.0096    0.1953   15.4997   15.5736

Low frequencies ---  263.4795  631.2948  638.2338
NH3 molecule |
Energy of the bond
E(NH3)= -57 a.u.
E(BH3)= -27 a.u.
E(NH3BH3)= -83 a.u.
ΔE=E(NH3BH3)-[E(NH3)+E(BH3)]
ΔE=1 a.u.
ΔE=2625 kJ/mol
Ng611 (talk) 21:32, 15 May 2018 (BST) You've rounded too early. DFT calculations are accurate to about 1 kJ/mol (0.00001 a.u). You should have reported and used the au values to 5dp and rounded your final value to the nearest kJ/mol. Also, remember to cite a bond value (ideally from a textbook, databook, or paper, with a reference given) for comparison.
BBR3
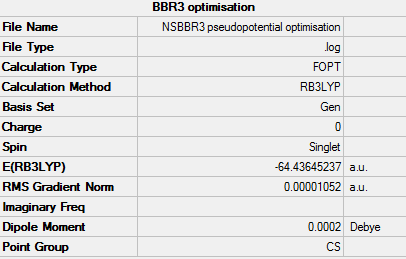
For the optimisation of this molecule a method and basis set of RB3LYP/GEN was used.
The summary table provided by Gaussian for the optimisation can be found by the image below.
Provided below are the results of the optimisation. As you can see the job has converged.
        Item               Value     Threshold  Converged?
Maximum Force            0.000023     0.000450     YES
RMS     Force            0.000014     0.000300     YES
Maximum Displacement     0.000127     0.001800     YES
RMS     Displacement     0.000089     0.001200     YES
Below I have provided a link to the frequency file calculated when I carried out a frequency analysis to confirm the minimum structures.
The frequency file is linked to here
Low frequencies ---   -0.0001    0.0001    0.0002    1.9432    2.8505    3.6597

Low frequencies ---   155.9251  156.0078  267.7057
NH3 molecule |
The BBR3 pseudopotential optimisation information can be found by the link below:
Project section - Aromaticity
Frequency Analysis
Benzene
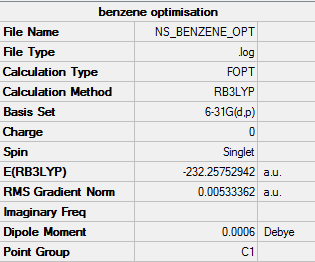
For the optimisation of benzene a method and basis set of RB3LYP/G6-31G (d,p) was used.
The summary table provided by Gaussian for the optimisation can be found by the image below.
Provided below are the results of the optimisation.
        Item               Value     Threshold  Converged?
Maximum Force            0.000198     0.000450     YES
RMS     Force            0.000082     0.000300     YES
Maximum Displacement     0.000849     0.001800     YES
RMS     Displacement     0.000305     0.001200     YES
Confirmed that this is a minima as the job has converged.
Below I have provided a link to the frequency file calculated when I carried out a frequency analysis to confirm the minimum structures.
The frequency file is linked to here
Low frequencies ---  -34.1539  -25.0251   -5.9789   -0.0005   -0.0002    0.0007

Low frequencies ---  412.0873  414.7255  619.8764
-At some points the low frequency line was not within the +15/-15 limit but this was deemed to be okay as job had converged.
Borazine
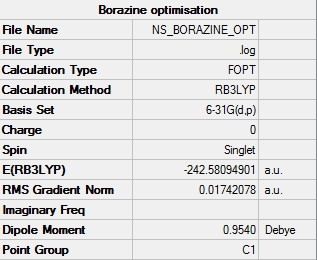
For the optimisation of benzene a method and basis set of RB3LYP/G6-31G (d,p) was used.
The summary table provided by Gaussian for the optimisation can be found by the image below.
Provided below are the results of the optimisation.
        Item               Value     Threshold  Converged?
Maximum Force            0.000078     0.000450     YES
RMS     Force            0.000039     0.000300     YES
Maximum Displacement     0.001795     0.001800     YES
RMS     Displacement     0.000487     0.001200     YES
Confirmed that this is a minima as the job has converged.
Below I have provided a link to the frequency file calculated when I carried out a frequency analysis to confirm the minimum structures.
The frequency file is linked to here
Low frequencies ---  -14.7433   -4.6797    0.0007    0.0007    0.0010    8.3272

Low frequencies ---  288.4766  290.2371  404.4033
-All the points for the low frequency lines are within the +15/-15 limit and the job had converged.
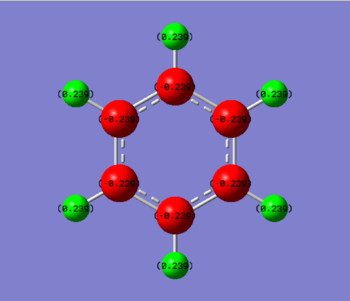
'Charge Distribution'
Benzene consists of carbon and hydrogen atoms in which there is a delocalised π-system. It is this π-system of overlapping p-orbital which result in the increased stabilisation of benzene. In benzene there is a symmetrical charge distribution throughout i.e. all the central carbon atoms have a charge of -0.246 and the external hydrogen atoms have a charge of 0.246.
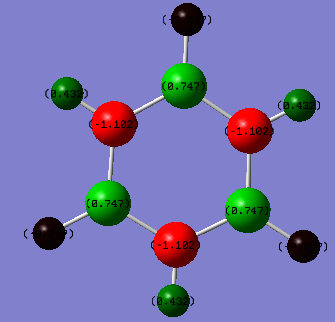
However, borazine is a different case. it consists of 3 electronegative nitrogen atoms alternating with 3 electropositive boron atoms. The boron atoms have a charge of 0.747 however the nitrogen atoms have a charge of -1.102. These atoms also have an effect on their respective hydrogen atoms.
Boron is more electropositive than hydrogen and so has a more positive charge value than its hydrogen (-0.077). Nitrogen is more electronegative than hydrogen and so has a more negative charge value than its hydrogen (0.432)
Molecular orbitals
S-Molecular Orbitals
MO7 is the totally symmetric molecule with A1 symmetry for both benzene and borazine. There is no antibonding character and is completely in phase. We can see from the image a large red 'blob' for benzene in which there are no protruding hydrogen atoms - the same cannot be said for borazine which in this case has less contribution from the hydrogen atoms.
P-Molecular Orbitals
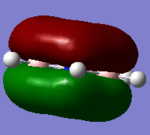
MO17 is the lowest energy antibonding orbital. It has one node intersecting the centre of the bond. There are two areas of electron density in this case - one above and below the plane of the molecule. From the images it can be seen that benzene and borazine have similar structures and similar contributions from the hydrogen atoms.
HOMO Orbitals
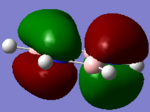
MO21 is the HOMO of both benzene and borazine. This frontier orbital has the highest energy structure of the valence orbitals. For both structures there are two nodes intersecting the molecule. These nodes contribute the energy of the molecule - the more nodes there are the higher the energy of the orbital. This explains why these MO's can be considered as HOMO's.
Ng611 (talk) 21:35, 15 May 2018 (BST) Your first MO analysis was good, including the overall symmetry and a description of the orbital. It would have been useful for you to have included this kind of analysis in your other two entries. Some rationalisation of the differences is would also be useful (why are the MOs of different shapes, what accounts for this?)
Ng611 (talk) 21:43, 15 May 2018 (BST) I get the feeling you struggled with the report somewhat. There are some good aspects to this report but there were large parts of it that were missing. Your aromaticity section was better, although we asked for Jmol files for both Benzene and Borazine which I couldn't find. You were also missing a discussion about aromaticity (the final section of this mini-project). Some more detail in your MO analysis would have improved your discussion on benzene/borazine further.

