Nm1916
MO Computational Labs
BH3
Optimization of BH3
Method-RB3LYP Basis Set- 631G(d,p)
Item Table
         Item               Value     Threshold  Converged?
 Maximum Force            0.000189     0.000450     YES
 RMS     Force            0.000095     0.000300     YES
 Maximum Displacement     0.000746     0.001800     YES
 RMS     Displacement     0.000373     0.001200     YES
Frequency Analysis
Frequency analysis log file NM_BH3_SYM_OPT_631G_FREQ.log
Low frequencies ---   -0.2263   -0.1037   -0.0055   47.9770   49.0378   49.0383
Low frequencies --- 1163.7209 1213.6704 1213.6731
Jmol
optimised BH |
Vibrational spectrum
| wavenumber (cm-1) | Intensity (arbitrary units) | symmetry | IR active? | type |
| 1164 | 92 | A2 " | yes | out-of-plane bend |
| 1214 | 14 | E' | slight | in plane bend |
| 1214 | 14 | E' | slight | in plane bend |
| 2580 | 0 | A1' | no | symmetric stretch |
| 2713 | 126 | E' | yes | asymmetric stretch |
| 2713 | 126 | E' | yes | asymmetric stretch |
There are 6 vibrational modes for BH3. However only 3 peaks are observed. This is due to some of the vibrations being degenerate i.e. having the same energy. Also one peak has 0 intensity- the symmetric stretch. This is due to there being no change in dipole moment when the molecule stretches symmetrically, therefore no peak is observed.
Smf115 (talk) 01:24, 23 May 2018 (BST)Correct assignment of the symmetries and vibrational modes. Good mention of both the degeneracy and the IR inactive mode to explain the 3 peaks.
MO Diagram for BH3
There are not many significant differences between the LCAO method and Gaussian generated MO. This shows that the LCAO is a good qualitative method for describing how MOs are formed.
Diagram above adapted from was adapted from http://www.huntresearchgroup.org.uk/teaching/year2_mos.html.
Energʏ
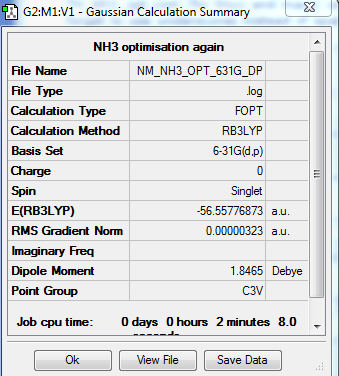
Energy of BH3= -26.615 au
NH3
Optimization of NH3
Method-RB3LYP Basis Set- 631G(d,p)
Item Table
         Item               Value     Threshold  Converged?
 Maximum Force            0.000006     0.000450     YES
 RMS     Force            0.000004     0.000300     YES
 Maximum Displacement     0.000012     0.001800     YES
 RMS     Displacement     0.000008     0.001200     YES
Frequency Analysis
Frequency analysis log file NM NH3 FRQ 631G DP2.LOG
 Low frequencies ---   -8.5646   -8.5588   -0.0041    0.0455    0.1784   26.4183
 Low frequencies --- 1089.7603 1694.1865 1694.1865
Jmol
optimised BH |
Energy
Energy of BH3 = -56.557 au.
Optimization of NH3BH3
Method-RB3LYP Basis Set- 631G(d,p)
Item Table
         Item               Value     Threshold  Converged?
 Maximum Force            0.000189     0.000450     YES
 RMS     Force            0.000095     0.000300     YES
 Maximum Displacement     0.000746     0.001800     YES
 RMS     Displacement     0.000373     0.001200     YES
Frequency Analysis
Frequency analysis log file NM NH3BH3 631G DP FREQUENCY.LOG
Low frequencies ---   -0.0007   -0.0004    0.0008   18.0575   28.4116   40.0963
Low frequencies ---  266.4888  632.3850  639.5950
Jmol
optimised BH |
Energy
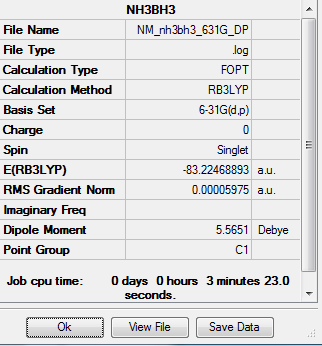
Energy of NH3BH3 = -82.247 au
Energy of reaction
Energy of NH3BH3 = -82.22469 au
Energy of BH3 = -26.61532 au.
Energy of NH3 = -56.55777 au
Energy of reaction = -0.05160 au = -135 kJ/mol.
That is reasonable to expect for the energy of the dative bond as the C-C sigma bond energy is around 340 kJ/mol.
BBr3
Item Table
         Item               Value     Threshold  Converged?
 Maximum Force            0.000008     0.000450     YES
 RMS     Force            0.000005     0.000300     YES
 Maximum Displacement     0.000036     0.001800     YES
 RMS     Displacement     0.000023     0.001200     YES
Frequency Analysis
Frequency analysis log file BBR3 freq again NM.log.LOG
Low frequencies ---   -0.0137   -0.0064   -0.0046    2.4315    2.4315    4.8421
Low frequencies ---  155.9631  155.9651  267.7052
Jmol
optimised BH |
DOI = DOI:10042/202368
Benzene
Optimization
Method'-RB3LYP Basis Set- 631G(d,p)
        Item               Value     Threshold  Converged?
 Maximum Force            0.000194     0.000450     YES
 RMS     Force            0.000077     0.000300     YES
 Maximum Displacement     0.000824     0.001800     YES
 RMS     Displacement     0.000289     0.001200     YES
Frequency Analysis
Frequency analysis log file NM BENZENE OPT 631 DP FREQ AGAIN2.LOG
Low frequencies ---  -16.9682  -14.6636  -14.6636   -0.0055   -0.0055   -0.0003
Low frequencies ---  414.1239  414.1239  620.9400
Charge Distributioɲ
Jmol
optimised BH |
Borazine
Method-RB3LYP Basis Set- 631G(d,p)
Optimization
         Item               Value     Threshold  Converged?
 Maximum Force            0.000085     0.000450     YES
 RMS     Force            0.000033     0.000300     YES
 Maximum Displacement     0.000252     0.001800     YES
 RMS     Displacement     0.000075     0.001200     YES
Frequencʏ
 Low frequencies ---    0.0003    0.0009    0.0009    3.4753    4.3544    6.8588
 Low frequencies ---  289.7049  289.7804  404.4236
Frequency analysis log file Nm BORAZINE FREQ AGAIN.LOG
Charge Analysis
Jmol
optimised BH |
Charge Analysis
| Molecule | Charge(colours) | Charge(values) |
|---|---|---|
| Benzene | 
|

|
| Borazine | 
|

|
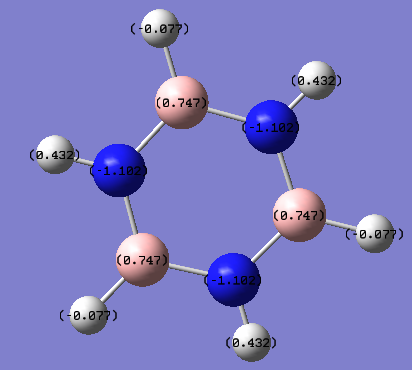
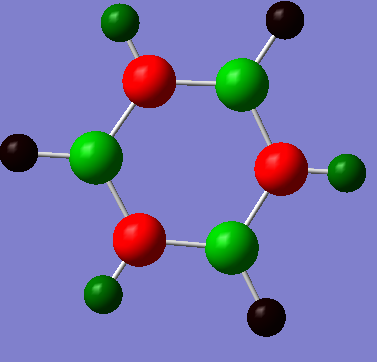
It is clear from the diagrams above that the charge distribution across benzene is much less than across borazine. This is due to the small electotronegativity difference between the carbon and hydrogen atoms. On the Pauling scale, there is only a 0.4 difference between carbon and hydrogens electronegativity therefore resulting in small polarity on the molecule and low charge distribution. A small charge of magnitude 0.239 NBO resides on both the carbon and hydrogen, with the more electronegative carbon atom carrying the partial negative charge.
Borazine, on the otherhand, has a much greater charge distribution, as the nitrogen atom has a much greater electronegativity than the boron atom. Nitrogen has an electronegativity of 3 on the Pauling scale, which is 1.0 and 1.1 greater than hydrogen and boron respectively. The hydrogen atoms charge distribution depends on whether it is attached to a boron atom or nitrogen atom. Boron and hydrogen have similar electronegativity therefore there is only a very small charge residing on the hydrogen atom. Whereas on the hydrogens attached to nitrogen atoms, the hydrogen atom carries a positive charge of 0.432 NBO, due to the difference in electronegativity difference between the two atoms. In general, borazine has a greater charge distribution due to the electronegativity difference between the atoms.
Smf115 (talk) 01:09, 23 May 2018 (BST)Correct mention of the electronegativties of the atoms resulting in the charge distribution. However, consideration of other aspects such as symmetry and the overall charge on the molecule would improve the discussion. Additionally, the charge distributions should have been made clearer by using the same colour range across the molecules.
Molecular Orbital Comparison
Aromaticity
Kekule invented the idea of aromaticity, proposing that benzene consisted of alternating carbon single bonds and double bonds and that molecules similar to benzene were considered aromatic. Huckel defined aromaticity in a different way, by saying that aromatic compounds have to be planar, and consists of a cyclic array of p orbitals perpendicular to the plane of the ring. He then said if the molecule has 4n+2 p electrons, the molecule has special stability and is considered as aromatic. If the molecule just has 4n p electrons, it is considered as anti-aromatic and are quite unstable. It has also been found that instead of having bond lengths alternating bond lengths, the bond length is intermediate between a single and double bond.
From computational calculations, it can be shown that at 20 K, benzene is no longer planar and instead adopts a chair conformation. This happens when benzene is in a crystalline state and strong intramolecular forces cause it to change conformation. This contradicts what Huckel defined as aromaticity, as he stated they have to be planar. Erlenmeyer thought that hydrocarbons that displayed similar properties to benzene would be considered as aromatic. However, borazine displays similar properties to benzene, and fits Huckels theory therefore Erlenmeyer theory appears flawed. [1]
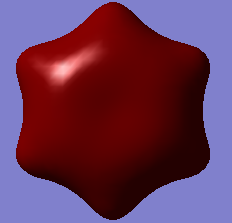
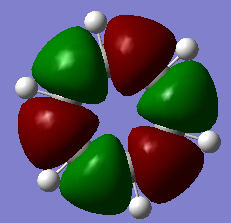
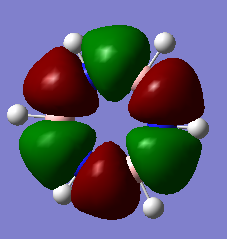
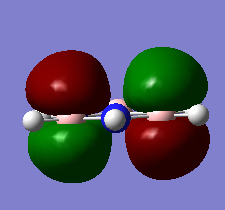
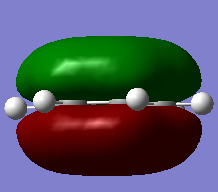
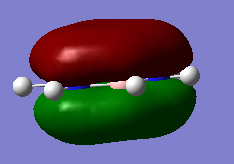
From comparing the MO of benzene from Gaussian to the LCAO method, it is evident that the LCAO is a relatively good method for showing qualitatively the occupied MOs in benzene, with the first entry in table 7 being very similar to what is expected from the lowest MO in LCOA. This is due to being able to accurately predict how carbons AOs are going to interact with eachother, as they have the same electronegativity. However, the LCAO for borazine is less accurate as qualitatively predicting the effect that electronegativity has on the shape of MOs is more difficult. The fact that the bonds within borazine are not going to be purely covalent, unlike in benzene, also makes it more difficult to draw a qualitative MO diagram.
The overlap of P(z) orbitals is not a good method to describe aromaticity, as molecules that are not planar still display aromatic properties. However, if the molecule is not planar, the P(z) orbitals will not fully overlap, resulting in less delocalisation of electron density.
- ↑ Palusiak M, Krygowski T,Chem. Eur. J. 2007, 13, 7996 – 8006
Smf115 (talk) 01:22, 23 May 2018 (BST)The key concepts of aromaticity are discussed and the use of borazine and the chair conformation of benzene are good contradictory, well referenced, examples. An improvement would have been to consider the number of MOs from those visualised which show electron delocalisation (including sigma-orbitals contirbuting sigma-aromaticity) rather than comparing them to the LCAO approach.
Smf115 (talk) 01:22, 23 May 2018 (BST)A good report overall with nice consideration to the accruacy of reported values throughout.


