Namespace:jr4072

Computational Chemistry - Introduction and application...
Computational chemistry allows us to model the structure and bonding of inorganic complexes, predicting their reactivity and properties. This consists thermodynamics - determining the energy of stable conformers and the location of transition states - and kinetics. In addition characterisation is possible by the prediction of spectra (IR, Raman, NMR, UV-Vis etc), and molecular orbitals may be analysed quantitatively to map electron density.
This information can then be used as effectively as bench-top (or fume hood!) chemistry, for example in screening molecules as enzyme inhibitors - do they have the right structure and bonding properties to block an active site? In example Merck Frost use computational chemistry to identify candidates for specific biological targets: http://www.merckfrosst.com/mfcl/en/corporate/research/medicinal_chem/computational.html.
Modelling Techniques & Calculations
The computational models may be built from ChemDraw structural drawings, which convert to 3D structures in Chem3D, or by direct modelling in GaussView. Optimisations may be run by MM2 (molecular mechanics) or PM6 (semi-empirical molecular orbital theory) in Chem3D, or by use of Gaussian to run quantum calculations - solving the Schroedinger equation - giving a more accurate result (though this takes more time and power to compute).
Molecular mechanics is limited, operating from defined parameters for bond lengths and angles, accounting only for basic lone pair interactions, sterics and van der Waals forces - molecular orbitals and secondary orbital interactions are disregarded. This often results in local energy minima structures being given, as alteration is only within a limited range of the starting structure. Consideration of where electrons locate in molecules is essential for predicting stereoselectivity in certain reactions, such as Diels Alder cycloadditions. More advanced methods take these latter factors into account.
Computational Chemistry - Module 2: Inorganic
The first section of this investigation illustrates the virtues of computational methods in determining structure, bonding and predicting reactivity in inorganic systems. The mini-project that follows then applies these methods to deduce new conclusions.
Structure, bonding and characterisation: BH3 and BCl3
In this section the use of computational methods to analyse structure and bonding are illustrated using two examples – BH3 and BCl3. The calculations are illustrated by BH3 example first, then a discussion follows on the geometry optimisation and frequency calculations for BCl3, and of the MOs of BH3, thereby evaluating the GaussView programme.
Optimising BH3 and analysing the output
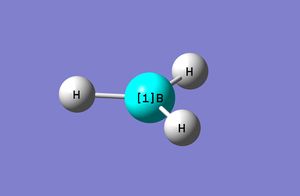
An optimisation calculation was run, using the B3LYP method on a 3-21G basis set of orbitals; this basis set has very low accuracy, but makes for a fast calculation; the method dictates the approximations made in solving the Schrodinger equation.
The optimisation completion is defined as the forces (gradient of energy vs. bond distance plot) converging to zero, i.e. a stationary point (minima) on the potential energy surface of a molecule. This is found by adjusting the positions of the nuclei for a given electronic configuration (optimisation steps) until there is no further decrease in the force experienced (within a given tolerance). The optimisation process is illustrated graphically below.
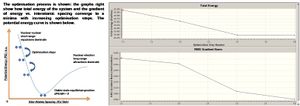
The optimisation steps may be animated in GaussView – as the BH distance shortens (from an initially large value) bonds form and the atoms come closer together. Initially there are no bonds – the atoms are too far apart, GaussView having defined parameters for when a bond should be shown: see later discussion (what is a bond?).
The optimised structure is stable and that of the gas phase, or a solid crystal free of distortions. The process invokes simplifications (notably the use of a pseudo-potential to model the effective core potential) and assumptions - these are defined in the method used; functions (such as polarisation and diffusion of electrons) are also applied to mimic reality. The basis set that the calculation is performed on determines the accuracy of the calculations (bigger is more accurate but takes longer to compute).
The results of the optimisation process are shown below, including the optimised geometry structure mapped for charge density. A similar optimisation was run for BCl3, the calculation summary is shown below, and the optimum bond distances and angles of the two compounds tabulated for comparison.

BH3 Molecular orbitals (MOs)

The molecular orbitals of BH3 are found - summarised below - by energy calculation in Gaussian (pop=full; 3-21G basis set, full NBO). Note that the unoccupied MOs are more diffuse than the occupied.
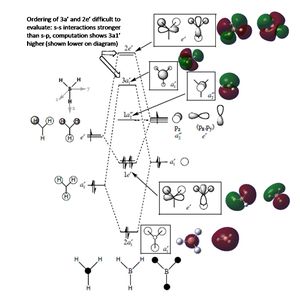
As can be seen the computational results match the LCAO in terms of phases and where the electron density is approximately; the computational MOs are however slightly more diffuse and smooth in their shape, diverging more from the AO shapes.
BH3 NBO analysis
Above is an image of BH3 mapped for charge density: B carries a partial charge of 0.33 and each of the H's a partial charge of -0.11 (partial charge is expressed as a fraction of the elementary charge of an electron, being 1.602x10⁻¹⁹C); the Gaussian NBO analysis output shows the BH bonds (2c-2e) to be formed from sp2 hybrid orbitals on the B, with the 1s electrons of B in a 100% s atomic orbital at the core, the third 2p orbital is 100% p and vacant, making BH3 a Lewis acid. The BH bonds are formed 45% from the B and 55% from the H (1s AO). Here then the MOs have been broken back down into AO constituents.
The output file also gives information about orbital mixing in the 'Second Order Perturbation Theory Analysis of Fock Matrix in NBO Basis' section, though there is little here for BH3.
BH3 Vibrational analysis
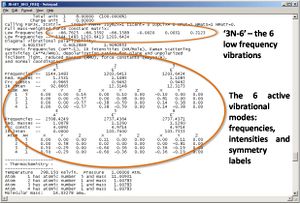
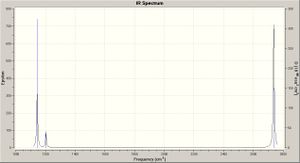
Using the optimised geometry structure (obtained above) a frequency analysis calculation was run for BH3 (DFT, B3LYP, 3-21G, pop=(full,nbo)). The results are summarised below.
Every molecule has 3N - 6 vibrations, the 6 being low frequency motions of the centre of mass; the the better the calculation the nearer to zero these are. For the calcultion employed these are (cm-1): -66.7625 -66.3592 -66.3589 -0.0020 0.0031 0.2123.
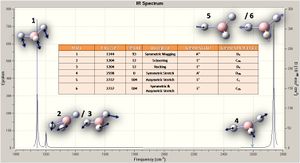
The results show six vibrations, which contain two overlapping pairs and one of zero intensity, thus three peaks are observed on the spectrum. The vibrational modes are illustrated on the spectra, and tabulated with symmetry labels and point groups.
Discussion
Calculations on BCl3
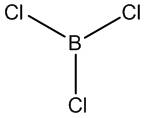
The D3h ground state structure of BCl3 has been optimised and confirmed as a minima by frequency analysis. The DFT / B3LYP method has been used, on a 3-21g basis set - this is true for both calculations and crucially so in giving comparative energies: changing the method or basis set alters the complexity of the calculation. For the ground state structure one expects D3h symmetry, which is indeed what GaussView uses (Framework group D3H[O(B),3C2(Cl)]).
- Geometric analysis...

The structural optimisation of BCl3 generates a trigonal planar structures with Cl-B-Cl bond angles of 120deg, in accord with the literature[2] (see table right). Interestingly the literature gives a shorter bond length, by some 0.6a.u. (175pm[lit] vs. 187pm[calc]): this is explained in part by π-bonding: the Cl lone pairs are able to donate electron density into the vacant p orbital on the boron, shortening the bonds.
- Frequency analysis...
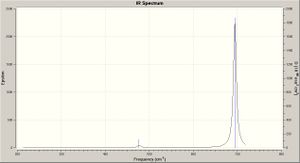
The frequency calculation results for BCl3 may be viewed here: DOI:10042/to-3004 . The frequency analysis shows global minima (not local, i.e. transition state) by the absence of negative frequency vibrations (since frequency is the second derivative of potential energy, a positive result thus indicating a minimum). The six low vibrations (cm-1) for BCl3 are: -0.0099 -0.0042 -0.0027 85.8496 85.8496 85.8829. The 3N-6 vibrational modes are illustrated on the spectrum below.

The frequency results (six vibrational modes) for BCl3 are shown below; the spectrum is shown right - click to enlarge.
   1                      2                      3
                   E'                     E'                     A1'
Frequencies --   237.5738               237.5738               339.9828
Red. masses --    32.5515                32.5513                34.9689
Frc consts  --     1.0825                 1.0825                 2.3815
IR Inten    --     0.0584                 0.0584                 0.0000
 Atom  AN      X      Y      Z        X      Y      Z        X      Y      Z
    1   5     0.00  -0.32   0.00    -0.32   0.00   0.00     0.00   0.00   0.00
    2  17     0.00  -0.51   0.00     0.58   0.00   0.00     0.00   0.58   0.00
    3  17     0.47   0.31   0.00    -0.24   0.47   0.00     0.50  -0.29   0.00
    4  17    -0.47   0.31   0.00    -0.24  -0.47   0.00    -0.50  -0.29   0.00
                    4                      5                      6
                   A2"                    E'                     E'
Frequencies --   476.5803               694.2896               694.3144
Red. masses --    11.7756                12.0777                12.0776
Frc consts  --     1.5758                 3.4302                 3.4304
IR Inten    --    14.0767               325.3985               325.4621
 Atom  AN      X      Y      Z        X      Y      Z        X      Y      Z
    1   5     0.00   0.00   0.98     0.98   0.00   0.00     0.00   0.98   0.00
    2  17     0.00   0.00  -0.10    -0.04   0.00   0.00     0.00  -0.17   0.00
    3  17     0.00   0.00  -0.10    -0.14   0.06   0.00     0.06  -0.07   0.00
    4  17     0.00   0.00  -0.10    -0.14  -0.06   0.00    -0.06  -0.07   0.00
MOs: qualitative vs. quantitative - for BH3
This demonstrates the power of qualitative MOs - by symmetry labelling we bring AOs together to form MOs, with the right phases - the quantitative MOs give a slightly more accurate picture of exactly where electron density is, but not so as to change our predictions (for example about reactivity). In terms of energy ordering there is a significant difference, as shown on the diagram above: the ordering of 3a1' and 2e' is confirmed by computation, whereas it is difficult to assess by LCAO on paper.
Gaussian evaluation: what is a bond?
In some structures GaussView does not draw bonds, as these are simply based on defined parameters of bond length; this does not mean there is no bond, indeed bonds can often be elongated in inorganic complexes. A bond can simply be considered as a region of electron density located between (as opposed to centred on) atoms, thus holding them together (electrostatic attraction). Pauling defines the bond in a slighly looser sense, focussing mainly on the result - that the atoms are held together enough to be treated as a single molecule:
"We shall say there is a chemical bond between two atoms or groups of atoms in case that the forces acting between them are such as to lead to the formation of an aggregate with sufficient stability to make it convenient for the chemist to consider it as an independent molecular species."[3]
This of course begs the question what is 'convenient' (given computational power!) and what is 'stable': the existence of a bond clearly depends on its environment (temperature, surrounding molecules), and is really a scale from strong covalent bonds to long-range couplings.
Calculations typically took 15 minutes (Imperial College Chemistry SCAN server).
An organometallic complex
There are two isomers - cis and trans - for the complex Mo(CO)4L2. Here the thermal stability and spectral characteristics of the two isomers are predicted (for L = PCl3, shown right [unoptimised] - click for 3D JMol visuals and to enlarge) - the trans form has one and the cis four CO vibrations. The more stable isomer is determined and the vibrational modes illustrated.
Symmetry point groups have been found by following a symmetry point group flow chart[4]: for the cis isomer: i, non-linear; ii, no Cn, n>2; iii, C2; iv, not 2C2 perpendicular; v, no σh; vi, 2σv: C2v. And for the trans isomer: i, non-linear; ii, no Cn, n>2; iii, C2; iv, 2C2 perpendicular; v, σh: D4h. Hence the trans isomer is restricted with one distinguishable peak, whereas less restricted cis has four (CO stretches)[5].

Mo(CO)4L2 Isomers - optimisation...
The trans and cis isomers were initially optimised (DFT, B3LYP, LANL2MB, opt=loose; low level accuracy): the calculation results may be viewed - cis: DOI:10042/to-2983 ; and trans: DOI:10042/to-2984 . This low level optimisation may derive a local minima - adjusting the inititial parameters gives an overall minima. The trans isomer was adjusted to have eclipsed PCl3 groups, with a PCl bond eclipsing a CO bond on each of the two ligands; the cis isomer was adjusted giving a PCl bond parallel to the axial Mo-C bonds in each case, one up and the other down (a 180deg torsion angle). The optimisation calculations were run again (DFT, B3LYP, LANL2DZ, con=ultrafine scf=conver=9; double zeta (DZ) is a more accurate basis set than (MB) the minimal basis). The calculation results may be viewed - cis: DOI:10042/to-2995 ; and trans: DOI:10042/to-2993 ; the optimised structures and calculation summaries are shown below.

The cis isomer is lower with an energy of -623.77 a.u. compared to -623.58 a.u. for the trans, this is a relative difference of 499kJ/mol, which equates to a temperature change (dG = nRT) of 60degC, which is significant - the isomers do not readily interconvert. Thus the cis isomer is more stable; this can be rationalised as the Cl atoms of the two ligand groups eclipse each other in the trans conformer. Moreover, by having CO ligands trans to PCl3, backbonding by CO is enhanced (EWG trans effect), and the CO ligands can back bond to different orbitals (they would have to compete if CO ligands were trans to each other).
Mo(CO)4L2 Isomers - frequency analysis...
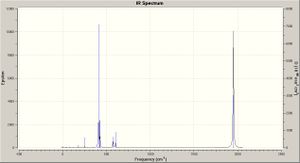
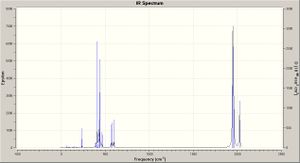
Using the optimised geometry structures (obtained as above) frequency analysis calculations were run for the two isomers (DFT, B3LYP, LANL2DZ, con=ultrafine scf=conver=9); the calculation results may be viewed - cis: DOI:10042/to-2999 ; and trans: DOI:10042/to-2996 . The key absorptions are tabulated below - comparing mainly the CO stretches for the two isomers, which are also graphed. The two predicted IR spectra for the isomers are shown right (click to enlarge).

The IR absorptions determined experimentally (J. Rumer, 2009) were (cm-1) 1890, 1930 and 2012 for cis (two overlap) and 1890 for the trans isomer; these are in approximately the same region as the calculations (reasonable for CO stretches), it should be noted that the IR data are not necessarily for perfect samples! The mode of the vibrations are illustrated below (using the cis isomer).
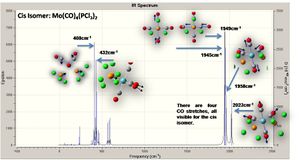
As expected there are four visible peaks in the spectra (CO stretching) for the cis isomer, and just one such visible peak for the trans isomer; all of these peaks are in the appropriate region for CO stretches according to the literature.[6]
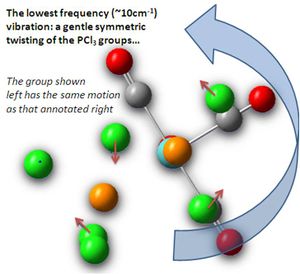
None of the vibrations were found to have negative frequencies, proving a global minima (not local) to have been achieved in terms of energy optimisation. The lowest vibration was ~10 wavenumbers, for a gentle twisting of the two PCl3 groups, this is shown right. This is at low energy as it does not involve stretching bonds, or peturbing the strongly bound CO ligands, furthermore, the Cl atoms move so as not to become spacially more confined through the vibration.
Such low frequency - and therefore low energy, by E = hv - vibrations are unobservable in the spectra, as the molecule possesses much more energy than is required for these, allowing higher vibrational levels to be achieved. By ΔG = nRT, this vibration has an energy of 1.99E-27 kJ/mol, which is near zero, thus at room temperature many greater levels are occupied.
These results are in accord with the literature - as discussed above we expect four observed stretches for the cis and one for the trans, which is the effective result; furthermore the vibrations are at the appropriate frequency, for comparison consider L = PPh3, where the cis form absorbs at (cm-1) 2023, 1927, 1908 and 1897.[7]
D Orbital considerations and geometric analysis...
The trans and cis isomers were previously optimised with the LANL2DZ basis set (slightly more accurate than the minimal basis [MB]); this however still neglects the interaction of vacant low-lying d orbitals of P in determining structure and bonding. The optimisation calculations were run again (DFT, B3LYP, LANL2DZ, con=ultrafine scf=conver=9 extrabasis; 'extrabasis' accounts for P dAOs). The results may be viewed - cis: DOI:10042/to-3000 ; and trans: DOI:10042/to-3001 . Subsequently the frequency calculations were repeated with these new optimised structures (retaining the 'extrabasis' term in the calculation input): the results are found - cis: DOI:10042/to-3002 ; and trans: DOI:10042/to-3003 ; the optimised structures and calculation summaries are shown below.

The isomers are now at highly similar energies (the relative difference ~0), the trans slightly lower than originally and the cis slightly higher. More significantly, there is a noticeable change in the 3D structures and reduction in dipole moments for both isomers. It is understood that the isomer with the minimal dipole (trans) will prevail as the more stable; the dipole moment is reduced as electron withdrawing PCl3 groups pull on both sides of the molecule cancelling each other out, the bond distortion aiding also.

Geometric analysis has been conducted on the two optimised isomers. This shows that the ligands are unchanged in both cases (similar Cl-P-Cl bond angles and PCl and CO lengths), the note worthy difference is the Mo-P bong length, which is higher for the cis isomer, most likely as a result of steric hindrance between the PCl3 groups. This is evidenced by the pushing of CO ligands together, in the trans conformer there is a P-C-P angle of 174deg (<180) as the two eclipsed H's repel and in the cis conformer 94deg (>90) as the PCl3 groups push apart.
This is in accord with the literature, which confirms that the cis Mo-P bond length is longer than the trans (2.5000a.u., slightly higher than the calculated).[8]
Discussion
The more stable isomer is predicted to be the trans form, as this has the least steric hindrance, and least dipole moment, with the energy difference between the two isomers (upon optimisation to account for d orbitals) being insignificant (not greater than the error on the values). The result could be determined in the lab by isolation of the isomers and melting point analysis (highest is more stable) or simply by formation of the product then characterisation by IR to determine which isomer prevailed, if a mixture of the two, the lower frequency IR peaks (identified above, modes 29, 31 and 33, c.415cm-1) which are different for the two isomers could be used (by intensity ratio) to identify the major product (most stable isomer). Increasing the steric hindrance on the ligands would be sure to emphasise this stability theory, with bulky groups forcing the trans isomer).
Both isomers have been synthesised in the lab (J. Rumer, 2009) and melting point analysis is as predicted, being c.180degC (decomposition) for the cis isomer, and 273-275degC for the trans (literature value), confirming trans to be the more stable isomer. [9]
Mini-Project
A mini-project in inorganic computational chemistry has been conducted based around thiophene polycyclic based semi-conductors, illustrating the use of MOs, and spectral predictions in determining the structure, bonding and properties of molecules.
The projects should be viewed here: https://www.ch.ic.ac.uk/wiki/index.php/Namespace:jr4072PROJECT.
Error analysis...
Calculated energies are accurate to ~10kJ/mol - 0.003809a.u. - and are thus reported to 0.01a.u.; dipole moments are accurate to 0.01 Debye, and frequencies reported to 1cm-1 (typically 10% error), likewise intensities (infrared) are given as whole numbers; bond distances are accurate to 0.01a.u. and angles to 0.1deg.
Notably energies between molecules should only be considered on a relative (kJ/mol; not absolute!) level; absolute values are noted for reproducibility only (a.u.), and consistency is paramount for comparison (basis set, method, details).
References
- ↑ Base MO diagram (LCAO) taken from Hunt research group (Imperial College London) teaching pages: http://www.ch.ic.ac.uk/hunt/teaching/year2_mos.html, accessed 02/12/2009
- ↑ N. Greenwood & A. Earnshaw, Chemistry of the Elements (2nd ed.), Oxford: Butterworth-Heinemann, 1997
- ↑ L. Pauling, The Nature of the Chemical Bond (3rd ed.), Cornell University Press, 1960
- ↑ Shriver, Atkins and Langford, Inorganic Chemistry, 2nd ed., W. H. Freeman & Co., 1994
- ↑ M. Y. Darensbourg and D. J. Darensbourg, J. Chem. Ed., 1970, 47, 33
- ↑ Silverstein, Bassler and Morrill, Spectrometric Identification of Organic Compounds, 4th ed., New York: John Wiley & Sons, 1981
- ↑ M. Y. Darensbourg and D. J. Darensbourg, J. Chem. Ed., 1970, 47, 33
- ↑ G. Hogarth and T. Norman, Inorganica Chimica Acta, 1997, 1 (254), 167-171
- ↑ W. Heiber and J. Peterhans, Z. Naturoforsch, 1959, 14B, 462
External links
- [Merck Forst - Computational Chemistry Applications: http://www.merckfrosst.com/mfcl/en/corporate/research/medicinal_chem/computational.html]
- [Chemistry SCAN Link: https://scanweb.cc.imperial.ac.uk/uportal2/]
- [Illustration of vibrational mode categories: http://en.wikipedia.org/wiki/Infrared_spectroscopy]
- [Online symmetry point group flow chart: http://capsicum.me.utexas.edu/ChE386K/Images/point_group_flowchart_shriver.jpg]
- [Mini-project: https://www.ch.ic.ac.uk/wiki/index.php/Namespace:jr4072PROJECT]
