Na2615
Introduction
Through the use of the computer software GaussView and Gaussian 09W, the physical properties of three molecules were analysed. The information relating to the molecules was obtained through the optimization of each molecule, the optimization of the molecules were then saved as log files to permit the display of the molecules using Guassview.
Molecule Investigation - NH3
NH3
- The calculation method used for the optimization of this molecule was RB3LYP
- The basis set used = 6-31G(d,p)
- The final energy, E(RB3LYP) in atomic units = -56.55776873
- The RMS Gradient in atomic units = 0.00000485, this is suitable as it is close in value to zero
- The point group of the molecule = C3V
N - H bond length = 1.01798
H - N - H bond angle = 105.741 A
Table Showing convergence
| Item | Value | Threshold | Converged? |
|---|---|---|---|
| Maximum Force | 0.000004 | 0.000450 | YES |
| RMS Force | 0.000004 | 0.000300 | YES |
| Maximum Displacement | 0.000072 | 0.001800 | YES |
| RMS Displacement | 0.000035 | 0.001200 | YES |
Predicted change in Energy = -5.986272D-10
IMAGE OF NH3
Ammonia molecule |
The optimisation file is liked to here
Image of the Vibrations that occur in NH3
- From the 3N-6 rule, the ammonia was only expected to have 6 vibrations
- There are two sets of degenerate modes one at the frequency 1693.95 which consist of the modes 2 & 3 and the other at 3589.82 consisting of the modes 5 & 6.
- The modes which produce a bending vibrations are modes 1,2 & 3 as modes 4,5 & 6 show bond stretches
- The mode which is highly symmetric is mode 4
- The bending vibration of mode 1 is referred to as a umbrella mode
- In an experimental spectrum of gaseous ammonia we would expect to see 2 bands the infrared intensities for modes 4 - 6 are two small to be seen on the spectra, these intensities are small as the dipole-dipole moments at these modes aren't changing greatly, and as modes 2 & 3 are degenerate their infrared intensities will combine to form one peak.
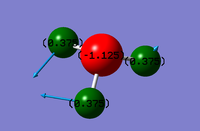
Image of ammonia with NBO atom charges
As Nitrogen is a more electronegative atom than hydrogen, it would be expected to have a greater negative charge as it would attract electrons more strongly than the hydrogen atoms
Molecule Investigation - N2
N2
- - The calculation method used for the optimization of this molecule was RB3LYP
- The basis set used = 6-31G (d,p)
- The final energy, E(RB3LYP) in atomic units = -109.52412868
- The RMS Gradient in atomic units = 0.00000060 , this is suitable as it is close in value to zero
- The point group of the molecule = D∞h
N - N bond length = 1.10550
As the molecule is linear there is no bond angle
Table for the optimization of N2
| Item | Value | Threshold | Converged? |
|---|---|---|---|
| Maximum Force | 0.000001 | 0.000450 | YES |
| RMS Force | 0.000001 | 0.000300 | YES |
| Maximum Displacement | 0.000000 | 0.001800 | YES |
| RMS Displacement | 0.000000 | 0.001200 | YES |
Predicted change in Energy = -3.401020D-13
IMAGE OF N2
Nitrogen molecule |
The optimisation file is liked to here
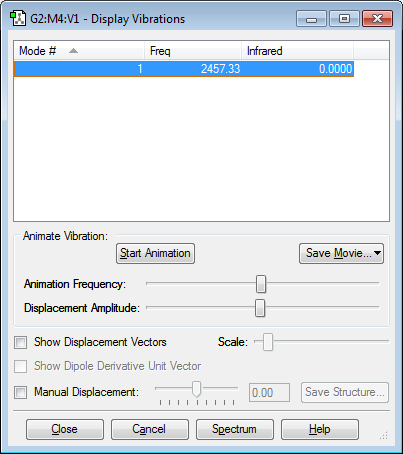
Image of the Vibrations that occur in N2
- From the 3N-5 rule, the nitrogen was only expected to have 1 vibration
- Nitrogen only has one vibrational stretch at the frequency 2457.33
- In an experimental spectrum of gaseous nitrogen we would expect to no bands because there isn't an infrared intensity for the corresponding frequency due to the lack of dipole-dipole moments.
Image of Nitrogen with NBO atom charges
The diatomic nitrogen molecule was expected to have no charge distribution as the nitrogen atoms have the same electronegativity, therefore one atom is not more charged than the other.
Molecule Investigation - H2
H2
- The calculation method used for the optimization of this molecule was RB3LYP
- The basis set used = 6-31G(d,p)
- The final energy, E(RB3LYP) in atomic units = -1.17853936
- The RMS Gradient in atomic units = 0.00000017, this is suitable as it is close in value to zero
- The point group of the molecule = D∞h
H - H bond length = 0.74279
The molecule is linear
Table for the optimization of H2
| Item | Value | Threshold | Converged? |
|---|---|---|---|
| Maximum Force | 0.000000 | 0.000450 | YES |
| RMS Force | 0.000000 | 0.000300 | YES |
| Maximum Displacement | 0.000000 | 0.001800 | YES |
| RMS Displacement | 0.000001 | 0.001200 | YES |
Predicted change in Energy = -1.164080D-13
IMAGE OF H2
Hydrogen molecule |
The optimisation file is liked to here
Image of the Vibrations that occur in H2
- From the 3N-5 rule, the hydrogen was only expected to have 1 vibration
- Nitrogen only has one vibrational stretch at the frequency 4465.68
- In an experimental spectrum of gaseous hydrogen we would expect to no bands because there isn't an infrared intensity for the corresponding frequency due to the lack of dipole - dipole moments.
Haber-Bosch reaction energy calculation - Image of Hydrogen with NBO atom charges
The diatomic hydrogen molecule was expected to have no charge distribution as the hydrogen atoms have the same electronegativity, therefore one atom is not more charged than the other.
Calculating bond energies - Haber-Bosch reaction energy calculation
The conversion between kJmol -1 and a.u is 0.01 kJmol-1 = 0.0000038 au
-E(NH3)= -56.55776873 a.u. or -148492.433112 kJmol -1
-2*E(NH3)= -113.11553746 a.u. or -296984.86622434 kJmol -1
-E(N2)= -109.52412868 a.u. or -287555.62175417 kJmol -1
-E(H2)= -1.17853936 a.u. or -739.544771842 kJmol -1
-3*E(H2)= -3.53561808 a.u. or -9282.76597616 kJmol -1
-ΔE=2*E(NH3)-[E(N2)+3*E(H2)]= -0.0557907 a.u. or -146.47849401 kJmol -1
Out of the reactant gases and the product, the ammonia product is more stable it's an exothermic reaction. The literature value for the enthalpy of formation of ammonia is less exothermic than the calculated value at -92.54 kJmol -1(1). The difference between the values could be due to the loss of the heat from the reaction vessel to the surroundings, therefore resulting the the experimental enthalpy being lower than the predicted enthalpy. Also the predicted enthalpy value does not take into account the entropy of the reaction, and as the entropy decreases from the reactants to the products, the entropy of the reaction will be reduced and therefore the predicted value should be less exothermic.
Molecule Investigation - ClF
ClF
- The calculation method used for the optimization of this molecule was RB3LYP
- The basis set used = 6-31G (d,p)
- The final energy, E(RB3LYP) in atomic units = -559.94269578
- The RMS Gradient in atomic units = 0.00014211 , this is suitable as it is close in value to zero
- The point group of the molecule = C∞V
Cl - F bond length = 1.66434
As the molecule is linear there is no bond angle
Table for the optimization of N2
| Item | Value | Threshold | Converged? |
|---|---|---|---|
| Maximum Force | 0.000246 | 0.000450 | YES |
| RMS Force | 0.000246 | 0.000300 | YES |
| Maximum Displacement | 0.000433 | 0.001800 | YES |
| RMS Displacement | 0.000613 | 0.001200 | YES |
Predicted change in Energy = -1.066054D-07
IMAGE OF ClF
Chlorine monofluoride molecule |
The optimisation file is liked to here
Image of the Vibrations that occur in ClF
- From the 3N-5 rule, Chlorine monofluoride molecule was only expected to have 1 vibration
- Chlorine monofluoride molecule only has one vibrational stretch at the frequency 2457.33
- In an experimental spectrum of gaseous Chlorine monofluoride molecule we would expect to see 1 band because it only has one vibration, however this may be difficult to see as the infrared intensity is quite low.
Image of Chlorine monofluoride molecule with NBO atom charges
The Chlorine monofluoride molecule was expected to have a charge distribution as the fluorine atom has a higher electronegativity than chlorine, so the fluorine atom will attract the electrons more strongly giving it a negative charge.
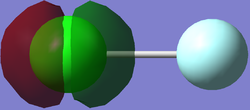
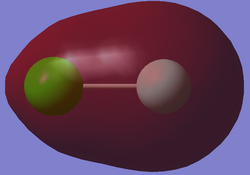
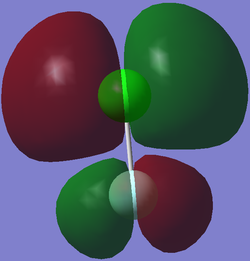
Molecular Obritals for Chlorine monofluoride
The image shows a non-bonding 1s orbital for Chlorine monofluoride, the atomic orbital which contributed to this MO is the 1s orbital from chlorine, this is due to the fact that the fluorine 1s orbital is at a much lower energy level and therefore cannot combine with the chlorine 1s orbtial to form a bonding orbital.
The image shows a non-bonding 2p orbital, however the bonding is only shown around the chlorine atoms as this is less electronegative than the fluorine atom, so it's 2p atomic orbital will be at a higher energy level than the 2p orbital of the fluorine atom, causing the two sets of 2p orbitals not to match up.
The image shows a filled sigma molecular bonding orbital, the molecular orbital consists of the 3s chlorine atomic orbital and the 2s fluorine atomic orbital. The molecular orbital appears larger at the side of the fluorine atom, this is due to the atomic orbital from fluorine being closer to the bonding orbital than the chlorine atomic orbital.
The image displays a filled pi molecular anti-bonding orbital, the molecular orbital consists of the 3p chlorine atomic orbital and the 2p flourine atomic orbital, this is also the Highest Occupied Molecular Orbital (HOMO). This molecular orbital is degenerate.
The image displays an unfilled anti-bonding molecular orbital,the molecular orbital consists of a 3p chlorine atomic orbital and a 2p fluorine atomic orbital. This is the Lowest Unoccupied Molecular Orbital (LUMO).
References
1. Vanderzee CE, King DL. The enthalpies of solution and formation of ammonia. The Journal of Chemical Thermodynamics. 1972 Sep 30;4(5):675-83.


