NY517 Mod
BH3
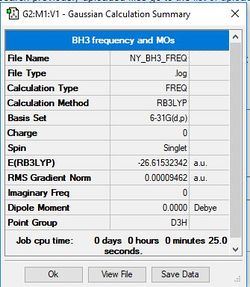
Method/Basis Set: B3LYP/6-31G(d,p)
         Item               Value     Threshold  Converged?
 Maximum Force            0.000189     0.000450     YES
 RMS     Force            0.000095     0.000300     YES
 Maximum Displacement     0.000746     0.001800     YES
 RMS     Displacement     0.000373     0.001200     YES
Frequency analysis log file: NY_BH3_FREQ.LOG
Low frequencies ---   -0.2263   -0.1037   -0.0054   47.9770   49.0378   49.0383
 Low frequencies --- 1163.7209 1213.6704 1213.6731
Optimised borane molecule |
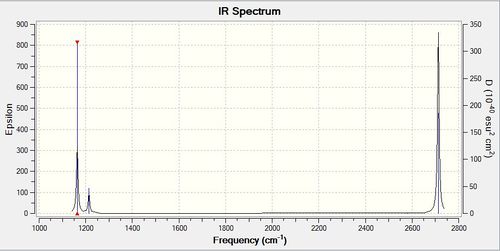
Vibrations and IR
| Frequency/ cm-1 | Intensity | Symmetry | IR Active? | Type of Vibration |
| 1164 | 92 | A2' ' | Yes | Bend |
| 1214 | 14 | E' | Yes | Bend |
| 1214 | 14 | E' | Yes | Bend |
| 2580 | 0 | A1' | No | Symmetric Stretch |
| 2713 | 126 | E' | Yes | Asymmetric Stretch |
| 2713 | 126 | E' | Yes | Asymmetric Stretch |
There are 6 vibrations but only 3 peaks in the spectrum. There are two cases of degenerate vibrations where vibrations with the same energy superimpose their intensities. This gives rise to the peaks at 1214 cm-1 and 2713 cm-1. The A1 vibration is a symmetric stretch so has no change in dipole moment and is therefore not IR active.
Complete table for the vibrational analysis and a very clear answer. Smf115 (talk) 08:59, 30 May 2019 (BST)
MO Diagram
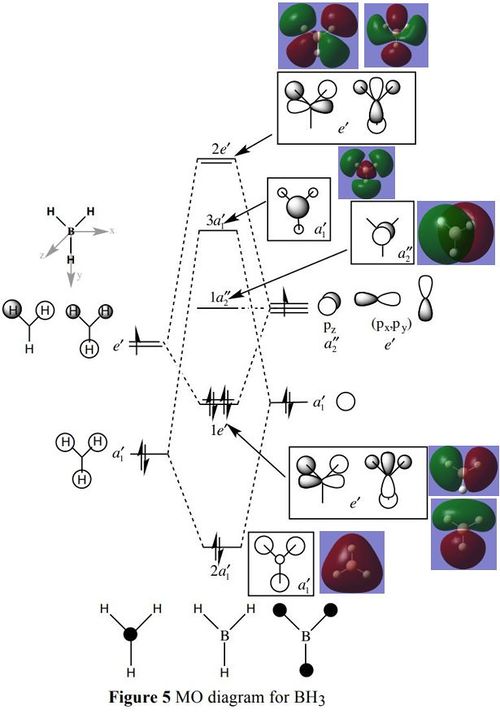
This diagram compares a MO diagram of BH3[1] and the LCAO with the computed MOs. The LCAO and real MOs are very similar since the LCAO MOs correctly predict the regions of electron density and nodes as well as correctly predict their relative energy levels. However, their shapes do not completely represent the overlapping of orbitals compared to heir associated computed MOs. This indicates that LCAO MOs for BH3 are very useful for predicting the general shapes and relative energies. They are accurate enough for most MO analysis and is a process that requires fewer resources than computing MOs.
Clear addition of the calculated MOs by the corresponding LCAOs and nice evaluation of the usefulness of the LCAO approach. The difference highlighted between the calculated and LCAO MOs is a bit vague and an example, e.g. considering the differences between the 3a1' or 2e' MOs would have improved the answer. Smf115 (talk) 08:58, 30 May 2019 (BST)
NH3
         Item               Value     Threshold  Converged?
 Maximum Force            0.000013     0.000450     YES
 RMS     Force            0.000006     0.000300     YES
 Maximum Displacement     0.000040     0.001800     YES
 RMS     Displacement     0.000013     0.001200     YES
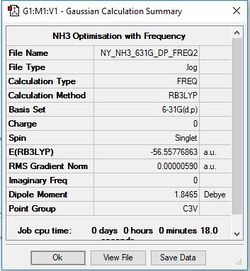
Frequency analysis log file: NY_NH3_631G_DP_FREQ2.LOG
Low frequencies ---   -8.5223   -8.4750   -0.0029    0.0335    0.1919   26.4067
 Low frequencies --- 1089.7616 1694.1862 1694.1866
Optimised ammonia molecule |
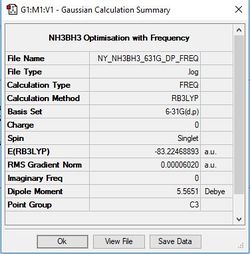
NH3BH3
Method/Basis Set: B3LYP/6-31G(d,p)
         Item               Value     Threshold  Converged?
 Maximum Force            0.000115     0.000450     YES
 RMS     Force            0.000060     0.000300     YES
 Maximum Displacement     0.000569     0.001800     YES
 RMS     Displacement     0.000345     0.001200     YES
Frequency analysis log file: NY_NH3BH3_631G_DP_FREQ.LOG
Low frequencies ---   -0.0249   -0.0031    0.0003   17.1475   17.1498   37.2156
 Low frequencies ---  265.8048  632.2133  639.3570
Optimised ammonia molecule |
Energies
E(NH3)= -56.55776863 au
E(BH3)= -26.61532342 au
E(NH3BH3)= -83.22468893 au
ΔE= -0.05160 au x 2625.5 = -135 kJ mol-1
The B-N dative bond is weak since it’s bond enthalpy is lower than that for a C-N bond at 305 kJ mol-1
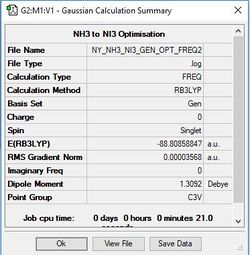
NI3
Method/Basis Set: B3LYP/6-31G(d,p) for N and LanL2DZ for I
         Item               Value     Threshold  Converged?
 Maximum Force            0.000116     0.000450     YES
 RMS     Force            0.000069     0.000300     YES
 Maximum Displacement     0.001026     0.001800     YES
 RMS     Displacement     0.000645     0.001200     YES
Frequency analysis log file: NY NH3 NI3 GEN OPT FREQ2.LOG
Low frequencies ---  -12.4683  -12.4620   -5.7337   -0.0040    0.0193    0.0695
 Low frequencies ---  100.9420  100.9427  147.2614
Optimised NI3 molecule |
The optimised N-I bond length is 2.184 Å.
Good structure information and presentation throughout and it looks like the pseudopotential has been correctly implemented here. However, all of the links to the corresponding frequency log files are broken! Smf115 (talk) 08:55, 30 May 2019 (BST)
Project: Metal Carbonyls
This project looks to investigate the trend in M-C bond lengths and vibrational frequencies of the CO ligand for the following metal complexes: [V(CO)6]-, [Cr(CO)6], [Mn(CO)6]+. These three complexes were chosen because they have metal centres that are successive along a period in the periodic table and a positive, neutral and negative complex are represented in this sample also. An initial hypothesis predicts that the bond lengths would decrease from V to Mn because their oxidation states increase and so will result in a larger Δoct and greater M-C bond strength. This increase in M-C bond strength will reduce the strength of the C-O bond (due to the electron density centring on the M-C bond) and therefore cause a reduction in their vibrational frequencies.
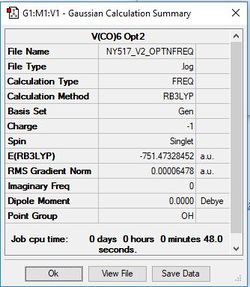
[V(CO)6]-
Method/Basis Set: B3LYP/6-31G(d,p) for C & O and LanL2DZ for V
         Item               Value     Threshold  Converged?
 Maximum Force            0.000198     0.000450     YES
 RMS     Force            0.000070     0.000300     YES
 Maximum Displacement     0.001382     0.001800     YES
 RMS     Displacement     0.000660     0.001200     YES
Frequency analysis log file: NY517_V2_OPTNFREQ.LOG
Low frequencies ---    0.0010    0.0013    0.0014   14.1311   14.1311   14.1311
 Low frequencies ---   52.8916   52.8916   52.8916
Optimised [V(CO)6]- Complex |
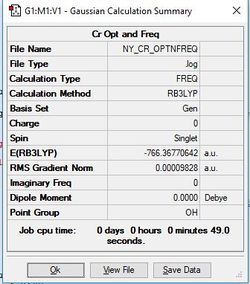
[Cr(CO)6]
Method/Basis Set: B3LYP/6-31G(d,p) for C & O and LanL2DZ for Cr
         Item               Value     Threshold  Converged?
 Maximum Force            0.000160     0.000450     YES
 RMS     Force            0.000057     0.000300     YES
 Maximum Displacement     0.000225     0.001800     YES
 RMS     Displacement     0.000084     0.001200     YES
Frequency analysis log file: NY_CR_OPTNFREQ.LOG
Low frequencies ---    0.0012    0.0013    0.0014   10.8502   10.8502   10.8502
 Low frequencies ---   66.4359   66.4359   66.4359
Optimised [Cr(CO)6] Complex |
[Mn(CO)6]+
Method/Basis Set: B3LYP/6-31G(d,p) for C & O and LanL2DZ for Mn
         Item               Value     Threshold  Converged?
 Maximum Force            0.000054     0.000450     YES
 RMS     Force            0.000024     0.000300     YES
 Maximum Displacement     0.000430     0.001800     YES
 RMS     Displacement     0.000204     0.001200     YES
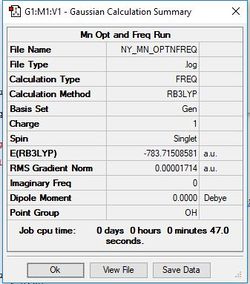
Frequency analysis log file: NY_MN_OPTNFREQ.LOG
Low frequencies ---   -0.0009   -0.0009   -0.0004    4.7607    4.7607    4.7607
 Low frequencies ---   76.3202   76.3202   76.3202
Optimised [Mn(CO)6]+ Complex |
Great structure information and correct charge and pseudopotential added for each of the complexes, just a shame that you have the same problem as in section 1 where all of the frequency file links are broken! Smf115 (talk) 10:40, 31 May 2019 (BST)
Evaluating Hypothesis
| Metal Complex | Frequency/ cm-1 | Intensity | Type of Vibration | Bond Length/ Å |
| [V(CO)6]- | 1969 | 2383 | Symmetric Stretch | 1.954 |
| [Cr(CO)6] | 2087 | 1637 | Symmetric Stretch | 1.915 |
| [Mn(CO)6]+ | 2199 | 879 | Symmetric Stretch | 1.908 |
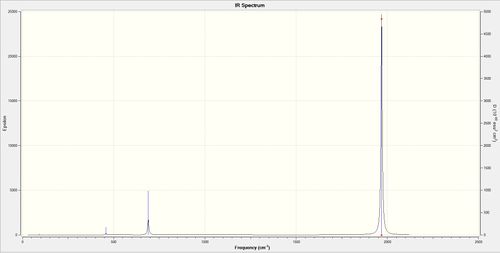
This table displays the bond lengths and frequency vibrations of the three metal complexes. The frequency values represent the stretching vibrations only of the CO ligands. There are no significant bending vibrations and will not be seen in an experimental spectrum due to their low intensities therefore they were not referred to in the table. Each stretching frequency has two additional degenerate vibrations which result in their large intensities seen in spectra (such as in the spectrum of [V(CO)6]- below).
I incorrectly predicted that the vibrational frequencies would decrease from the Vanadium to Manganese complexes because I failed to account for the change in charges for the complexes. The CO bond frequency (and bond strength) in fact increased despite the oxidation state on the metal centre increasing which should result in a larger Δoct and a stronger M-C bond and hence a weaker C-O bond. This did not occur which due to the complexes becoming more positive (or less negative). Increasing negative charge leads to the expansion of d-orbitals on the metal and therefore results in a greater overlap of M(dπ) orbital with the CO π* orbital. This process, which strengthens the M-C bond and increases its bond order, is called π-backonding (and is illustrated in the diagram below). A decrease in M-C bond order from the Vanadium to Manganese complexes resulted in an increase in bond order of the C-O bond. Since the vibrational frequency for the CO ligand (ν(CO)) is proportional to the force constant (k), an increase in strength of the CO bond will result in an increase in its vibrational frequency.
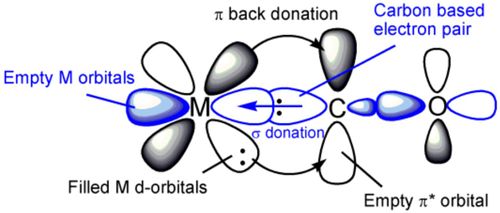
I correctly predicted that the M-C bond length would decrease but incorrectly justified this trend. The decrease in bond length directly contradicts the increase in vibrational frequency of the CO ligand and the theory that supports this. A decrease in M-C bond length implies an increase in the bond strength from the V to Mn complexes but the vibrational frequencies already confirmed that the M-C bond length decreases. This result could be a consequence of the theory used to justify this trend and requires further research to explain this.
Clearly presented hypotheses, good calculations and presentation of the data too which could have just been improved by plotting them vs. oxidation state, for example. Your explanation of the C=O vibration is great and you are correct in noticing that the M-C results do suggest other affects influence these bonds and it would have been great to just see some a suggestion maybe about wha/why this might be or what other property could be looked at further. Smf115 (talk) 11:13, 31 May 2019 (BST)
It is not possible to analyse the totally symmetric C-O vibrations for these complexes because they do not appear on spectra as they are IR inactive. This is because a symmetric vibration does not cause a change in dipole moment in the molecule which is a fundamental selection rule for spectroscopy.
Correct but you could also consider whether they are computationally possible to analyse? Smf115 (talk) 11:13, 31 May 2019 (BST)
MO Analysis of [Cr(CO)6]
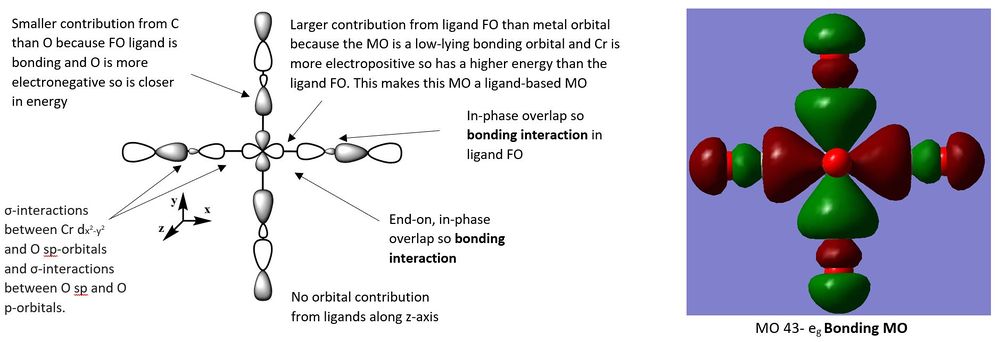
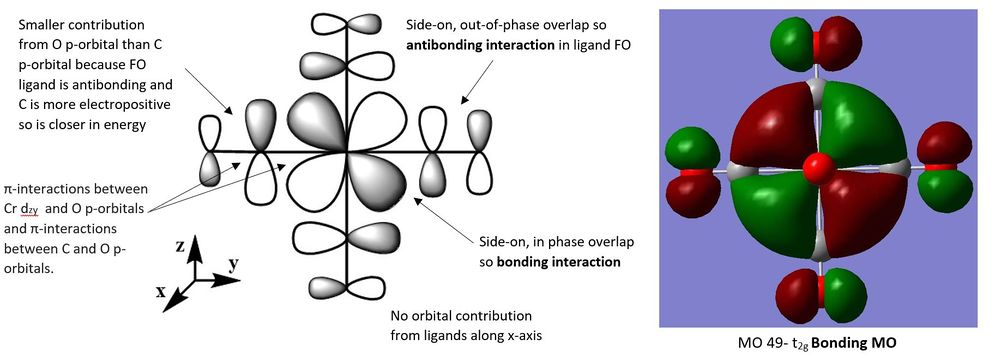
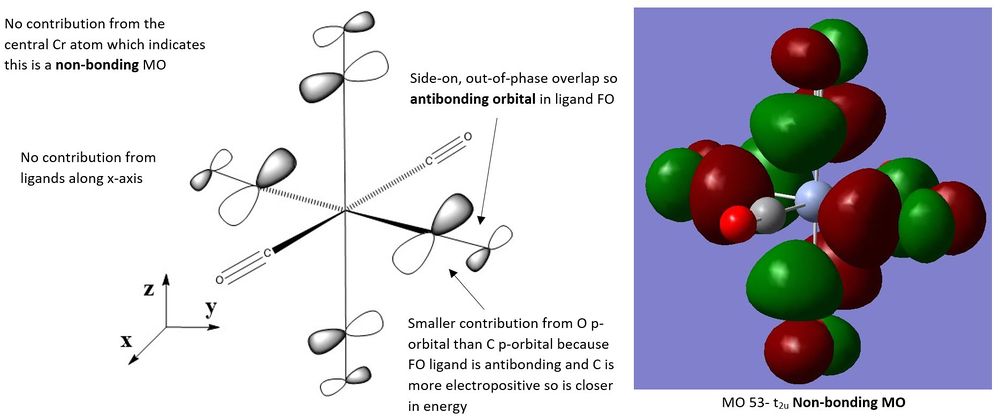
The three following molecular orbitals represent a mixture of bonding and non-bonding orbitals characterised by the different bonding and antibonding orbital interactions.
For MO 49, the metal d-orbital has a greater contribution to the MO than the ligand FO. This is because the contributing ligand orbital is the CO π* orbital which is higher in energy than the dyz orbital from the metal. Since MO 49 is a bonding orbital it lies closer in energy to the lower lying metal orbitals and is a metal-based MO.
Very good MO analysis across a nice range of selected MOs. You've evaluated the main interactions and MO character well, just note that your axes in the LCAO pictures aren't always representative to the orientation you've actually drawn the LCAO in and you could have noticed/commented on the degeneracy of some of the orbitals. Smf115 (talk) 11:27, 31 May 2019 (BST)
Overall, a good report which was let down by the broken structure links. Smf115 (talk) 11:27, 31 May 2019 (BST)

