My modelling
This investigation was done to explain the optimisation that the program Gaussview runs on molecules in order to achieve a perfect structure, taking into account frequency and vibrational analysis, reaction energies, atomic charges and molecular orbitals.
Ammonia investigation
This section outlines the calculations done on the molecule of ammonia.
1.Properties
Shown in the table below are the main properties of the ammonia molecule.
| Properties | |
|---|---|
| Molecule name | Ammonia (NH3) |
| Calculation method | B3LYP |
| Basis set | 6-31G(d,p) |
| Final energy E(RB3LYP) | -56.55776873 au |
| RMS gradient | 0.00000485 au |
| Point group of molecule | C3V |
| Optimised N-H bond distance | 1.01798 |
| Optimised H-N-H bond angle | 105.741 |
The table below summarizes the calculations that Gaussview does in order to tell if a molecule is optimised or not. All the parameters, such as Maximum Force, have values calculated with great precision. The program then checks if they lie under the threshold, and if they do that means that they've converged and the parameter is optimised. However, sometimes the structures are not optimised to their very best as Gaussview tends to stop calculations as a default once the value of the parameter reaches below the threshold.
Gaussview's optimisation output:
        Item               Value     Threshold  Converged?

 Maximum Force            0.000004     0.000450     YES

 RMS     Force            0.000004     0.000300     YES

 Maximum Displacement     0.000072     0.001800     YES

 RMS     Displacement     0.000035     0.001200     YES

 Predicted change in Energy=-5.986265D-10
 Optimization completed.
This image is a 3D representation of the molecule of ammonia.
Dynamic image
ammonia molecule |
The optimisation file is linked to here
2.Frequency and vibrations analysis, and atomic charges
The image below represents the table of molecular vibrations that Gaussview calculates. We use these calculations to understand the IR spectra of the molecule.
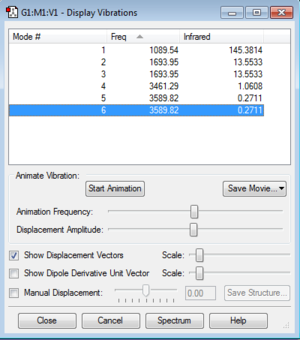
We expect 6 modes from the 3N-6 rule.
Modes 2,3 and 5,6 are degenerate.
Modes 1,2,3 are "bending" vibrations and modes 4,5,6 are "bond stretch" vibrations.
Mode 4 is highly symmetric.
Mode 1 is known as the "umbrella" mode.
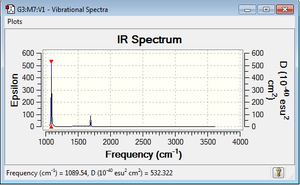
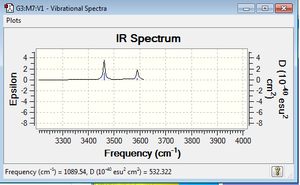
I would expect to see 4 bands in an experimental spectrum of gaseous ammonia as there are four highlighted energies for the vibrational modes. In reality, we only see two major peaks as some vibrations are IR inactive because they create a smaller dipole moment, therefore the peaks are much less visible on the IR spectrum.
When we solve the Schrödinger equation the energy is not the only output, we also obtain a wavefunction (Φ). The square of the wavefunction gives the electron density which can then be partitioned up and assigned to each atom. The result is that we can determine an atomic charge.
The charge distribution of ammonia is -1.125 for Nitrogen (N) and 0.375 for all three Hydrogen (H) atoms.
From an electronegativity (X) point of view, we can explain the negative charge on the N atom as it has X=3.04 while the H atoms have an X=2.2. The electronegativity difference is not so great therefore the electron density is only partially pulled towards the N atom.
3.Haber-Bosch process
This is the most famous way of producing ammonia in industries and is very interesting to analyse.
Analysing the reactants
Shown in the table below are the main properties of the nitrogen molecule.
| Properties | |
|---|---|
| Molecule name | Nitrogen (N2) |
| Calculation method | B3LYP |
| Basis set | 6-31G(d,p) |
| Final energy E(RB3LYP) | -109.52412868 au |
| RMS gradient | 0.00000060 au |
| Point group of molecule | D*H |
| Optimised N-N bond distance | 1.10550 |
| Optimised N-N bond angle | 180 |
This image is a 3D representation of the molecule of nitrogen.
Dynamic image
Nitrogen molecule |
The frequency for this molecule is 2457.33 .
The optimisation file is linked to here
The table below summarizes the calculations that Gaussview does in order to tell if a molecule is optimised or not. All the parameters, such as Maximum Force, have values calculated with great precision. The program then checks if they lie under the threshold, and if they do that means that they've converged and the parameter is optimised. However, sometimes the structures are not optimised to their very best as Gaussview tends to stop calculations as a default once the value of the parameter reaches below the threshold.
Nitrogen optimisation:
        Item               Value     Threshold  Converged?

 Maximum Force            0.000001     0.000450     YES

 RMS     Force            0.000001     0.000300     YES

 Maximum Displacement     0.000000     0.001800     YES

 RMS     Displacement     0.000000     0.001200     YES

 Predicted change in Energy=-3.400975D-13
 Optimization completed.
    -- Stationary point found.
Shown in the table below are the main properties of the hydrogen molecule.
| Properties | |
|---|---|
| Molecule name | Hydrogen (H2) |
| Calculation method | B3LYP |
| Basis set | 6-31G(d,p) |
| Final energy E(RB3LYP) | -1.17853936 au |
| RMS gradient | 0.00000017 au |
| Point group of molecule | D*H |
| Optimised H-H bond distance | 0.74279 |
| Optimised H-H bond angle | 180 |
This image is a 3D representation of the molecule of hydrogen.
Dynamic image
Hydrogen molecule |
The frequency for this molecule is 4465.68 .
The optimisation file is liked to here
The table below summarizes the calculations that Gaussview does in order to tell if a molecule is optimised or not. All the parameters, such as Maximum Force, have values calculated with great precision. The program then checks if they lie under the threshold, and if they do that means that they've converged and the parameter is optimised. However, sometimes the structures are not optimised to their very best as Gaussview tends to stop calculations as a default once the value of the parameter reaches below the threshold.
Hydrogen's optimisation:
        Item               Value     Threshold  Converged?

 Maximum Force            0.000000     0.000450     YES

 RMS     Force            0.000000     0.000300     YES

 Maximum Displacement     0.000000     0.001800     YES

 RMS     Displacement     0.000001     0.001200     YES

 Predicted change in Energy=-1.164080D-13
 Optimization completed.
    -- Stationary point found.
Reaction energies:
Haber-Bosch process reaction: N2 + 3H2 -> 2NH3
| Energy calculation | (au) |
|---|---|
| E(NH3) | -56.55776873 |
| 2*E(NH3) | -113.11553746 |
| E(N2) | -109.52412868 |
| E(H2) | -1.17853936 |
| 3*E(H2) | -3.53561808 |
| ΔE=2*E(NH3)-[E(N2)+3*E(H2)]= | -0.0557907 |
The energy difference for converting nitrogen gas and hydrogen gas into ammonia gas is -146.47848285 kJ/mol.
The ammonia product is more stable than the gaseous reactants as the energy difference for the reaction is negative indicating that the reaction is exothermic therefore spontaneous. Also, the single energies can be considered, and it is observed that the ammonia product has a more negative energy, so lower, than that of the two reactants.
Hydrochloric acid investigation
This section highlights the investigation carried out on the molecule of hydrochloric acid using Gaussview.
1.Properties
Shown in the table below are the main properties of the hydrochloric acid molecule.
| Properties | |
|---|---|
| Molecule name | Hydrochloric acid (HCl) |
| Calculation method | B3LYP |
| Basis set | 6-31G(d,p) |
| Final energy E(RB3LYP) | -460.80077875 au |
| RMS gradient | 0.00005211 au |
| Point group of molecule | C*V |
| Optimised H-Cl bond distance | 1.28599 |
| Optimised H-Cl bond angle | 180 |
The table below summarizes the calculations that Gaussview does in order to tell if a molecule is optimised or not. All the parameters, such as Maximum Force, have values calculated with great precision. The program then checks if they lie under the threshold, and if they do that means that they've converged and the parameter is optimised. However, sometimes the structures are not optimised to their very best as Gaussview tends to stop calculations as a default once the value of the parameter reaches below the threshold.
Gaussview's optimisation output of hydrochloric acid:
        Item               Value     Threshold  Converged?

 Maximum Force            0.000090     0.000450     YES

 RMS     Force            0.000090     0.000300     YES

 Maximum Displacement     0.000139     0.001800     YES

 RMS     Displacement     0.000197     0.001200     YES

 Predicted change in Energy=-1.256951D-08
 Optimization completed.
    -- Stationary point found.
This image is a 3D representation of the molecule of hydrochloric acid.
Dynamic image
Hydrochloric acid molecule |
The optimisation file is liked to here
2.Frequency and vibrational analysis, and atomic charges
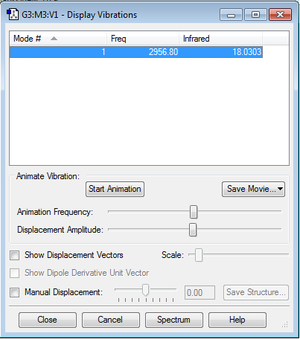
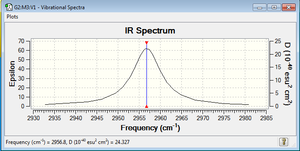
The frequency for this molecule is 2956.80, and a corresponding peak is seen on the IR spectrum of the molecule.
When we solve the Schrödinger equation the energy is not the only output, we also obtain a wavefunction (Φ). The square of the wavefunction gives the electron density which can then be partitioned up and assigned to each atom. The result is that we can determine an atomic charge. The charge distribution of hydrochloric acid is -0.284 for Chlorine (Cl) and 0.284 for the Hydrogen (H) atom. From an electronegativity (X) point of view, we can explain the negative charge on the Cl atom as it has X=3.16 while the H atom has an X=2.2. The electronegativity difference is not so great therefore the electron density is only partially pulled towards the Cl atom.
3.Molecular orbitals
The images below show the molecular orbitals (MOs) of hydrochloric acid. These orbitals are the orbital solutions to the Schrödinger equation, in other words the Φ, one for each MO energy level.
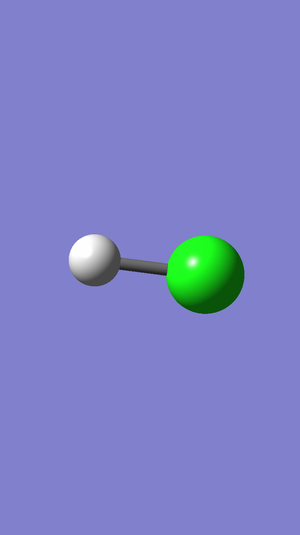
In this picture the MO is not visible. This is because the 1s atomic orbital of chlorine is much lower in energy compared to the 1s orbital of hydrogen, since it has more protons and can therefore hold its electrons closer to the nucleus, and so there will be no MO generated between the two 1s orbitals. The 1s atomic orbital is very deep in energy and so close to the chlorine nucleus that it can't be shown like the other MOs as it is a non-bonding orbital.

This picture represents the 2s orbital of chlorine. This atomic orbital is still too low in energy to be able to mix with the 1s orbital of the hydrogen atom, so it is completely concentrated around the chlorine atom.
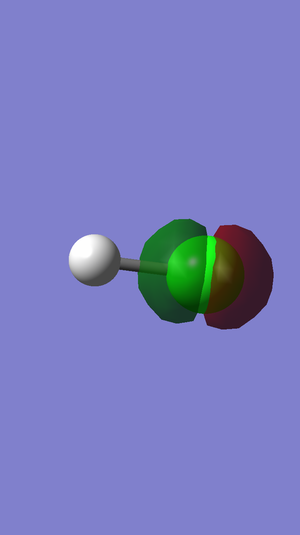
Here one of the three 2p orbitals of chlorine is represented. Like the 1s and 2s orbitals, chlorine's 2p orbitals are too low in energy to be able to form MOs with the 1s of the hydrogen.
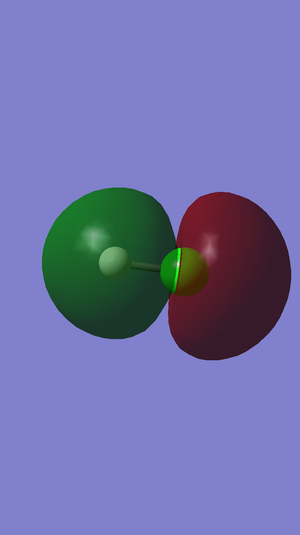
In this picture we can see the first and only bonding MO where one of the three 3p atomic orbitals of chlorine combines with the 1s atomic orbital of hydrogen to generate an occupied sigma bonding orbital.

This picture represents one of the two of three 3p atomic orbitals of chlorine remaining and is also one of the two identical HOMOs.
