
Mrd jp2916
Title
Ex 1
Dynamics of the transition state region
The transition state of a reaction is located at a saddle point of a potential energy surface. For the reaction of H with H2 in a linear configuration the system has two orthogonal vibrational modes shown as N and M. The system is centrosymmetric with distances AB and BC being equal. Any deviation from this equilibrium will cause the system to leave the saddle point(TS) towards the reactants or products.
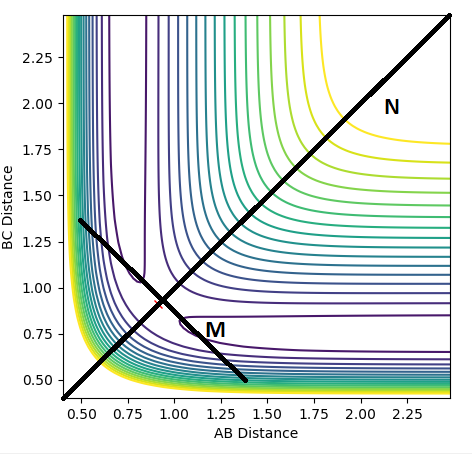

The first and second derivatives of the saddle point; maximum parallel to the reaction path are
∂V/∂M = 0, ∂2V/∂M2 > 0
while the first and second derivatives of the minimum orthogonal to the reaction path are
∂V/∂N = 0, ∂2V/∂N2 < 0
Good understanding of the saddle point. But I think you made a mistake in the second partial derivatives. For the maximum, the second partial derivative should be less than 0. For a minimum, the second partial derivative should be greater than 0. --Sw2711 (talk) 11:08, 4 June 2018 (BST)
Minima and maxima can be distinguished by their second derivative where they will take a value less than or greater than zero respectively.
Finding the transition state
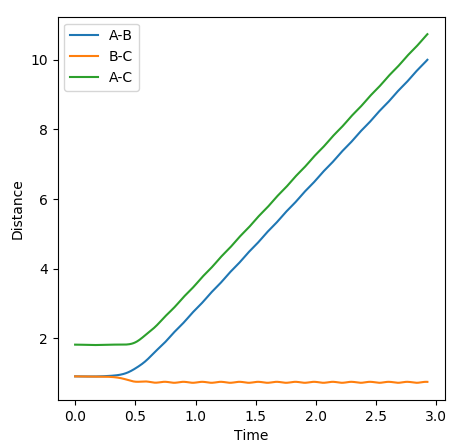
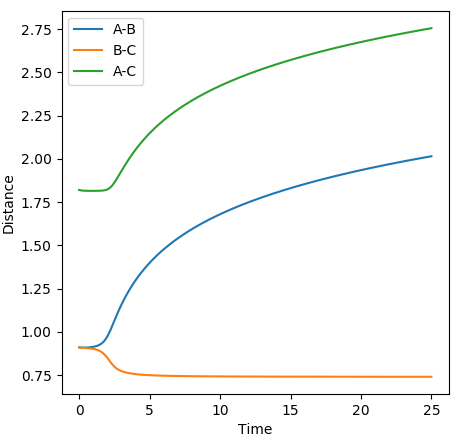
The transition state was found at r1 = r2 = 0.91. The transition state can be observed in the dt plot below at approximately 0.38t as the crossing point of measurement of distance between the particle. When placed with zero distance at this separation the particles remain bound but do not react. They oscillate centrosymetrically around particle B as is illustrated by the plot below.


Standard reaction conditions distance vs time plot and the transition state distance vs time plot
The intersection point is a good way to start locating the TS point. However, oscillating centrosymetrically while not reacting is not the way to find the TS. As long as you set r1=r2, the system will oscillate centrosymmetrically for a while. The correct logic is: because TS is a saddle point, it means the gradient is zero. Therefore, if you place your system at the saddle point with no momentum, it should not move at all. Hence you should expect a straight line in your distance vs time plot. --Sw2711 (talk) 11:13, 4 June 2018 (BST)
Calculating the reaction path
The MEP simulation resets particle velocity to zero every time step. As a result the particles have no inertial motion and will therefore follow the minimum energy path along the energy surface. As opposed to the dynamics simulation, the MEP graphs show no vibrations of molecules and the distance vs time graphs have shapes analogous to the reaction path on the energy surface.
Good. Something else you could notice is that in MEP the energy is not conserved. --Sw2711 (talk) 11:14, 4 June 2018 (BST)
Dynamics study distance vs time and energy vs time plots

MEP study distance vs time and energy vs time plots


Reactive and unreactive trajectories
| p1 | p2 | Energy | Reactivity | Trajectory | Description |
|---|---|---|---|---|---|
| -1.25 | -2.5 | -99.0 | Reactive |  |
Product has more vibrational energy than reactants. TS entered asymmetrically. |
| -1.5 | -2.0 | -100.5 | Unreactive |  |
Pathway is reversed before TS is reached. Reactant leaves faster than it enters. |
| -1.5 | -2.5 | -98.956 | Reactive |  |
Very similar to first reaction. |
| -2.5 | -5.0 | -84.956 | Unreactive |  |
Reactant crosses TS with almost no vibrational energy to then recross and be highly vibrationally excited. |
| -2.5 | -5.2 | -83.4 | Reactive |  |
Here the reactants again recross the TS but end up reacting and making a vibrationally excited product. |
Transition state theory assumes that motion along the reaction path may be treated classically and has no normal components. The actual reaction path may not cross the minimum saddle point, this increases the effective activation energy. This can be seen in the contours above where vibrations of the product indicate the collision happened in an excited vibrational state; not at the minimum of the surface orthogonal to the reaction pathway on the energy surface. Applying this to a physical experiment, conditions required for reaction may be harsher than expected to compensate for the higher than predicted activation energy.
It is assumed that systems that have crossed the transition state potential may not recross it and reform the reactants. This is shown to be not true by reaction 4 where the reaction pathway is reversed after the transition state potential. In an experiment this effect may cause lower than expected yields of product.
Good experiments and explanation of TST. One more thing, what did you notice about the energy of case 4 compared to other reactive ones? --Sw2711 (talk) 11:17, 4 June 2018 (BST)
Ex2
PES inspection
F + H2 and H + HF are exothermic and endothermic respectively. Relating this to bond strength, the F-H bond is far stronger than the H-H bond and therefore its formation from F + H2 will release a substantial amount of energy. The potential energy surface shows the huge difference between the activation energies of the two reactions in which a F-H bond is either formed or broken.
Good explanation. But I need to see the PES figure and how this surface shows the huge difference between the activation energy? Where is the activation energy on the PES?--Sw2711 (talk) 11:20, 4 June 2018 (BST)
The transition state was found to occur when the separation between F and H was 1.8137 and H and H 0.74. The structure of the transition state far more strongly resembles that of the H2 molecule where the distance between the atoms is essentially unchanged from the molecule. Hammond's postulate states that if two states along a reaction pathway have similar energies, the interconversion of structures will require only a small reorganisation. This further highlights the difference between the activation energies of the two reactions and allows for differentiating of the exothermic or endothermic character of these two reactions.
Good, same here. I need to see some evidence. --Sw2711 (talk) 11:20, 4 June 2018 (BST)
The activation energy of the F + H2 reaction is 0.129 kcalmol-1 and for the H + HF is 30.0 kcalmol-1. These values were found by setting initial conditions either side of the transition state saddle point on the minimal energy path and taking the difference in energies.
Also here. I need some evidence. How did you find those figures. --Sw2711 (talk) 11:20, 4 June 2018 (BST)
Reaction Dynamics
In the case of the strongly exothermic reaction F + H2, energy is released. This is observed as vibrational excitation of the products as shown by contour plots of the reaction path. Here the vibrational energy is seen as a displacement between parallel contours. Some of the energy is also retained by the lone H atom which experiences a change in translational energy; this is better visualised by the change in 'frequency' of the path. An increased separation between periods of the vibration means the molecule as displaced a greater distance. Experimentally this could be proven by observing a temperature increase. I can see you have explained the change in vibrational and translational energy. But I think you haven't really linked to why or how by observing a temperature increase means anything? What energy are you capturing by measuring the temperature?--Sw2711 (talk) 11:27, 4 June 2018 (BST)
This can be applied to the study of the reaction at different vibrational momenta of the H2 molecule.
Same for this set of experiments. I think what you trying to prove is that a loss of vibrational energy means an increase in translational energy. Therefore, the energy is conversed. However, like case 2, you have potential energy taking place to have the overall energy conversed. I think if I were you, I will try to explain like: Etot = PE+KE; KE = Translational E + Vibrational E; Etot is conserved. So increasing one factor means a decrease in some other factors. Here are a few examples below: --Sw2711 (talk) 11:44, 4 June 2018 (BST)
| pHH | Contour | Description |
|---|---|---|
| -3 |  |
Unreactive, loss of vibrational energy by H2, increased translational speed |
| -2 |  |
Reactive, increased vibrational energy as a result of reaction energy release, translational speed unaffected |
| -1 |  |
Unreactive, very little energy transfer |
| 0 |  |
Reactive but the atoms spend a long time in the transition state area which is recrossed several times. Products have high vibrational energy |
| 1 |  |
Reactive but again a long time spent in transition state. H2 almost returns to initial state before finally forming products. |
| 2 |  |
Very fast reaction which forms vibrationally excited product. Translation speed largely unaffected. |
| 3 |  |
Unreactive, transition state is recrossed to give H2 with less vibrational but far more translational energy |
H + FH
Here the H atom needs to have huge momentum to overcome the activation energy barrier. However relatively tiny changes in vibrational energy of FH would change the outcome of the reaction. Looking at animations, it seems that approach of the H at the correct time is important. When the speed of the H approach and FH vibration matches the reaction pathway will generally be successful. Polyani's empirical rules generally state that vibrational energy is more efficient at promoting a chemical reaction. These experiments seem to prove that rule.
Good. Have you tried low momentum H but high vibrational energy of FH? Does that work? Also, why do you think vibrational energy is more efficient in this case?--Sw2711 (talk) 11:44, 4 June 2018 (BST)
Distances F-H: 0.92, H-H: 2
| pHH | pHH | Reactivity |
|---|---|---|
| -8 | 0 | Reactive |
| -7.5 | -0.7 | Unreactive |
| -7.5 | 0 | Unreactive |
| -15 | 0 | Unreactive |
| -15 | -0.5 | Reactive |
| -10 | -0.5 | Reactive |
| -8 | -0.5 | Unreactive |
The effect of vibrational energy of the F-H bond is shown above. In cases of high momentum of H, the increased vibrational energy can promote a reaction. When lowering the momentum of H, a pathway which was reactive when F-H had no momentum became unreactive. Further, when increasing total momentum of the system a pathway which was reactive when all the energy was transitional, does not become reactive. It seems that vibrational energy of the molecule is far more influential when the incoming species is of high momentum. A pathway which does not have enough total energy to overcome the potential energy barrier will not react however much the vibrational energy is increased at the cost of translation.
As shown by the study of both the forward and reverse, different distribution of energies between vibrational and translational modes produces wildly different outcomes. The study of different F + H2 reactions shows that it is somewhat unpredictable. The contrast between the forward and reverse reactions is the relative position of the transition state on the reaction pathway. For H + FH, the lone H has to have huge momentum in order for a reaction to proceed. Reactions which do work produce molecules of huge vibrational motion but slow displacement.
Good analysis based on your results. --Sw2711 (talk) 11:45, 4 June 2018 (BST)