Mrd:dp2615
Introduction
Linking the potential energy, the transition state and the reaction path
Chemical reactions can be explored by examination of the motion of reactants and products relative to their potential energy assuming the atoms involved in these reactions are obeying classical mechanics. The main aspect of the collision being observed is the energy barrier that leads to the transition state, along with the possibility of crossing more than one barrier for a reactive pathway.
Even in the analysis of the simplest system possible, i.e. an atom-diatomic collision reaction, the potential energy is a function of the three internuclear distances between the atoms, however, this function is hard to visualize hence calculations are made on the potential energy surface which is a function of only two internuclear distances, the distance between the atom and the closest atom of the diatomic and the bond length of the diatomic. In this triatomic collision, the atom will form a new diatomic with one of the atoms of the original diatomic and the other atom then leaves as a separate atom. This "collinear" configuration of atoms simplifies the potential energy into a contour map made up of equipotential lines and can be visualised in 3D in the MatLab software as a surface plot thus allowing the visualisation of reactions paths.
Reactive pathways that run along the energy plot are calculated to all go through this "mountain pass" called the transition state. Mathematically, the height of the energy barrier corresponds to the maximum energy point along the minimum energy route, which is also the lowest local maximum of the entire surface plot thus can be identified as the saddle point of the plot. These reactive paths are observed to both proceed smoothly across the surface or to take alternative routes with varying vibration frequency both in the escalation from the reactants to the transition state and in the fall to the products from there.
The minimum reaction path runs along straight from the reactants via the transition state to the products. Of course, in non-ideal reality statistics allows for many reaction paths which follow the region close to the saddle point, i.e. the transition state region. This can be rationalised as in most cases more kinetic energy than the one needed to just about reach the barrier is given and the reaction can take a slightly higher energy path. Also many systems involve atoms which are also subject to influencing external or internal forces. In the case of the hydrogen only system and especially the fluorine-hydrogen system, the energy barrier is low enough to favour atom transfer between the two components. Reactive trajectories are calculated by Matlab as position of the atoms against time, many examples as well as other relevant plots will be shown across this report.
H + H2 system
Dynamics of the transition state region
The transition state of a potential energy surface can be mathematically identified by its total gradient which is equal to zero. Its first derivative with respect to both variables, i.e. the internuclear distance of H2 and the distance between the diatomic and the third atom, must be equal to zero thus the gradient of the potential is zero. Its second derivative is with respect to a reaction parameter that is the linear combination of the coordinates that creates two diagonals across the potential energy surface. This derivative in this newly defined coordinate system can be either positive, meaning all the atoms are coming closer to each other or distancing each other thus the energy is raised and no reaction happens, or negative where the distances change as reaction coordinates of the minimum energy pathway. Therefore, we define the transition state as the saddle point of the potential energy surface i.e. the lowest local maximum that corresponds to the coordinates along the minimum energy pathway that allow the reaction, in contrast to any other local minimum that doesn't satisfy the condition of the second derivative as for the transition state due to the different curvature of its location.
Estimating the transition state
For the symmetrical system being analysed, the transition state has equal internuclear distances, i.e. r1=r2. Locating the transition state via MatLab consisted in keeping both momenta equal to zero in order to locate the precise position with gradient equal to zero ("mountain pass") since at that exact point the atoms will stay completely still unless a force is applied on them to give them enough energy to start their descent of potential energy.
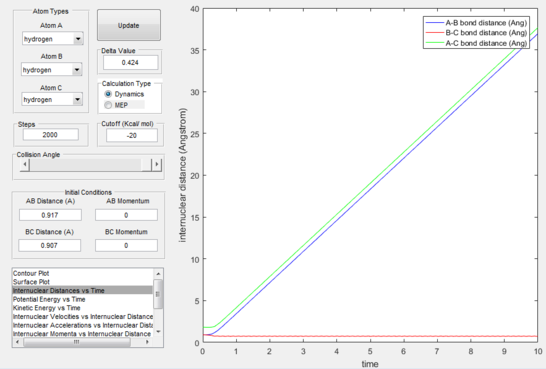
After trial and error calculations were ran, the best estimated values for the internuclear distances was found to be 0.907 Å. The distances are the same because we are working in a symmetric system. Having the momenta equal to zero showed in a plot of "Internuclear distance vs Time" (figure 1) that all atoms are at a standstill:

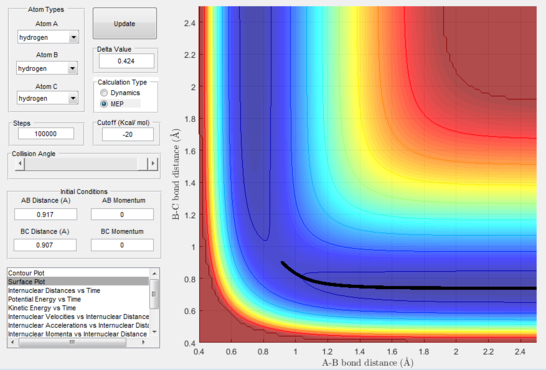
The exact position of the transition state can be seen relative to the surface plot in figure 2, where it can be clearly identified as the saddle point; and also in figure 3 where the contour plot displays both the "bottleneck" transition state region and the transition state itself.
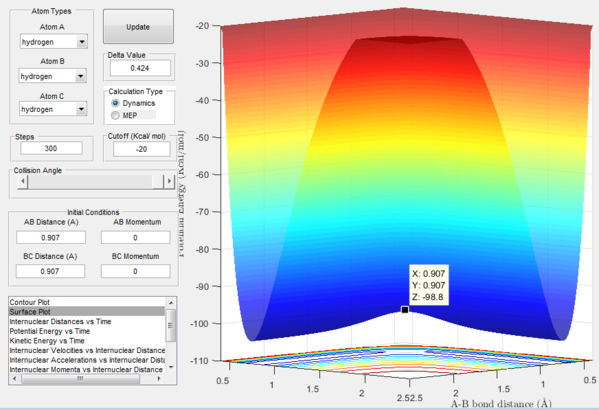
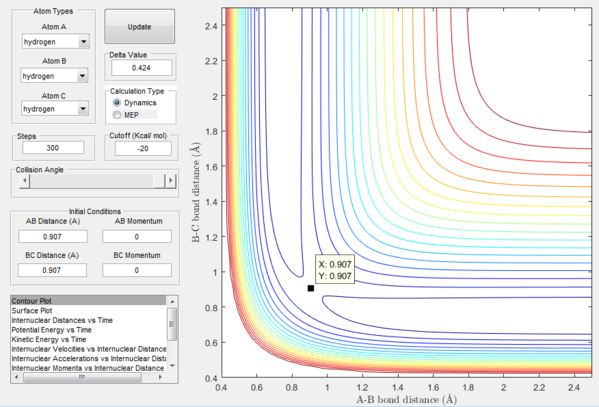
Starting from the transition state with no momentum the atoms will not move away from each other nor will they move closer together. This can be rationalised by thinking of the force acting on these atoms which is equal to the derivative of potential energy with respect to distance which in this case is equal to zero, thus without perturbation the system will stay still.
It is observed that our estimate of the transition state is not completely exact as a minor wave motion is observed for the internuclear distances with time (figure 1) whereas with the precise coordinates two straight lines would be shown on the plot demonstrating lack of movement on behalf of the atoms.
Calculating the reaction path and trajectories from r1 = rts+δ, r2 = rts
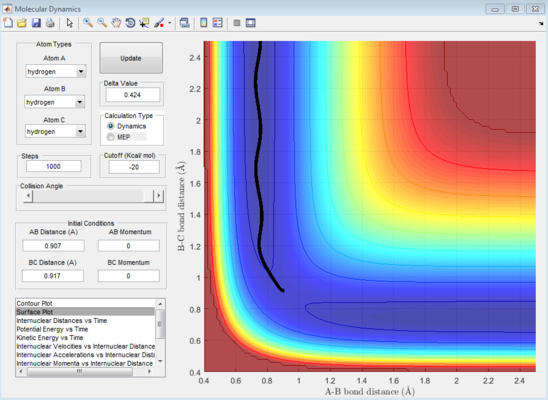
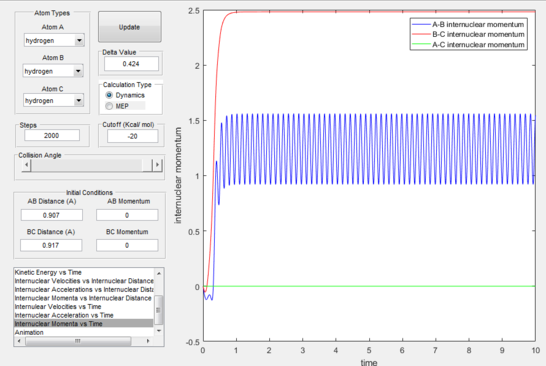
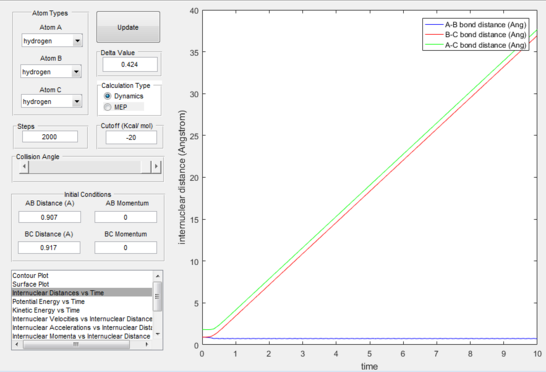
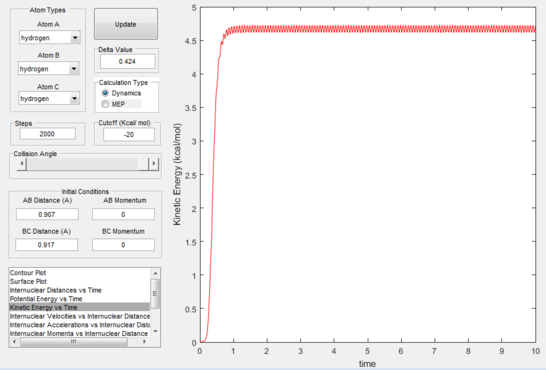
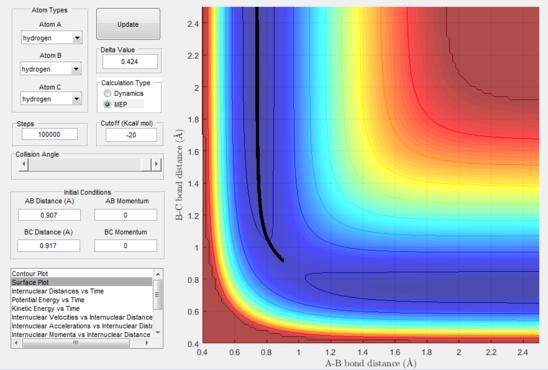
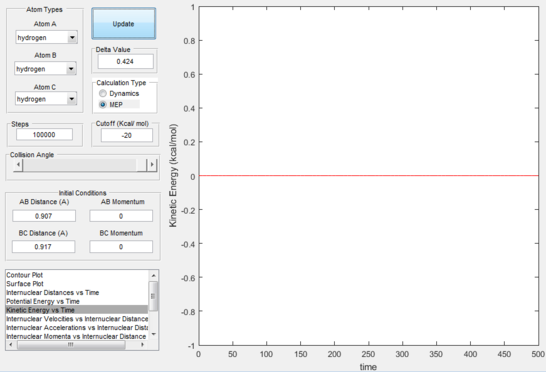
The reaction path (mep) corresponds to the path that follows the trajectory with the slowest motion and is the minimum energy pathway. Having set both momenta to zero and having displaced the internuclear distance of the diatomic by +0.01, the mep was calculated first using the Dynamics setting and then using the MEP setting. The first result shows a wavy black line crossing the potential energy surface plot diagonally corresponding to the atoms vibrating while moving across the energy path, whereas the second setting yielded a straight black line along the same path as the first. Even though MEP was run with many more steps that the other setting, the first result portrays reality as the oscillation of the curve takes into account the destabilisation of the system due to vibrations of the atoms that cause a wavy motion. MEP non-realistically considers atoms moving infinitesimally slow and so as not vibrating, with their velocity being set back to zero every step that is taken. This results in a kinetic energy of zero as observed in figure 9 compared to the calculated real one for Dynamics in figure 7, as it is a false representation of physical motion.
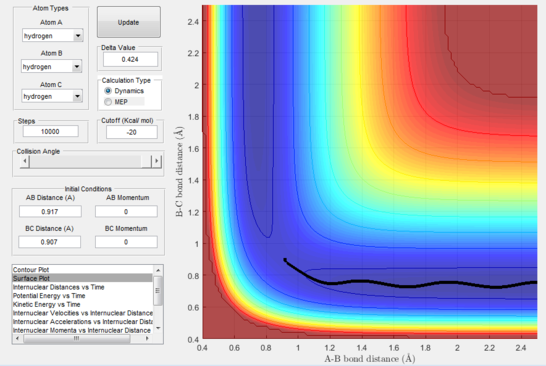

On reversing the conditions of displacing the internuclear distances, the reaction paths shown were reversed as were the internuclear distances and momenta over time, shown in figures 11-12 only for the Dynamics setting considering the same calculations for MEP would have been meaningless. This proves that even the slightest displacement of the transition state position will cause the atoms to descend the potential energy surface to revert either to reactants or products depending which side of the transition state they are pushed towards.
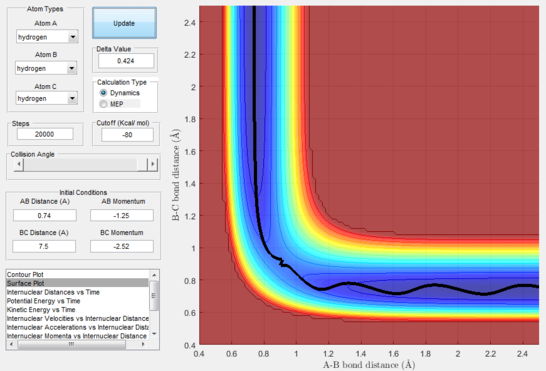
Having found arbitrarily at time=2s the distances at r1=0.74 Å and r2=7.5 Å, and after having averaged the momenta for both bodies and inverted their signs resulting in p1=1.25 and p2=2.49, a calculation was run that yielded this trajectory (figure 14) demonstrating that starting from a position where the products have already been formed, and giving them the reverse kinetic energy of the reactants which formed them, these will go back through the transition state to reform the reactants.
Reactivity of trajectories
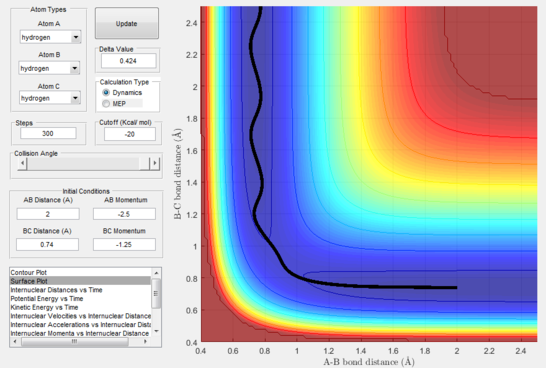
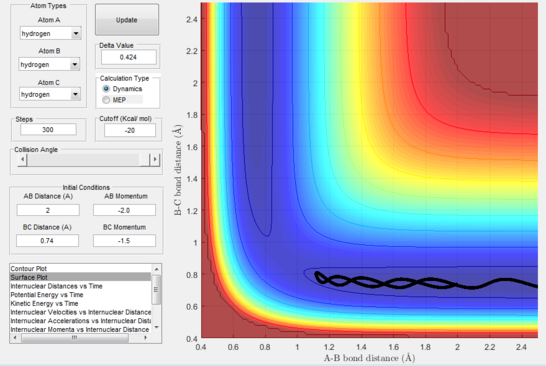
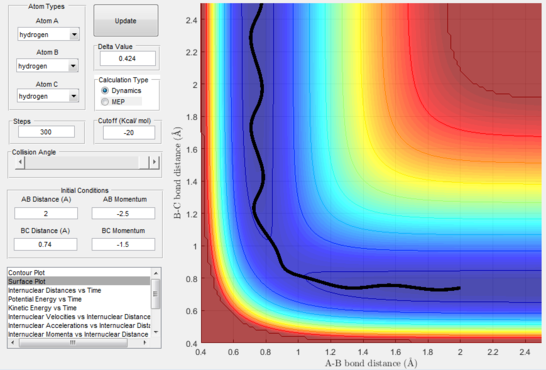
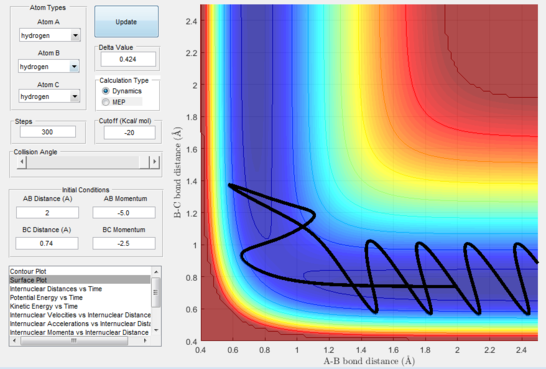
To validate the hypothesis that starting from the positions r1=0.74 Å and r2=2 Å and given any momenta higher than that averaged to be p1=1.25 and p2=2.49 then the trajectory would definitely be reactive, some calculations were run using a variety of combinations of momenta and the behaviour of the atoms were observed in the "Animations" setting. A reactive trajectory will start from reactants, pass through the energy barrier and finish across to the products, whereas an unreactive trajectory will either pass the barrier and then revert back to reactants or not pass the barrier at all. The momenta used are listed in the table below.
| p1 | p2 | Reactivity | Figure |
|---|---|---|---|
| -1.25 | -2.5 | reactive | 15 |
| -1.5 | -2.0 | unreactive | 16 |
| -1.5 | -2.5 | reactive | 17 |
| -2.5 | -5.0 | unreactive | 18 |
| -2.5 | -5.2 | reactive | 19 |
Description of the mode of reactivity or unreactivity considering the atoms A-B-C nomenclature where A is the separate hydrogen atom and BC the hydrogen diatomic:
- Figure 15 : A approaches the diatomic and C leaves.
- Figure 16 : A approaches the diatomic until the momentum reverses.
- Figure 17 : A approaches the diatomic and C leaves.
- Figure 18 : A quickly approaches the diatomic and forms a transient new diatomic before C swings back to reform the original diatomic while A slowly leaves; momenta are very variable and unsteady in this trajectory; this is called barrier recrossing.
- Figure 19 : A quickly approaches the diatomic and forms a new diatomic, C swings back shortly but then the transitions state is reached and the new molecule formed and C leaves.
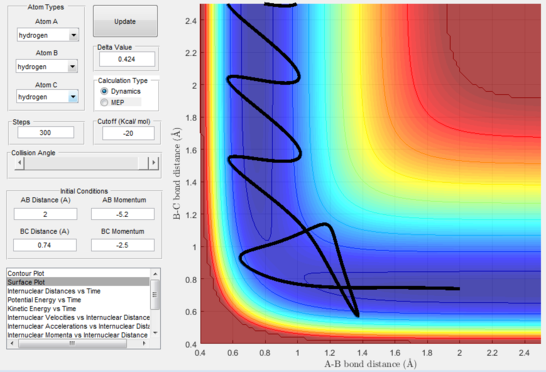
This disproves our hypothesis in that different momenta, even if in the correct ratio, can sometimes lead to unreactive pathways. This can be rationalised as the atoms necessitate particular modes and velocities of motion in order to successfully descend from the transition state to the products without bouncing back to the reactants.
Transition State theory
Transition state theory is a relevant and wide used concept across many areas of chemistry. It is mainly based on four assumptions:
- On the potential energy surface, the atomic motion can be described as obeying classical mechanics.
(What are we missing by using Classical Mechanics? Je714 (talk) 16:30, 8 May 2017 (BST))
- The transition state is contained in a "bottleneck" transition state region.
- Any reaction path that passes the energy barrier to reach the transition state must react to form the products and it cannot bounce back to reform the reactants.
- At the transition state, dynamic coupling will not take place between atomic motion and other degrees of freedom.
However, many studies have been carried out on the subject to successfully disprove this theory. Their main focus was proving that reaction paths which cross the saddle point but then bounce back towards the reactants before crossing the transition state indefinitely to form the products do exist, even if at a higher energy cost hence a slower reaction rate. An example of this theory being broken via barrier recrossing is portrayed in figure 18.
(With these limitations in mind, would you expect TST to over or under estimate rates? Je714 (talk) 16:30, 8 May 2017 (BST))
F + H2 system
Potential energy surface inspection
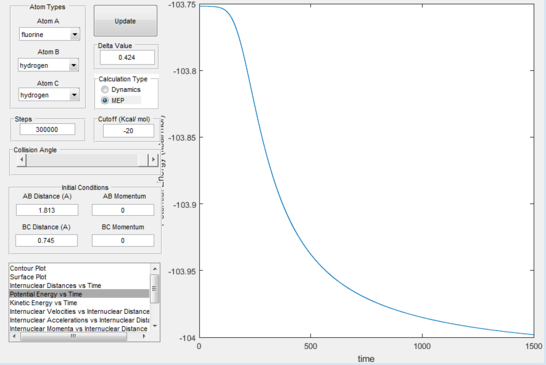
This triatomic collision is an exothermic reaction due to the high reactivity of both the fluorine atom and the hydrogen molecule. Therefore, its reversible reaction is an endothermic one. The transition state of an exoergic reaction is almost invisible with an extremely low energy barrier (figure 21) and for Hammond's postulate it is also very close to the reactants. After the saddle point, the potential energy is observed to drop sharply almost immediately, this is called and attractive potential energy surface. Considering this is a reversible reaction, the opposite reaction yields a repulsive potential energy surface. The kinetic energy to reach the transition state is immediately transformed into vibrational motion for the products.
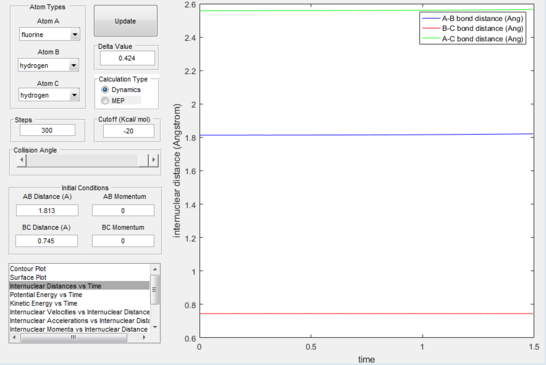
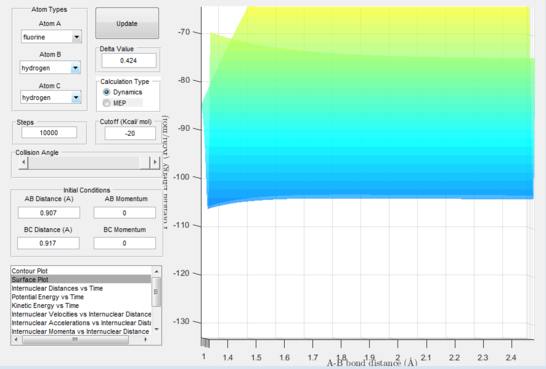

Because of the small size of the transition state, many calculations and a lot of graph handling was necessary in order to report the activation energy for both directions of the reversible reaction. By subtraction of values from the "kinetic energy vs time" plots of both directions of reactions, the values for the activation energies were found to be: exothermic reaction=0.25 Kcal/mol; endothermic reaction=30.2 Kcal/mol.

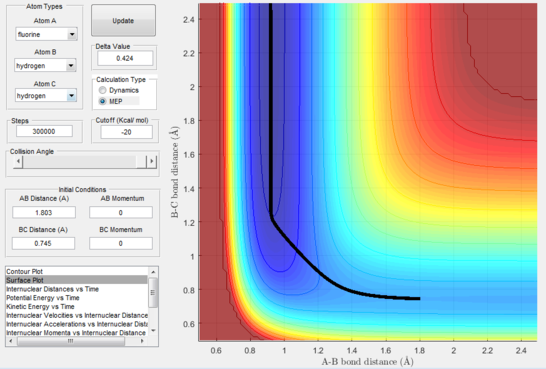
Reaction dynamics
A set of initial conditions was chosen where the initial distances correspond to the position of the reactants on the visible potential energy surface, and the momenta were chosen taking into account the mass difference between the atoms seen as fluorine is 19 times heavier than hydrogen and the atoms must move together in order for it to be a reaction path. A good ratio of momenta was found to be roughly 1:13.
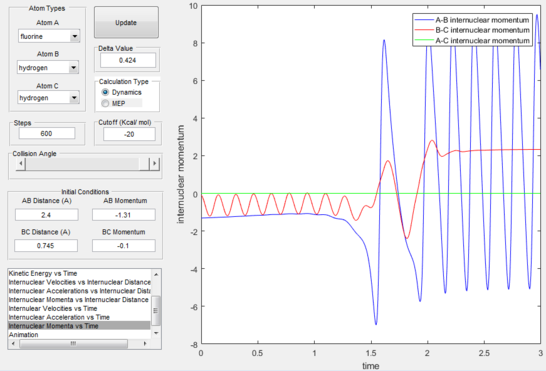
After the initial momenta makes the atom gain kinetic translational energy, as soon as the transition state is passed the energy will transform into vibrational energy of the products, in this case with a low frequency but large oscillation. This can be confirmed experimentally via vibrational spectroscopic methods such as IR spectroscopy and calorimetry.
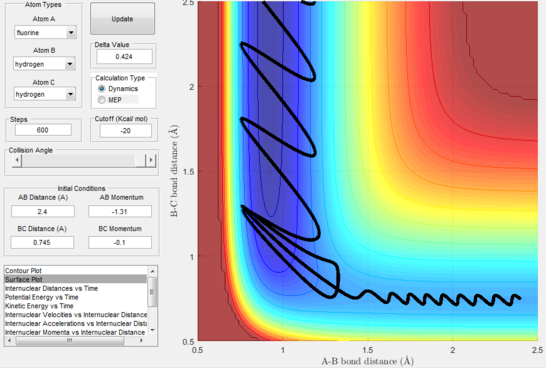
Next, a calculation was set up starting from the reactants at the bottom of the well rHH = 0.74 and with a momentum pFH = -0.5 and the momentum of pHH was varied in the range -3 to 3. The observed behaviour seen in figures 28-40 shows that a necessary momentum in either direction is needed in order to make the atoms gain enough energy to cross the energy barrier even if through barrier recrossing or juggling of the central atom. It is good to note that for figure 41, with momentum at 0.1, even though the system is very cold it is still so reactive that the reaction will go to completion.
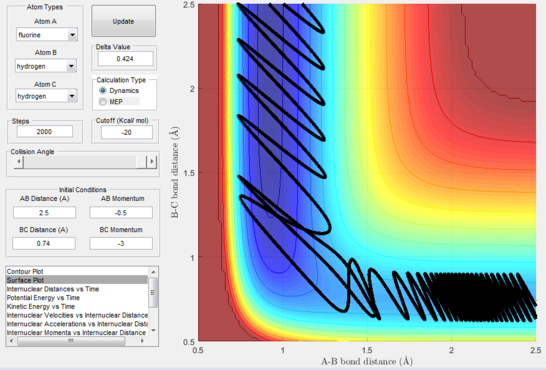
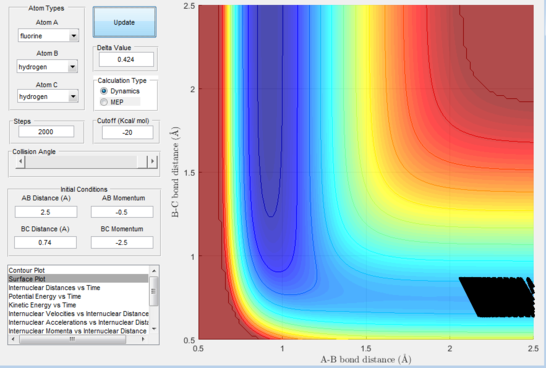
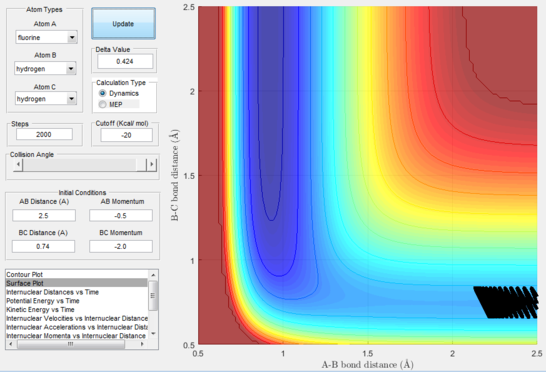
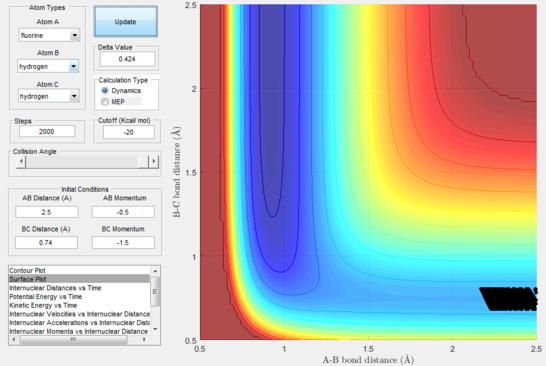
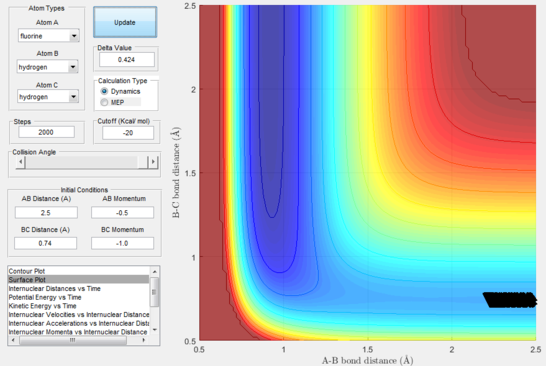

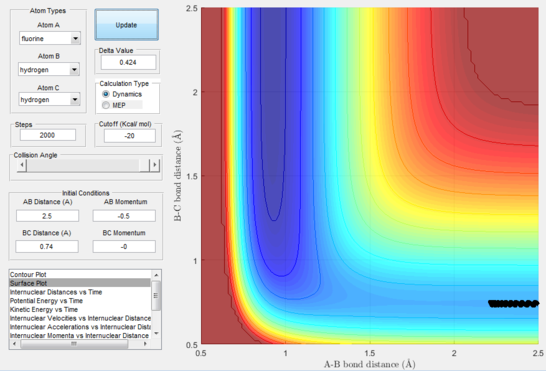
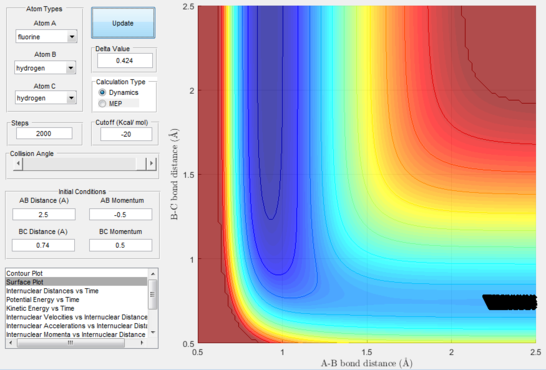
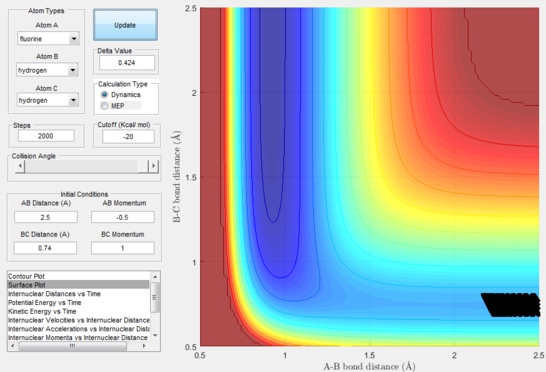
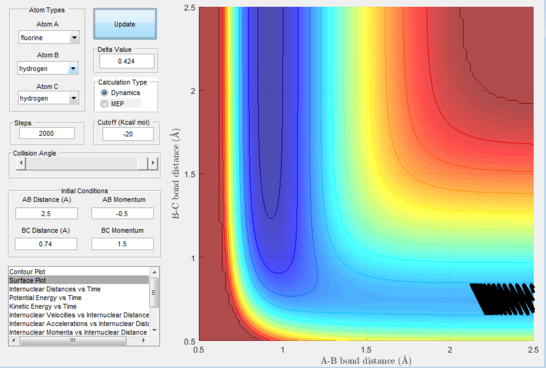
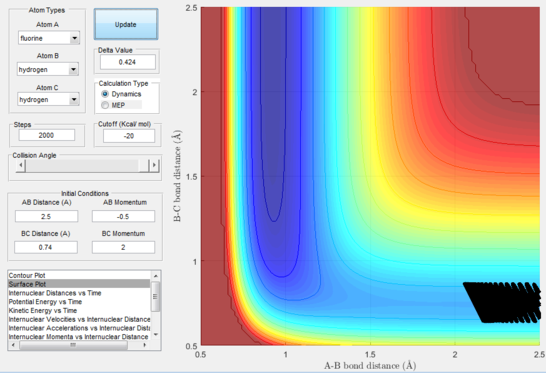
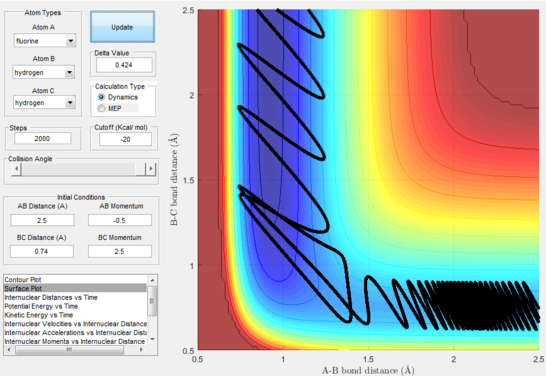


Polanyi's empirical rules state that vibrational energy will favour the late-barrier reaction compared to the translational energy which in fact promotes early-transition state reactions. These rules were validated focusing on the backward endothermic reaction via various trial and error calculations where the momentum of the hydrogen fluoride diatomic was kept low, thus decreasing vibrational energy, and the momentum of the separate hydrogen atom was kept higher, thus varying translational energies. It must be noted that finding reaction paths is very hard due to there being a statistically small number under these conditions, but their efficiency was proven to be strongly dependent on the distribution of the energy modes.
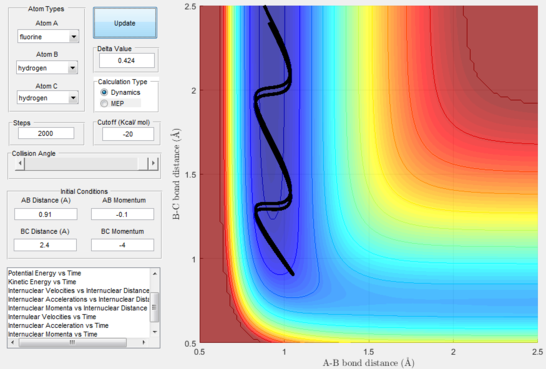
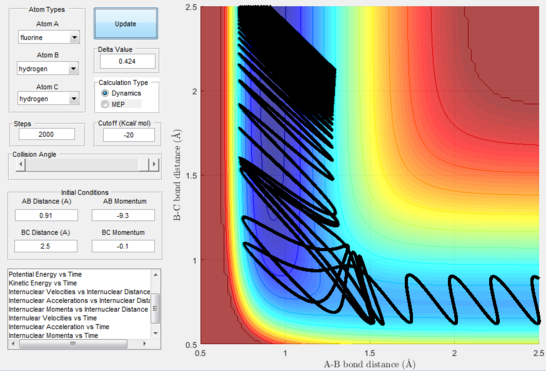
(Good use of examples to discuss Polanyi's rules. GJ. Je714 (talk) 11:45, 9 May 2017 (BST))
References
[1] Atkins P., De Paula J., Atkins’ Physical Chemistry, 2006, 8th ed., Oxford University Press, ch.25,27.
[2] Levine I. N. , Physical Chemistry, 2009, McGraw-Hill, ch.23.
[3] Silbey R. J., Alberty R. A., Bawendi M. G. , Physical Chemistry, 2005, 4th ed., John Wiley & Sons, ch.19.
[4] Levine R. D. , Molecular Reaction Dynamics, 2005, Cambridge University Press, ch.5.
[5] Pineda J.R.E.T, Schwartz S.D, Protein dynamics and catalysis:the problems of transition state theory and the subtlety of dynamic control, Philos Trans R Soc Lond B Biol Sci. 2006 Aug 29; 361(1472): 1433–1438.
