Molecular Modelling Report By Sarah Patterson
NH3 Molecule
Rotatable 3d jmol image of the optimised ammonia structure
Ammonia Molecule |
The optimisation file is linked to here
Key Information About The Calculation
The calculation method: RB3LYP [This is the Becke 3‐Parameter method for calculating the energy caused by the overlapping of orbitals and the Lee-Yang-Parr approach of accounting for correlation i.e. it determines the approximations used when solving the Schrödinger equation]
The basis set: 6-31G(d,p)
The final energy E(RB3LYP) is -56.55776873 a.u.
The RMS gradient: 0.00019919 a.u.
The point group of the molecule: C3v
The optimised bond length of N-H: 1.01798 Å
The optimised bond angle of H-N-H: 105.741°
Item table showing the final set of forces and displacements
| Item | Value | Threshold | Converged? |
|---|---|---|---|
| Maximum Force | 0.000004 | 0.000450 | Yes |
| RMS Force | 0.000004 | 0.000300 | Yes |
| Maximum Displacement | 0.000072 | 0.001800 | Yes |
| RMS Displacement | 0.000035 | 0.001200 | Yes |
Predicted change in Energy=-5.986271D-10 Optimization completed.
Analysis of the vibrations of the ammonia molecule
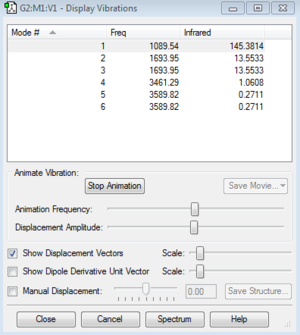
Infrared spectroscopy involves the absorption of radiation in the infrared region of the electromagnetic spectrum which leads to vibrations of molecules. In order for the vibration to be observed in the IR spectra it must be accompanied by a change in dipole, and the frequency at which this vibration occurs is proportional to the energy of the vibrating bonds.
Answers to Questions
- For ammonia you would expect to see 6 vibrational modes according to the 3N-6 rule.
- Modes 5 and 6, as well as modes 2 and 3 are degenerate, hence have the same energy.
- The "bending" vibrations are modes 1,2 and 3.
- The "bond stretches" are modes 4,5 and 6.
- Mode 4 is highly symmetric.
- Mode 1 is known as the umberella mode.
- For ammonia you would expect to see 2 bands in the experimental spectrum of gaseous ammonia. You would expect to see mode 1. You would see a single band for modes 2 and 3 since they are degenerate. Modes 4,5,6 are of low intensity hence are not observed in the experimental spectrum of ammonia.
Analysis of the charges in the ammonia molecule
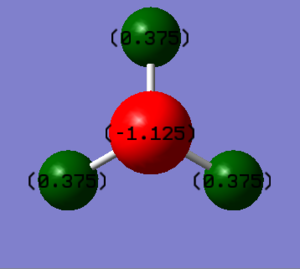
The charge on the nitrogen atom is -1.125 a.u., the charge on the hydrogen atom is +0.375 a.u. This is as expected the more electronegative nitrogen draws the electron density towards itself, thus is negative. As the electron density is drawn away from the hydrogens they are left with a positive charge. Furthermore, addition of the charges leads to a neutral molecule which is in accordance with what is experimentally observed. Overall, the charges predicted by Gaussian are as expected.
N2 Molecule
Rotatable 3d jmol image of the optimised nitrogen molecule
Nitrogen molecule |
The optimisation file is linked to here
Key Information About The Calculation
The calculation method: RB3LYP
The basis set: 6-31G(d,p)
The final energy E(RB3LYP) is -109.52412868 a.u.
The RMS gradient: 0.00000060 a.u.
The point group of the molecule: D∞h
The optimised bond length of N-N: 1.10550 Å
Item table showing the final set of forces and displacements
| Item | Value | Threshold | Converged? |
|---|---|---|---|
| Maximum Force | 0.000001 | 0.000450 | Yes |
| RMS Force | 0.000001 | 0.000300 | Yes |
| Maximum Displacement | 0.000000 | 0.001800 | Yes |
| RMS Displacement | 0.000000 | 0.001200 | Yes |
Predicted change in Energy=-3.400999D-13 Optimization completed.
Analysis of the vibrations of the nitrogen molecule
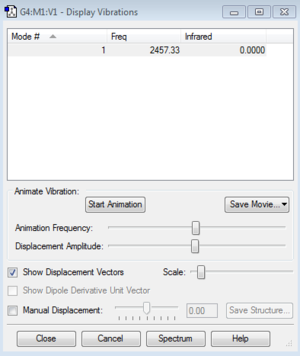
The nitrogen molecule is linear and thus the expected number of vibrational modes should be 1 as predicted by 3N-5. However, the prerequisite for the vibration to be observed in the infrared spectra is that it must be accompanied by a change in dipole. The nitrogen molecule is a homodiatomic molecule hence there is an even distribution of electrons across the molecule and there is no change in dipole upon vibration therefore no peak is observed in the spectra. This can be seen by Gaussian's "Display Vibrations", although there is a vibration at 2457.33 cm-¹ the intensity of this infrared peak is zero. It can be confirmed that there are no negative frequencies.
H2 Molecule
Rotatable 3d jmol image of the optimised hydrogen molecule
Hydrogen Molecule |
The optimisation file is linked to here
Key Information About The Calculation
The calculation method: RB3LYP
The basis set: 6-31G(d,p)
The final energy E(RB3LYP) is -1.17853935 a.u.
The RMS gradient: 0.00005224 a.u.
The point group of the molecule: D∞h
The optimised bond length of H-H: 0.74292 Å
Item table showing the final set of forces and displacements
| Item | Value | Threshold | Converged? |
|---|---|---|---|
| Maximum Force | 0.000090 | 0.000450 | Yes |
| RMS Force | 0.000090 | 0.000300 | Yes |
| Maximum Displacement | 0.000119 | 0.001800 | Yes |
| RMS Displacement | 0.000168 | 0.001200 | Yes |
Predicted change in Energy=-1.077361D-08
Optimization completed.
Analysis of the vibrations of the hydrogen molecule

The H2 molecule is linear and thus the expected number of vibrational modes should be 1 as predicted by 3N-5. However, it is a homodinuclear molecule with an even distribution of electrons hence there is no change in dipole associated with the vibrations thus no peak in the spectra. Gaussian's "Display Window" also shows that although there is an absorption at 4463.87 cm-1 the intensity of the infrared peak is zero. It can be confirmed that there are no negative frequencies.
The Haber-Bosch process
N2 + 3H2 -> 2NH3
- E(NH3)= -56.55776873 a.u.
- 2*E(NH3)= -113.11553746 a.u.
- E(N2)= -109.52412868 a.u.
- E(H2)= -1.17853935 a.u.
- 3*E(H2)= -3.53561805 a.u.
- ΔE=2*E(NH3)-[E(N2)+3*E(H2)]= -0.05579073 a.u. = -146.48 kJ/mol
The ammonia product is more stable than the gaseous reactants. As the reaction is exothermic, energy is released upon bond formation thus there is an overall decrease in energy and the product is at a lower energy than the reactants. Max Appl et al. report an energy change of -92.4 kJ/mol, this shows there are imperfections associated with the calculation carried out by Gaussview. One of the reasons for this imperfection is that Gaussians calculates the energy of a single molecule, whereas in reality intermolecular interactions between molecules will have an effect on the final energy.
Analysis of Methane
Rotatable 3d jmol image of the optimised methane molecule
Methane Molecule |
The optimisation file is linked to here
Key Information About The Calculation
The calculation method: RB3LYP
The basis set: 6-31G(d,p)
The final energy E(RB3LYP) is -40.52401404 a.u.
The RMS gradient: 0.00003263 a.u.
The point group of the molecule: TD
The optimised bond length of C-H: 1.09197 Å
The optimised bond angle of H-C-H: 109.471°
Item table showing the final set of forces and displacements
| Item | Value | Threshold | Converged? |
|---|---|---|---|
| Maximum Force | 0.000063 | 0.000450 | Yes |
| RMS Force | 0.000034 | 0.000300 | Yes |
| Maximum Displacement | 0.000179 | 0.001800 | Yes |
| RMS Displacement | 0.000095 | 0.001200 | Yes |
Predicted change in Energy=-2.256043D-08 Optimization completed.
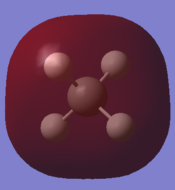
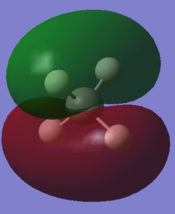
Analysis of the Molecular Orbitals for methane
| Carbon 1s orbital | C 2s orbital overlapping with H 1s | C 2px overlapping with H 1s | C 2py overlapping with H 1s | C 2pz overlapping with H 1s | antibonding orbital |
|---|---|---|---|---|---|
 |
 |
 |
 |
 |

|
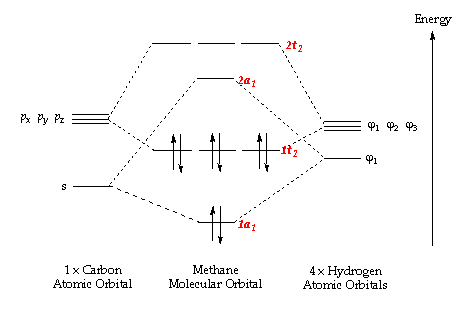
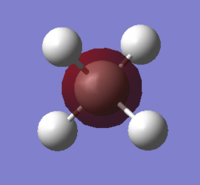
In order to form molecular orbitals, atomic orbitals need to be of similar energy, they must have the same symmetry and must have the correct phase and orientation for overlap. The carbon 1s orbital is too low in energy to interact with the hydrogen 1s orbitals hence the only contribution to its molecular orbital comes from the carbon 1s orbital. It has the lowest energy and is deep in energy with a value of around -10 a.u. It is a populated bonding molecular orbital. The carbon 2s orbital is lower in energy than the 2p orbitals as it is more penetrating and experiences more of the effective nuclear charge, thus the bonding molecular orbital arising from the overlap with the hydrogen 1s orbital is lower in energy than the molecular orbital arising from the overlap of the carbon 2p orbitals and the hydrogen 1s. The bonding overlap is more extensive in these molecular orbitals therefore there is an extension of the surface. The 2p orbitals of the carbon have been arbitrarily assigned the coordinates x, y and z. The three molecular orbitals arising from the overlap of the 2p orbitals with the hydrogen 1s orbitals all contain a nodal plane and are degenerate. While the shape of these bonding molecular orbitals are the same they have different orientations. All the bonding molecular orbitals formed are sigma bonds. Whereas all the bonding molecular orbitals are filled, the antibonding molecular orbitals are unfilled. Figure 1 and Gaussview both show that the antibonding orbitals are higher in energy. The antibonding orbital represented in the "Molecular Orbitals of Methane" is the LUMO. The sigma bond resulting from the overlap of carbon 2p and hydrogen 1s are the HOMO. Due to delocalisation of the electrons across the methane molecule the bond strengths and bond lengths will all be equal.
Comparing the molecular orbitals of methane with those of the nitrogen molecule shows that in nitrogen there are orthogonal p orbitals which overlap to form two π bonds which are anti-symmetric with respect to the rotation about the intermolecular axis in addition to the σ bond. In the methane all there are only σ bonds formed.
Analysis of the vibrations of the methane molecule

A frequency analysis of the molecule molecule shows there are 9 vibrational modes as predicted by 3N-6. Modes 1,2, and 3 are degenerate, as are modes 4 and 5. Furthermore, modes 7,8 and 9 are also degenerate. The highly symmetric shape of methane means that only two of the vibrational modes interact directly with infrared light. The vibrational modes 4,5 and 6 have an infrared intensity of 0 hence do not appear in the IR, they are not observed as they are not accompanied by a change in dipole. The two peaks observed are the ones resulting from vibrational modes 1,2 and 3 as well as vibrational modes 7,8 and 9.
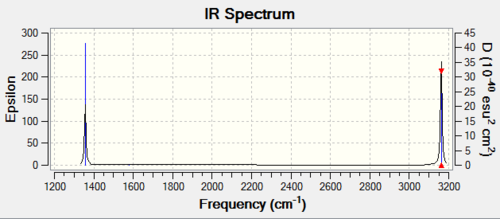
The vibrational modes 1,2 and 3 are bending vibrations. The vibrational modes 4, 5 and 6 do not involve a change in dipole. Vibrational modes 7 and 8 are asymmetric stretches. Vibrational mode 9 is equally a stretch.
Analysis of the charges in the methane molecule

The image above shows the charge distribution in methane. The carbon atom is more electronegative than hydrogen and draws electron density towards itself thus producing a negative charge of -0.930 a.u. for carbon and a positive charge of +0.233 a.u. for hydrogen. A comparison with ammonia shows carbon is less electronegative hence the difference in charge is smaller in methane and the carbon is less negative.
Independent Part
Rotatable 3d jmol image of the optimised cyclohexane chair structure
Cyclohexane Chair Conformation |
The optimisation file is linked to here
Key Information About The Calculation
The calculation method: RB3LYP
The basis set: 6-31G(d,p)
The final energy E(RB3LYP) is -235.89716502 a.u.
The RMS gradient: 0.00001387 a.u.
The point group of the molecule: D3d
The optimised bond length of C-H: 1.09959 Å
The optimised bond length of C-C: 1.53686 Å
The optimised bond angle of H-C-H: 106.437°
The optimised bond angle of C-C-C: 111.513°
Item table showing the final set of forces and displacements
| Item | Value | Threshold | Converged? |
|---|---|---|---|
| Maximum Force | 0.000043 | 0.000450 | Yes |
| RMS Force | 0.000008 | 0.000300 | Yes |
| Maximum Displacement | 0.000377 | 0.001800 | Yes |
| RMS Displacement | 0.000097 | 0.001200 | Yes |
Predicted change in Energy=-2.043330D-08 Optimization completed.
Rotatable 3d jmol image of the optimised cyclohexane boat structure
Cyclohexane Boat Conformation |
The optimisation file is linked to here
Key Information About The Calculation
The calculation method: RB3LYP
The basis set: 6-31G(d,p)
The final energy E(RB3LYP) is -235.87963201 a.u.
The RMS gradient: 0.00001387 a.u.
The point group of the molecule: D3d
The optimised bond length of C-H: 1.09583 Å
The optimised bond length of C-C: 1.54806 Å
Item table showing the final set of forces and displacements
| Item | Value | Threshold | Converged? |
|---|---|---|---|
| Maximum Force | 0.000044 | 0.000450 | Yes |
| RMS Force | 0.000007 | 0.000300 | Yes |
| Maximum Displacement | 0.003641 | 0.001800 | No |
| RMS Displacement | 0.000892 | 0.001200 | Yes |
Predicted change in Energy=-1.217408D-07
Comparison of the chair and boat structures of cyclohexane
Upon drawing the boat and chair conformations in Gaussian the position of the nuclei were chosen. The optimisation process finds the position of the nuclei that gives the lowest energy i.e. the equilibrium or lowest energy geometry. As the position of the nuclei is different for the chair or boat conformation then the lowest energy structure will be different for both structures. Gaussview moves towards the lowest energy structure. As this occurs the system passes along a Potential Energy Surface to find the closest local energy minima. It can be seen that the local energy minima was different for both starting structures as the final energies of the two structures are different.
| dE in a.u. | dE in kJ/mol | |
|---|---|---|
| Boat | 0.01753301 | 46.03291775 |
| Chair | 0 | 0 |
An energy difference of 46.03291775 kJ/mol is large for a conformational change. This can be rationalised by the boat conformation being much higher in energy than the chair conformation. This is because, although the boat conformation has perfect sp3 bond angles is suffers from torsional strain. The chair conformation is lower in energy as it does not suffer from angle strain nor torsional strain.
References
1 Max Appl "Ammonia" in Ullmann's Encyclopedia of Industrial Chemistry 2006 Wiley-VCH, Weinheim. doi:10.1002/14356007.a02_143.pub2
2 Molecular orbital diagram of methane by W. Locke and the ICSTM Department of Chemistry 1996-97 http://www.ch.ic.ac.uk/vchemlib/course/mo_theory/
