Mol rea dyn 01522737
Exercise 1ː H + H2 system
===On a potential energy surface diagram, how is the transition state mathematically defined? How can the transition state be identified, and how can it be distinguished from a local minimum of the potential energy surface?
=
The transition state is defined as the maximum on the minimum energy path that the gradient of the potential is zero, ∂V(ri)/∂ri=0, and the second derivative is negative. Its energy is the maximum in one direction of its configuration but minimum in other directions. This is correct - what does this mean for the second derivative? Bear in mind you can take a derivative not only in one dimension... Fdp18 (talk) 16:40, 24 May 2020 (BST)
Transition states are saddle points on the potential energy surface plot where the gradients vanish. At this point, the slopes in orthogonal directions are all zero.
Considering these two orthogonal internal degrees of freedom in which the coordinates are r1 + r2 and r1 - r2, at the saddle point, ∂V/∂(r1 - r2)=0, ∂^2V/∂(r1 - r2)^2<0, ∂V/∂(r1 + r2)=0, ∂^2V/∂(r1 + r2)^2>0.
For both local minima and transition state, ∂V(r1)/∂r1 ∂V(r2)/∂r2=0. At local minima, ∂V^2(r1)/∂r1^2 >0 and ∂V^2(r2)/∂r2^2 >0. At the transition state, ∂V^2(r1)/∂r1^2 >0 but ∂V^2(r2)/∂r2^2 <0. This is because at this saddle point, the surface curves up in the r1 direction and curves down in the r2 direction but for local minima, the curvature in both directions would be positive. This part is technically correct, and you write many right things. However, it is very convoluted and difficult to follow. Some parts are repeated. For future reports, think about how you want to structure your paragraphs before you start writing. Fdp18 (talk) 16:43, 24 May 2020 (BST)
===Report your best estimate of the transition state position (rts) and explain your reasoning illustrating it with a “Internuclear Distances vs Time” plot or a relevant trajectory.
=
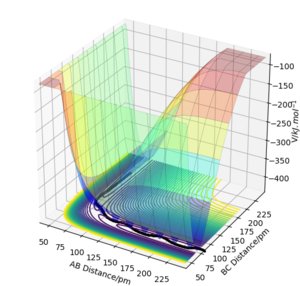
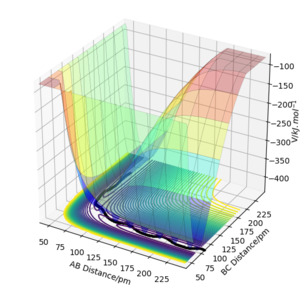
The transition state is at rts = 90.78 pm. At this stage, the forces along both AB and BC are nearly zero and these three atoms remain unmoved which means that they move neither towards the reactants nor the products.
The transition state is correct, and you credibly demonstrated that the distance you give does correspond to the transition state. However, this is not enough. I have no confirmation that you actually arrived at this value by yourself rather than taking it from someone else. Think about it from the perspective of a synthetic lab - you just gave me a few grams of the final product without any report of how you prepared it, so you could have just bought it somewhere. Please keep this in mind for future reports - show us what you did, because we will and want to reward you for it! Fdp18 (talk) 16:50, 24 May 2020 (BST)
There is another reason to provide all the steps - your reader needs to be able to reproduce your results. This is why in a scientific paper, you will not only find the results, but also an experimental section. Both are important. Fdp18 (talk) 16:51, 24 May 2020 (BST)
The other Distance vs Time plot shows that when the values of rAB and rBC are changed by one from the rts, the internuclear distance would not be constant since the forces between these atoms are not zero.


===Comment on how the mep and the trajectory you just calculated differ.
=
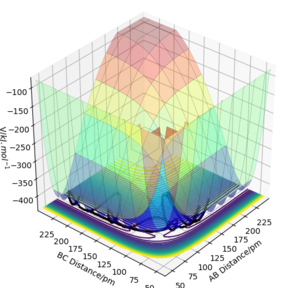
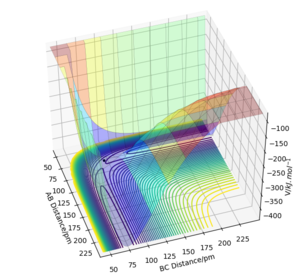
Since the momenta are reset to zero in each time step in the minimum energy reaction path, trajectory follows the valley floor moving towards H1+ H2-H3 but stops halfway without any vibrations of rBC.
When the inertia motion of atoms is taken into account, trajectory involves the vibration in rBC (the product BC has vibrational energy) as the inter-fragment distance rAB is increased.
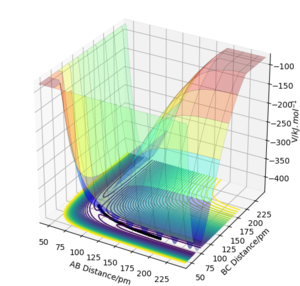
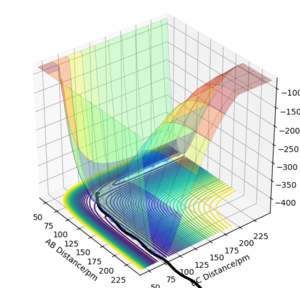
Look at the “Internuclear Distances vs Time” and “Momenta vs Time”. What would change if we used the initial conditions rAB = rts and rBC = rts+1 pm instead?
In Distances vs Time Plots, lines showing B-C distance and A-B distance would switch while the one showing A-C distance remains unchanged when the initial conditions rAB = rts, rBC = rts+δ are applied.
In Momenta vs Time Plots, lines showing B-C momentum and A-B momentum would switch when the initial conditions rAB = rts, rBC = rts+δ are applied.
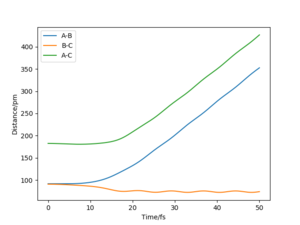


Setup a calculation where the initial positions correspond to the final positions of the trajectory you calculated above, the same final momenta values but with their signs reversed. What do you observe?
| Initial conditions | rAB(t)/pm | rBC(t)/pm | pAB(t)// g.mol-1.pm.fs-1 | pBC(t)// g.mol-1.pm.fs-1 |
|---|---|---|---|---|
| rAB = rts+δ, rBC = rts | 352.60252721091035 | 74.03790872851262 | 5.067876607063367 | 3.204587506250807 |
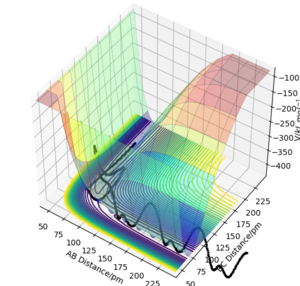
When the initial positions correspond to the final positions of the trajectory shown in the table above, the same final momenta values but with their signs reversed, the rAB is decreased first and H1 and H2 collide with each other then rBC is increased ending up with a collision between H2 and H3.
Using the last geometry as the initial positions but reversed signs momenta values, these three atoms move towards each other with similar kinetic energy as the last geometry and end up with the same geometry as the initial one of the last trajectory.
A contour plot of the trajectory or a plot of distances vs time would be helpful here Fdp18 (talk) 16:56, 24 May 2020 (BST)
=== Complete the table above by adding the total energy, whether the trajectory is reactive or unreactive, and provide a plot of the trajectory and a small description for what happens along the trajectory. What can you conclude from the table?
===
Conclusions: Sufficient kinetic energy is required to overcome the activation barrier for the reaction to happen. However, if the kinetic energy exceeds the attraction between two atoms of the expected product, barrier recrossing would happen. Whether a trajectory is reactive or not depends on how the atoms move and their interactions rather than simply how high the values of initial momenta are.
=== Given the results you have obtained, how will Transition State Theory predictions for reaction rate values compare with experimental values?
===
In the transition state theory, it is assumed that once the energy of the system overcomes the activation barrier of the transition state, the product would definitely be formed and recrossing would not happen. Please provide references. Fdp18 (talk) 16:57, 24 May 2020 (BST)
From the results obtained above where once one configuration is reached it is still possible to move back to the other side, the predictions from Transition State Theory are overestimated the reaction rate values.
Another assumption is that the motion of the system is considered classically therefore the effect of quantum tunneling is not taken into account. With tunneling effects, even though the total energy of particles could not reach the transition state barrier, there is a possibility for a part of particles to cross the transition state region to form products which would lead to higher rate values. In this case, the transition state theory may underestimate the reaction rate values. Since the possibility of quantum tunneling is so small that could be neglected, the Transition State Theory overestimates the reaction rate values overall.
Good discussion. Fdp18 (talk) 16:59, 24 May 2020 (BST)
Exercise 2ː F - H - H system
=== By inspecting the potential energy surfaces, classify the F + H2 and H + HF reactions according to their energetics (endothermic or exothermic). How does this relate to the bond strength of the chemical species involved?
===
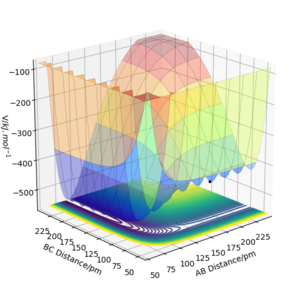
From this potential energy surface plot, the minimum energy path along the axis of AB distance represents the potential of H2 + F, which is higher in energy than the valley on the left-hand side which represents the potential of HF + H. This means that as H2 + F proceeds towards HF + H, the energy becomes more negative so this reaction is exothermic. Oppositely, the HF + H reaction would be endothermic as energy increases. The energy of forming H-H bond in the product is lower than the energy of breaking the H-F bond in the reactant. So the H-F bond is stronger than the H-H bond.
=== Locate the approximate position of the transition state.
===
According to the Hammond postulate, there would be an early transition state which is closer to reactants in energy for an exothermic reaction and a late transition state for an endothermic reaction. The position of the transition state is where distance H-H = 74.5 pm and distance F-H = 181.1 pm. At this stage, all atoms remain unmoved and forces along both AB and BC are zero. The Hammond postulate implies that the transition state would be closer to H2 + F in energy which means that the distance H-H would be smaller than that of F-H.
How did you arrive at these values? Again, it is necessary that you reproducibly show what you did. Fdp18 (talk) 17:04, 24 May 2020 (BST)
=== Report the activation energy for both reactions.
===
The energy of the transition state is -433.980 kJ.mol-1. In the H-F + H reaction, the energy of the initial state (H-F and H) is -560.700 kJ.mol-1 therefore the activation energy of this reaction is 126.720 kJ.mol-1. In the H-H + F reaction, the energy of the initial state (H-H and F) is -435.057 kJ.mol-1 therefore the activation energy of this reaction is 1.077 kJ.mol-1.
The energies of initial states of both reactions are found by, for example for the H-F + H reaction, if the distance HF is decreased by a small amount from the transition state position (by one in this case), the reaction would proceed to form H-F + H and there would be a decrease in potential energy showing the activation energy of this reaction by using the MEP calculation type after a long enough time. It would be the same idea to find the energy of H-H + F. This paragraph is what I am looking for in terms of a description - it is not much extra effort, but it shows the reader how you answered the question. Fdp18 (talk) 17:05, 24 May 2020 (BST)

===In light of the fact that energy is conserved, discuss the mechanism of release of the reaction energy. Explain how this could be confirmed experimentally.
=
Atom A is F while atom B and C are Hs.
When setting the distance AB = 170 pm, distance BC = 74 pm, momentum of AB = -1 g.mol-1.pm.fs-1 and momentum of BC = 5 g.mol-1.pm.fs-1, this H-H +F reaction is reactive. The system has enough energy to overcome the activation barrier to form product H-F + H. During this reaction, the total energy is conserved while the potential energy is transferred to the kinetic energy in order to form the H-F bond. The potential energy and the kinetic energy are alternatively converted to each other during the intermolecular vibrations of H-H and H-F. I am missing a contour plot here to support what you write. Fdp18 (talk) 17:07, 24 May 2020 (BST)
This could be confirmed experimentally by infrared spectroscopy.
Ideally the samples of relaxed HF gas would all lie in the vibrational group state in which there would be only one absorption peak caused by the promotion from the ground level to the first level.
For the excited HF, samples would also occupy higher energy levels besides the ground state. If both the ground level and the first level are occupied, two absorption bands are expected in the IR spectrum. The additional peak is due to the transition from the first level to the second one and it would be at a lower wavenumber than the other peak since, for this anharmonic system, the energy difference between levels becomes smaller as promoting higher.
The intensity of the fundamental band would increase then decrease with time. The intensity of the side-band would decrease then increase with time.
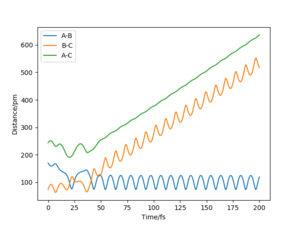
Reaction Dynamics of H - H + F Reaction
Distance H-H is set as 74 pm and distance FH is set as a relatively high value with a momentum of FH = -1.0 g.mol-1.pm.fs-1. As the value of momentum of HH is increased from -6.1 to 6.1 g.mol-1.pm.fs-1, there is no specific trend that the trajectory would change from reactive to unreactive or the other way. For the same initial position but with the momentum of FH = -1.6 g.mol-1.pm.fs-1 and momentum of HH = 0.2 g.mol-1.pm.fs-1, it is reactive.
Reaction Dynamics of H - F + H Reaction
Distance H-H is set as 794 pm and distance FH is set as 119 pm with a high value of HH momentum (for example -20 g.mol-1.pm.fs-1) and a low value of FH momentum (for example 0.1 g.mol-1.pm.fs-1). As the momentum of FH is increased by a small amount, the trajectory changes from unreactive to reactive.
=== Discuss how the distribution of energy between different modes (translation and vibration) affect the efficiency of the reaction, and how this is influenced by the position of the transition state.
===
The translational energy arises from the change of positions of particles while the vibrational energy is from stretching and bending of bonds between atoms. Careful with wording: The latter is also a change of positions of particles. Fdp18 (talk) 17:34, 24 May 2020 (BST)
For an exothermic reaction, the translational energy is better in promoting this reaction than the vibrational energy. With an early transition state, the vibrational motion would probably fall down through the reaction channel before reaching the transition state region while translational energy would more directly allow particles to move to the activation barrier and proceed to products. "Fall down through the reaction channel" is very colloquial, and difficult to understand. General comment: I am missing some simulation results here, ideally again in the form of a surface or contour plot, to substantiate your reasoning. Fdp18 (talk) 17:37, 24 May 2020 (BST)
For an endothermic reaction, the vibrational energy is more efficient in promoting the reaction than the translational energy. With a late transition state, the translational motion of particles does not align with the reacting direction that leads to the products but more likely to bounce back from the wall of the reaction channel. In this case, the vibrational energy would allow particles to reach the late energy barrier and form product effectively.
For those two cases studied above, it is reasonable to conclude that in the H-F + H reaction which is endothermic, it is much more effective to make this trajectory reactive by increasing the momentum of HF in which the increasing vibrational energy contributes better to reach the early transition barrier and form products, while a high HH momentum even though above the activation energy could not make this reaction happen. In the H-H + F reaction which is exothermic, a high HH momentum may not help effectively since vibrational energy is not quite efficient in the case of a late transition state as discussed above.
I am missing Polanyi's and Hammond's principles here, as well as a proper reference. Fdp18 (talk) 17:35, 24 May 2020 (BST)

