ModFEG1908
EX3 Section
BH3 Molecule
B3LYP/6-31G level
Item               Value     Threshold  Converged?
 Maximum Force            0.000006     0.000450     YES
 RMS     Force            0.000004     0.000300     YES
 Maximum Displacement     0.000023     0.001800     YES
 RMS     Displacement     0.000015     0.001200     YES
Frequency Analysis Log File:File:FG BH3 FREQ.LOG
Low frequencies ---   -2.3742   -1.0821   -0.0054    2.0837   10.1950   10.2522
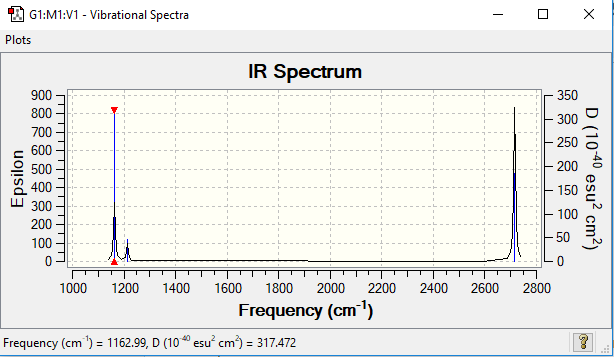
Low frequencies --- 1162.9856 1213.1754 1213.1781
Optimised BH3 |
There are 6 vibrations of the BH3 molecule but less than 6 peaks. There is only 3 peaks as there are two pairs of degenerate vibrations and one vibration that is not IR active.
BH3 molecular Orbitals
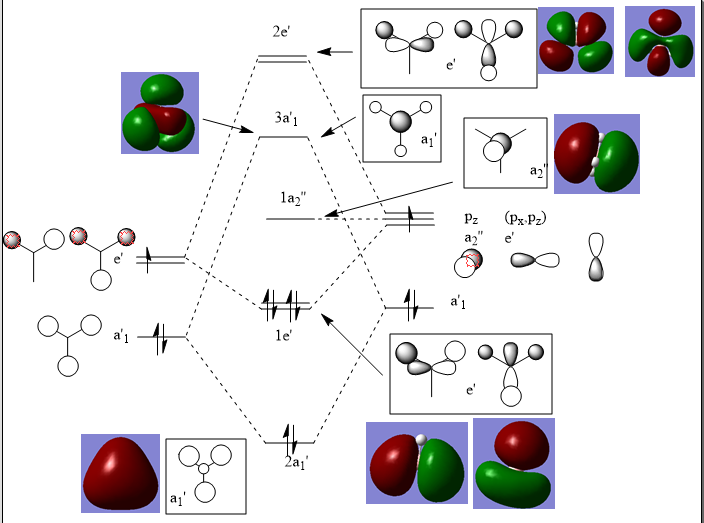
There is no significant differences between the real and LCAO MOs. This shows that qualitative MO theory is very accurate and useful in this instance. The 1s MO was also created on Gussian but was much deeper in energy and so is not present in the MO diagram.
NH3 Molecule
B3LYP/6-31G level
         Item               Value     Threshold  Converged?
 Maximum Force            0.000060     0.000450     YES
 RMS     Force            0.000040     0.000300     YES
 Maximum Displacement     0.000369     0.001800     YES
 RMS     Displacement     0.000162     0.001200     YES
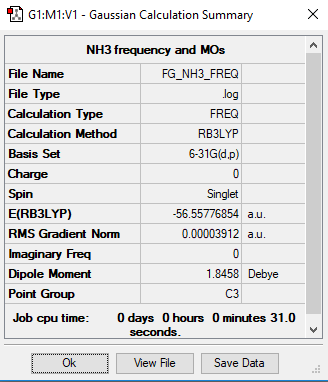
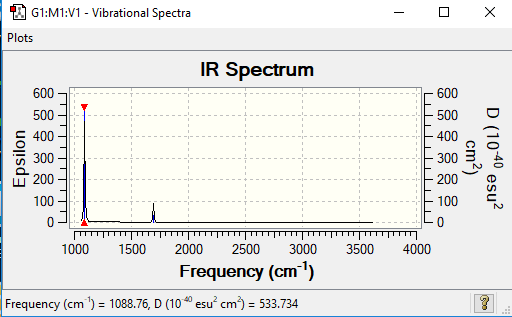
Frequency Analysis Log File:File:FG NH3 FREQ.LOG
Low frequencies ---  -32.4235  -32.4224  -11.4276   -0.0047    0.0113    0.0475
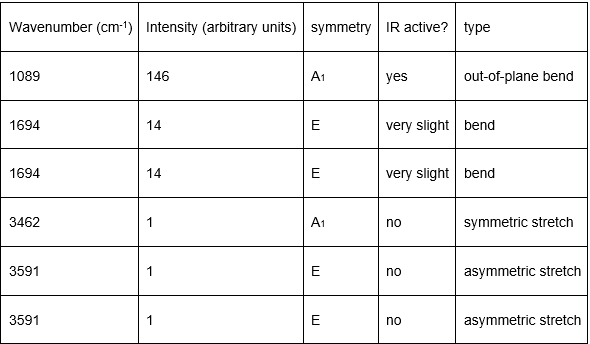
Low frequencies --- 1088.7628 1694.0251 1694.0251
Optimised NH3 |
NH3BH3 Molecule
B3LYP/6-31G level
Ng611 (talk) 20:08, 20 May 2019 (BST) Your energy here is slightly off unfortunately.
         Item               Value     Threshold  Converged?
 Maximum Force            0.000164     0.000450     YES
 RMS     Force            0.000043     0.000300     YES
 Maximum Displacement     0.001168     0.001800     YES
 RMS     Displacement     0.000259     0.001200     YES
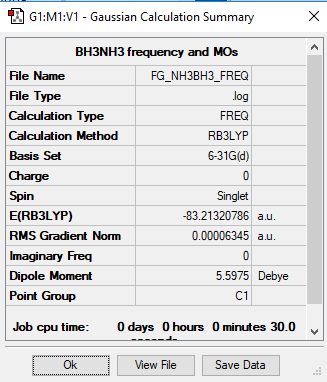
Frequency Analysis Log File:File:FG NH3BH3 FREQ.LOG
 Low frequencies ---   -0.0007   -0.0006   -0.0005    0.8656   13.9276   26.6214
 Low frequencies ---  266.1273  633.9919  641.7220
Optimised NH3BH3 |
Association Energy
E(NH3)=-56.55776871 a.u. E(BH3)=-26.61532364 a.u. E(NH3BH3)=-83.21320666 a.u.
ΔE=E(NH3BH3)-[E(NH3)+E(BH3)] ΔE=-0.04011431 a.u.=-105 kJ(3.s.f)
Ng611 (talk) 20:10, 20 May 2019 (BST) SLightly off the true value due to incorrect energy for nh3bh3
The B-N dative bond is of medium strength. The value is around 25 kcal/mol dome bonds association values can be as low as 0.002 kcal/mol or as high as 152 kcal/mol.
Ng611 (talk) 20:10, 20 May 2019 (BST) A comparison to known experimental bond enthalpies (preferably isoelectronic) would be ideal here.
NI3
B3LYP/6-31G level
Frequency Analysis Log File: File:FG NI3 FREQ CORRECT.log
Item               Value     Threshold  Converged?
 Maximum Force            0.000067     0.000450     YES
 RMS     Force            0.000044     0.000300     YES
 Maximum Displacement     0.000482     0.001800     YES
 RMS     Displacement     0.000327     0.001200     YES
Optimised NI3 |
The optimized distance is 2.184 Angstroms (3.d.p)
Project Section
Ionic Liquids
[N(CH3)4]+ Molecule
B3LYP/6-31G level
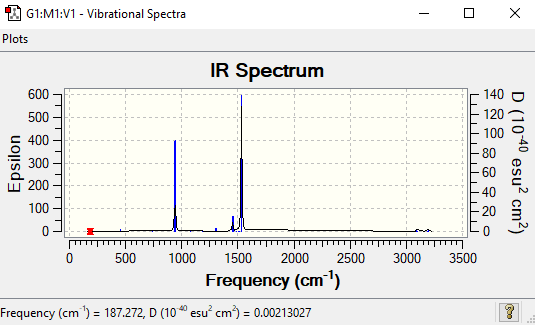
Frequency Analysis Log File:File:FG N(CH3)4 FREQ.LOG
         Item               Value     Threshold  Converged?
 Maximum Force            0.000136     0.000450     YES
 RMS     Force            0.000050     0.000300     YES
 Maximum Displacement     0.000502     0.001800     YES
 RMS     Displacement     0.000173     0.001200     YES
Optimised N(CH3)4 |
  Low frequencies ---  -15.2627  -11.7593   -0.0010   -0.0008   -0.0006    7.9555
 Low frequencies ---  187.2822  288.3342  289.8038
[P(CH3)4]+ Molecule
B3LYP/6-31G level
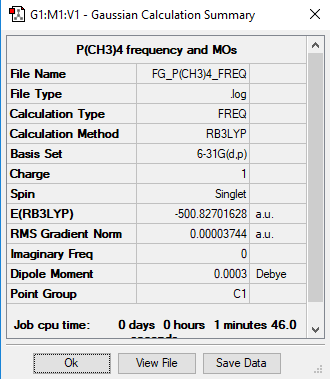
Frequency Analysis Log File:File:FG P(CH3)4 FREQ.LOG
         Item               Value     Threshold  Converged?
 Maximum Force            0.000067     0.000450     YES
 RMS     Force            0.000016     0.000300     YES
 Maximum Displacement     0.001236     0.001800     YES
 RMS     Displacement     0.000308     0.001200     YES
Optimised P(CH3)4 |
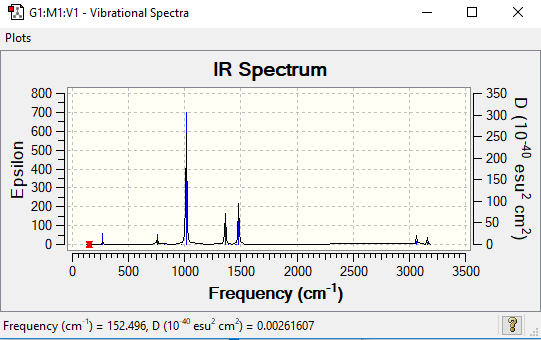
 Low frequencies ---  -16.4962   -8.7101   -0.0038   -0.0031   -0.0026   17.0348
 Low frequencies ---  152.5604  185.4897  189.0154
Charge Distributions
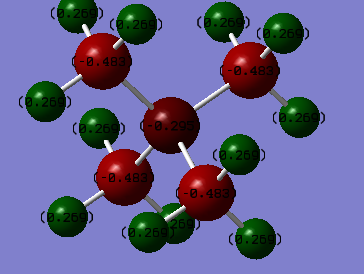
In N(CH3)4+ the charge on the N atom is -0.295 e, the charge on the C atoms is -0.483 e, and the charge on the H atoms is 0.269 e.
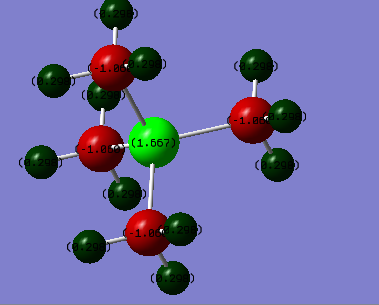
In In P(CH3)4+ the charge on the P atom is 1.667 e, the charge on the C atoms is -1.060 e, and the charge on the H atoms is 0.298 e.
The most notable difference between the two molecules' charge distribution is that the phosphorous atom has a positive charge and the Nitrogen atom has a negative charge. The magnitude of the charge on phosphorous was also larger at 1.667 e compared to the -0.483 e on the nitrogen. The carbons on both molecules were more negative than the central atoms, with a -1.060 e charge for the phosphorous and a -0.483 e for the Nitrogen complex. The hydrogens both had similar positive charges on the hydrogens with a slightly more positive vealue on the phosphorous complex at 0.298 e compared to the 0.269 e on the nitrogen one. The difference in charges in the complexes is probably due to the fact that the nitrogen atom is more electronegative than the phosphorous atom. THis means that electrons are pulled away from the carbons in the nitrogen complex more strongly making the carbon atoms less negatively charged and the nitrogen more negatively charged.
Ng611 (talk) 20:17, 20 May 2019 (BST) You should also consider the effect of molecular symmetry.
In the [NR4]+ depiction the formal positive charge is placed on the central nitrogen atom implying that the charge distribution on this atom should be positive. From the calculations for the Nitrogen complex the charge on the nitrogen atom was -0.295 e and the positive charge was on the hydrogen atoms with a value of 0.269 e.
Ng611 (talk) 20:17, 20 May 2019 (BST) Yes but why is this the case?
Molecular Orbitals

Ng611 (talk) 20:22, 20 May 2019 (BST) Good LCAO analysis. You should consider labelling the key interactions for your MOs though.
In MO 10 the s orbital on the nitrogen atom is anti-bonding with the methyl ligand molecular orbitals, which are all bonding with each other so have been represented as s orbitals.
In MO 15 the central nitrogen atom is non-bonding with the methyl groups. The methyl group ligand molecular orbitals have been represented as p orbitals for simplification. These p orbitals bond and antibond with each other as they overlap.


