using Jan's code to visualise the esp fitting points
- the code you need is fit_points.py
- this can be found in repESP/scripts
- this code plots fitting or cube points in 2 or 3D colored by field values
- to avoid a cluttered plot it is recommended to specify a 'slice' of points
- two arguments are required, the file containing the points and identifying a full 3D plot or a 2D slice
- other arguments are optional as usual use "fit_points.py -h" to get a help menu
- note, if you want the red boxes removed, edit "graphs.py" in repESP
- the following will load an interactive graph, click on the window close button to return to your terminal
- options and colour controls
- -o filename will send the image directly to a png file (the interactive graph will not open)
- --sym_color_range will make the colour range symmetric, the default is unsymetric
- fit_points.py ch3oh_mk.esp 2 --sym_color_range --slice_dist 1.5 --slice_atoms 1 5 6
- --color_range LOWER UPPER allows you to define a particular range
- fit_points.py ch3oh_mk.esp 2 --color_range -.1 0.1 --slice_dist 1.5 --slice_atoms 1 5 6
fit_points.py ch3oh_mk.esp 3
- will open a rotatable graph of all points in 3D
|
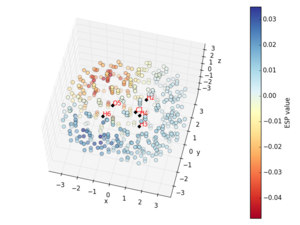 example pyplot of MK mesh for ch3oh example pyplot of MK mesh for ch3oh
|
- the following take a slice through the C,O and H (of the OH)
- the slice includes all points within is 1.5 Angsrom from the plane of the C-O-H atoms
- not sure if this is 1.5 Å in total or 1.5 either side of the plane!
fit_points.py ch3oh_mk.esp 2 --slice_dist 1.5 --slice_atoms 1 5 6
|
| *will open a fixed plot of points within the slice in 2D
|
 example plot of MK mesh for ch3oh example plot of MK mesh for ch3oh
|
fit_points.py ch3oh_mk.esp 3 --slice_dist 1.5 --slice_atoms 1 5 6
|
| *will open a rotatable plot of all points within the slice
|
 example plot of MK mesh for ch3oh example plot of MK mesh for ch3oh
|
how to alter the visuals
- if you want to alter things like the point size and circle size you will need to delve into the code
- save an original copy of repESP/graphs.py and then head into graphs.py
- you are looking for "ax.scatter" to edit
- you are interested in the
- maker size (s) the default is 5 you can increase or decrease this
- marker style (marker)
- line width (lw) a value between 5 and 100 seems good
- transparency (alpha) a value between 0(transparent) and 1(opaque)
- a common option is marker="o" for circle and c=marker_fill to be filled
- atoms are plotted in "def _plot_atom"
ax.scatter(*coords[:dimension], marker='D', c=marker_fill)
- to edit the 3D rotatable graph you want to edit the ax.scatter on line 286, here is the original code
image = ax.scatter(*list(zip(*points))[:dimension], c=values,
                       cmap=cmap, vmin=vmin, vmax=vmax, s=5, lw=0.5)
image = ax.scatter(*list(zip(*points))[:dimension], c=values,
                       cmap=cmap, vmin=vmin, vmax=vmax, alpha=0.5,  s=100, lw=0)
- to edit the axis details you need to alter _plot_common on line 21, here is the start of the original code
def _plot_common(dimension, title, guideline=False):
- the axis width is currently the default so you need to add some code but this is not working!
- the color changes but not the thickness
#      ax.xaxis._axinfo["grid"].update({"linewidth":1, "color":"red"})
#      ax.xaxis._axinfo["grid"]['linewidth'] = 3.0
an example of my changes
fit_points.py ch3oh_mk.esp 3
|
| *will open a rotatable graph of all points in 3D with my options
|
 example plot of MK mesh for ch3oh with altered parameters example plot of MK mesh for ch3oh with altered parameters
|


