Mod:Hunt Research Group/CommonErrors
Common Errors
Errors
The most annoying error to occur is when the OUTPUT file returns and looks like this.
                    DL_POLY Version 2.19

                              Running on   16 nodes


~
~
This is the entire file that is returned. Normally when the file enocounters a problem there will be an error message. With this praticular error there is no error code.
The error ocrrus because the CONFIG file has not been modified. When this error occurs the top section of the CONFIG file still looks like this.
Converted from Packmol XYZ
         0         0           0            0.000000
      0.000000000000      0.000000000000      0.000000000000
      0.000000000000      0.000000000000      0.000000000000
      0.000000000000      0.000000000000      0.000000000000
NA               1
           -2.187765            3.553628            0.510867
…
To fix this simply modify the first few lines of the CONFIG file.
As mentioned, normally when the program encounters a problem an error code is included towards the end of the file. It is worth reading back a few lines as sometimes an error occurs and the program writes a few more lines and then writes a second or third error code. When an error code is in the OUTPUT file it is possible to look up what the error is, and what to do to fix the error. A useful website I have found is linked below
http://www.uark.edu/ua/fengwang/DLPOLY2/node268.html
Data points clumping
An error that can occur is the data points clump together. this is caused by the scaling not being frequent enough. The picture below shows the energy plot for a NaCl simulation with scale set to 1000.
File:NaCl packmol 1000K energy.tiff
It can clearly be seen that data points are all near each other. There are 10 data points per clump relating to how regularly the data is printed and how regularly scaling of velocities occurs. If the scaling value in the CONTROL file is increased to 10,000 the new energy plot for NaCl looks very different with the clumps containing 100 data points.
File:NaCl packmol 1000K-NPT scale10000 energy.tiff
Reducing the scale value in the CONTROL file to 100 has resulted in the energy plot looking more reasonable, below.
File:NaCl packmol 1000K-NPT scale100 energy.tiff
Exploding simulation
In the output file values will be quoted as NaN, in VMD there will only be a couple of steps with atoms in, and in the statis2xmgr plots there will be again be only a couple of data points.
This occurs occasionally and there are a few possible reasons.
- The FILE parameters are wrong
- The relaxation times in an NPT simulation are too small
Voids forming in the simulations
Energy Drift
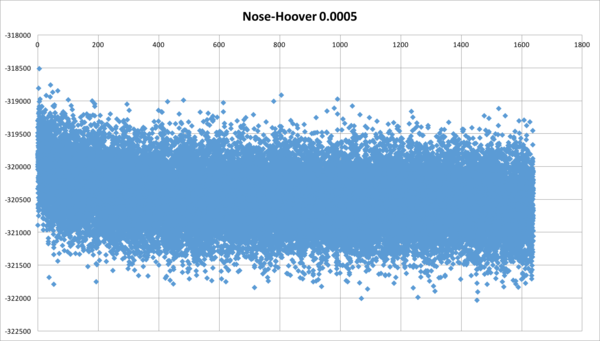
Can occur when using the Nose-Hoover ensemble. In a NaCl simulation after repeated attempts the energy continued to drift.
This was initially overcome by using a different ensemble, the Berendsen ensemble. By changing the type of ensemble the total energy of the system has gone from continually reducing to being stable. Richard M has suggested that the Berendsen ensemble is not as mathematically rigorous as the Nośe-Hoover ensemble
Some further work has shown that reducing the time step to 0.5 fs from 5 fs using the Nośe-Hoover has given a stable energy during the NPT simulation
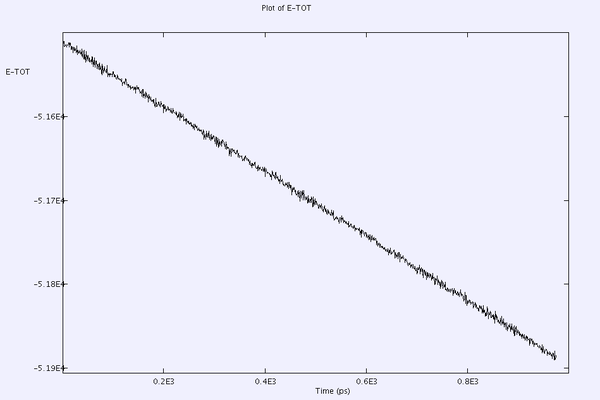
When carrying out NPT and NVT simulations with Nose-Hover (Equilibration and Production) you may come across a drift in the Total Configuration Energy. This may present itself with either a positive or negative slope.
This may occur for several reasons. (list to be expanded if and when more problems are encountered)
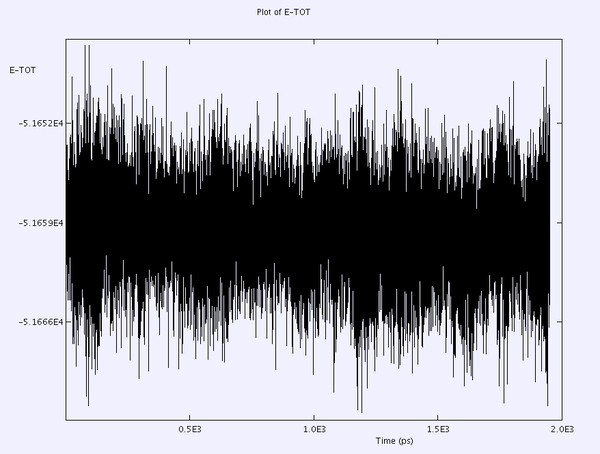
2 examples are 1. Two atoms coming too close together and repelling each other strongly. 2. Shake tolerance is not set to a sufficiently high level thus the constraints are not properly constrained leading to an energy drift.
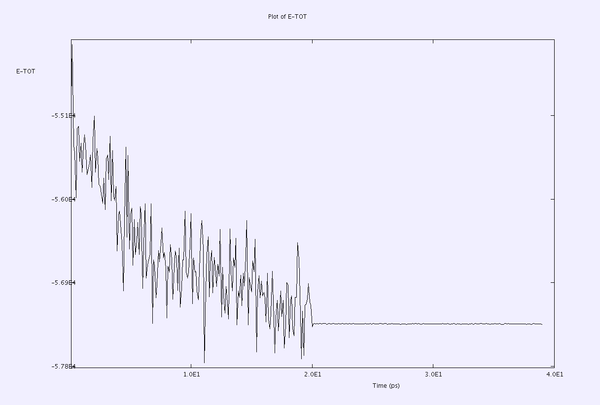
To correct for 1. use capping and scale as recommended by Ruth for melting an IL from the crystal structure
- The capping default=1000 but use 2000 kbT per Å (Ruth)
- capping constrains the forces on individual atoms to be smaller or equal to a particular value and resets large forces.
- Use scaling, every 5 or 10 steps
- scaling scales all atomic velocities by the same amount to reproduce desired temperature (??)
an example of the E-Tot plot using capping=1000 and scaling=5 is shown
An example for case 2 is illustrated below for an NVT simulation at 400K - [BMIM]CL - with shake=1e-5
and corrected with shake=1e-8
The second solution was obtained from the DL_POLY forum - http://www.cse.scitech.ac.uk/disco/forums/ubbthreads.php?ubb=showflat&Number=2881&page=1
Which points to the fact that using a lower shake tolerance leads to poor conservation of the total energy.
A concise reason for this is being formulated!!


