Mod:Hunt Research Group/AdditionalFunctions.py
CubePy is under CC BY-NC-SA license
AdditionalFunctions.py is a collection of functions that do not work directly with cube files, but with data produced by the other scripts.
Requirements
- Python
- Matplotlib
An easy way to obtain Python with the required modules is by installing Anaconda.
Anaconda comes with Spyder, which is a Python editor that you can use to write and run Python codes (Applications Anaconda Navigator spyder Launch)
Instructions
Running the code
The plotting functions can be run from the terminal window by typing:
python AdditionalFunctions.py function_name file_path1 file_path2... arg1=val1 arg2=val2...
Functions
OverlapKDEs

This function plots overlapping KDEs as read from _kde.out files written by PlotHistogram from PlotCube.py (when save is True).
Required arguments
fpaths(string) = paths for _kde.out files
Optional arguments
value_type(string, default='esp') = can be ‘esp’/’potential’ or ‘dens’/’density’ (or any uppercase version of the aforementioned); used in conjunction with the keywordsauandunitsin order to convert the values to the appropriate unitsxlim(list, default=None) = x axis limitsylim(list, default=None) = y axis limitslog(boolean, default=True) = if True, it saves a .log file of the command used to run the functions (the command is tidied-up before saving i.e. unnecessary spaces are removed, argument values are converted to their usual uppercase/lowercase versions, file lists are explicit - instead of using wildcard symbols such as *)logfile(string, default=None) = the name of the log file (iflogis True); by default the file name is the input file name followed by the function name
Observations
- if you only want to specify one limit for either of the axis, use None for the other (e.g. xlim=[None,3.5])
Example
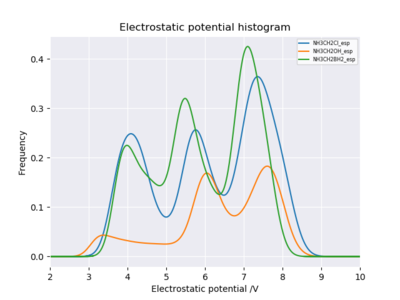
python AdditionalFunctions.py OverlapKDEs NH3CH2Cl_esp_kde.out NH3CH2OH_esp_kde.out NH3CH2BH2_esp_kde.out xlim=[2,10]
The resulting plot is shown in figure 1.
PlotHistogram
This function plots one KDE and/or one histogram as read from _kde.out and _hist.out files written by PlotHistogram from PlotCube.py (when save is True).
Required arguments

fpaths(string) = paths for _kde.out and _hist.out files (should be one of each at most)
Optional arguments
value_type(string, default='esp') = can be ‘esp’/’potential’ or ‘dens’/’density’ (or any uppercase version of the aforementioned); used in conjunction with the keywordsauandunitsin order to convert the values to the appropriate unitscolour(string, default='rainbow') = colour scheme ('rainbow' by default, change it to 'bwr' for blue-white-red) - full list herecb_lim(list, default=None) = limits for the colour bar (list of two floats; if not specified, the limits will be the min and max of the values; if the limits do not cover the whole range of values, a warning is printed)xlim(list, default=None) = x axis limitsylim(list, default=None) = y axis limitslog(boolean, default=True) = if True, it saves a .log file of the command used to run the functions (the command is tidied-up before saving i.e. unnecessary spaces are removed, argument values are converted to their usual uppercase/lowercase versions, file lists are explicit - instead of using wildcard symbols such as *)logfile(string, default=None) = the name of the log file (iflogis True); by default the file name is the input file name followed by the function namecb_sym(boolean, default=False) = if True, the colour bar limits are chosen to be symmetric around 0 (cb_lim, if specified, overridescb_sym)
Observations
- if you only want to specify one limit for either of the axis, use None for the other (e.g. xlim=[None,3.5])
- the function only works for one histogram file and/or one KDE file. If multiple files of either type are specified as arguments, the execution of the program is stopped and a warning is printed.
- the data in the files specified as arguments must be in the same units. If that is not the case, the execution of the program is stopped and a warning is printed.
Example
python AdditionalFunctions.py PlotHistogram test_emim_oac_esp_kde.out test_emim_oac_esp_hist.out
The resulting plot is shown in figure 2.
