Mod5:selkirk.fox21
Module 2
Creating a Molecule
A molecule of BH3 was created in gaussview and the geometry of this structure was optimised as explained in the instructions using the DFT-B3LYP method with a 3-21G basis set. This is considered to be a relatively poor basis set giving low accuracy results; however, it does mean the calculations are notably quicker than they would otherwise be if a complex basis set were to be used. In the case of BH3 it is suitable for the optimisation calculation. BH3 itself is a difficult molecule to obtain and is rarely isolated; instead it is commonly found as an intermediate in many processes. For this reason it is also difficult to obtain physical data for the molecule in this form as it readily produces the preferred B2H6 dimer.
Optimising a Molecule
BH3 optimisation
Total Energy -26.46226338 a.u.
Two key processes take place during an optimisation; the first includes solving the Schrodinger equation for the electrons assuming the nuclei do not move which produces the energy and the density for the nuclei in given positions, meanwhile the second includes solving for the position of the nuclei. The position of the nuclei are continually changed to obtain the geometry with the lowest energy and once this is achieved, the optimised geometry has been obtained.
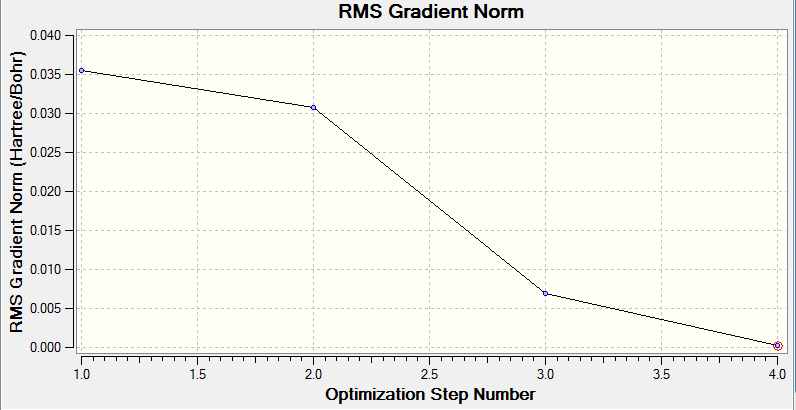
The gradient curve below shows the individual steps performed by gaussian in the optimisation calculation and their corresponding structures. The programme achieves the optimisation by determining the minimum point of the energy curve itteratively. A low gradient value is desired as this is indicative of approaching a turning point. Consequently, we observe that the most stable conformer (that with the optimised geometry) has the lowest gradient because it is nearest the minimum at which point the gradient is zero.
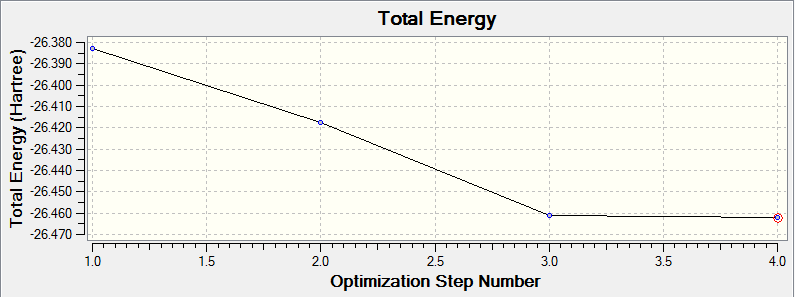
This total energy curve supports the gradient curve insomuch that it illustrates that the most stable conformation of the BH3 molecule, that with the optimised geometry has the lowest energy.
Reverting back to the optimisation procedure, we must acknowledge that we use the Born-Oppenheimer approximation when solving the Schrodinger equation. In doing this, as mentioned earlier we assume that the nuclei are fixed thus we are just solving for the electrons. The resulting energy is dependent on the frozen position of the nuclei (let this be R), therefore if we are to move the locations of the nuclei the previously calculated energy E(R) is no longer valid. Altering their positions gives a new energy according to the function E(R').
We can elaborate on this explanation and further our understanding of the optimisation procedure by first considering the Morse Potential Curve which illustrates the dissociation of a diatomic molecule. The plot represents the change in the interatomic distance (R) and the corresponding energy of the molecule. Decreasing R (internuclear separation) increases repulsion between the two nuclei which are both in effect positively charged in much the same way as two like poles on magnets repel one another. Conversely, as (R) increases, the nuclei become stretched and electrons no longer form a bond. In this case the electron nuclear attraction decreases, which in turn means the energy rises and the molecule dissociates. The equilibrium is said to be the optimum (R) at which the molecule has a stable arrangement of nuclei and electrons.
It is this equilibrium point that we are searching for in the optimisation in order to try and find the most stable geometry of the molecule. The programme does this by repeatedly solving the Schrodinger equation for each structure, modifying the positions of the nuclei each time in order to lower the overall energy. Using this iterative technique, we eventually reach the lowest energy conformer by approaching the minimum point. In this process, a sequence of different energies are produced, each dependent on the altered positions of the nuclei and electrons. This is known as traversing a Potential Energy Surface (PES).
Analysing the Output
It is only by analysing the output that we can confirm if the job has been finished properly. This is done by observing whether there is a 'YES' response to convergence for each the maximum, RMS, minimum and RMS. Only then can we begin to obtain the data for the geometry of the optimised molecule. This data is illustrated below:
B-H Bond length: 1.19349 Angstroms which accords strongly with the literature value of 1.19001 Angstroms[1].
H-B-H Bond angle: 120o which illustrates that we have obtained a trigonal planar structure in which the boron is present in an sp2 hybridised state. The strong agreement between the obtained data and the literature data confirm that the minimum basis set provides a good approximation for this molecule.
This link provides data for the BH3 Optimisation.
Calculations on TlBr3
The same method and basis set (3-21G) as described for BH3 were applied for the TlBr3 optimisation and gave the following results for the bond distance and bond angle:
Tl-Br bond distance: 2.65 Angstroms
Br-Tl-Br bond angle: 120o
Comparison of the bond distance with the literature value of a TlBr3OH2 complex where the Tl-Br bond length is given to be 2.50[2] Angstroms signifies that the minimal basis set does not provide such a good approximation for the thallium molecule. In this case the agreement is still good; however, the optimisation gives a slight overestimation of the bond length. Thallium is a larger more complex atom than Boron in which the orbitals will be more diffuse and therefore more difficult to model, hence why a more rigorous basis set would be required to give a better approximation of the real molecule.

The thumbnail alongside shows the optimisation data for the TlBr3 molecule including the total energy.
Instead of basing the existence of a bond exclusively on the distance separating two atoms, it should be determined by way of orbital overlap and subsequent electron density around the atoms between which a bond is being formed. Gaussview has a predefined distance from which it will determine if a bond exists or not between two atoms. This method often gives incorrect structures since this predefined limit is too small, thus we find some structures are shown not to have bonds when in fact bonds do exist in reality. This is exemplified in the optimisation structures where we notice that the earlier structures with greatest atomic separation appear not to have bonds despite the fact that in reality there are bonds connecting the atoms. If however, the presence of a bond was defined by the Morse curve, thus considering the resulting energy of the separation between atoms in order to determine whether a bond existed; a more accurate representation of the molecules might be achieved. At least this approach would consider the electron-electron interactions as well as the electron-nuclear interactions and base the existence of a bond on these factors as to whether the atomic separation gives a stable molecule or causes sufficient destabilisation for the atoms to dissociate.
Considering the above discussion of bonding we can now finally define what a bond actually is: a chemical bond is an electrical force which links atoms permitting the formation of chemical structures containing two or more atoms. This attraction originates from the electromagnetic force between opposing charges (eg. electrons and nuclei) and is the result of dipole attractions. Ultimately, on formation of a bond; two components each exist with a lower individual energy than when they were separate. The resulting bond is stable and requires energy to be broken.
After optimisation of the TlBr3 molecule, the frequency was determined by selecting the frequency job type in place of the optimisation. Again the same basis set and pseudo potential were used. Note it is important to ensure that the same basis set is used for all calculations on any given molecule since it is the basis set which determines the accuracy to which the calculations are performed. Consequently, it is not possible to compare data between basis sets as a more complex one will give a better approximation thus nearer the experimental values than a less rigorous one. The low frequency data obtained from this calculation have been inserted below:
Low frequencies ---   -3.4213   -0.0026   -0.0004    0.0015    3.9367    3.9367
Low frequencies ---   46.4289   46.4292   52.1449
The low frequency values are simply obtained from a double differential of the energy curve thus if we recall simple a level maths, the value produced signifies whether the turning point (gradient of zero) is either a minimum or maximum. The fact that no points below -5 have been collected signifies that the turning point which the optimisation has reached is in fact a minimum and not a maximum and so we can conclude that the geometry of the molecule has been successfully optimised. N.B.we must always ensure to carry out the frequency analysis in order to obtain the low frequency data as this is the only way we can ensure that we have obtained a minimum and thus the actual optimised geometry.
What is a bond? (your reply should not be more than a paragraph in length) Finally,
Molecular Orbitals
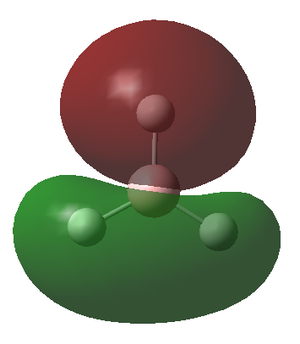
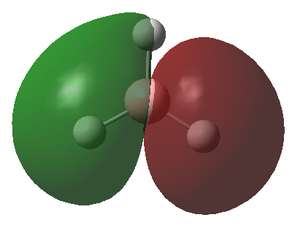
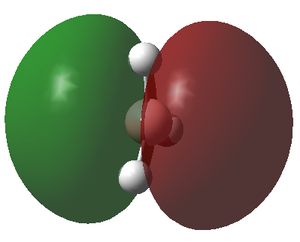
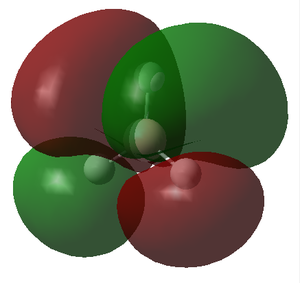
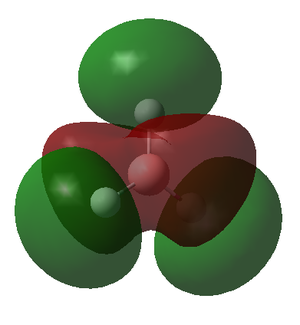
The molecular orbitals (MOs) of the BH3 molecule were computed again using the same method and basis set whilst altering the job type to Energy. The insertion of pop=full into the additional key words gives the order for the calculation of the MOs. The MO diagram for the D3h BH3 molecule has been drawn below for which the energy levels were determined by matching the calculated MOs and their corresponding energy with the Linearly combined atomic orbitals (LCAO). Only the first 8 orbitals are included as they are involved in the chemistry of this molecule, meanwhile the other orbitals have significantly greater energy and play little role in the bonding of the molecule.
This is a link to the Population Analysis.
The MO diagram of the BH3 molecule is shown below:

By matching the MOs with the LCAO
| MO | 1a1' | 2a1' | 1e' | 1e' | 1a2" | 2e' | 2e' | 3a1 |
| LCAO | ||||||||
| MO's | 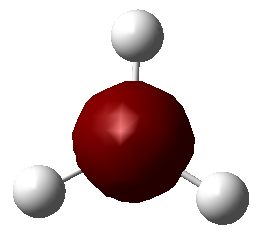 |
 |
 |
 |
 |
 |
 |
 |
| Energy | -6.730 | -0.518 | -0.357 | -0.357 | -0.0746 | 0.189 | 0.189 | 0.192 |
The energy of the calculated MO's highlights an issue with the qualitative MO diagram whereby the energy of the 3a1' orbital is significantly higher than expected. Consequently, this orbital is in fact higher in energy than the degenerate 2e' orbitals, a detail that would go unnoticed if the MO diagram were determined qualitatively. This is particularly interesting because in a qualitatively derived MO diagram this orbital would be filled; however, in this MO diagram it is clear that this orbital is unoccupied. Incidentally, the LUMO is the pz orbital of the boron which is unsurprising if we recall that BH3 is susceptible to nucleophilic attack due its empty p orbital coupled with its electron deficiency. In addition, this MO shows us that this molecule has no unpaired electrons and therefore must be diamagnetic.
From this we can conclude that MO diagrams despite providing a good approximation of the MOs have limitations in that it is often hard to predict the exact energies of the orbitals and thus their relative positioning in the diagram. It is only once we solve for the energy of the MO's computationally that we grasp an idea of the associated energy with each orbital. This in turn permits a much more accurate description of which orbitals will be filled and unfilled and therefore allows us to locate the frontier orbitals (HOMO & LUMO) with confidence. The LCAO's do however give a relatively accurate representation of the shape of the MOs, apparent when we compare the LCAOs in the MO diagram with their corresponding calculated MO.
nbo analysis
Charges of the respective atoms: H - -0.093
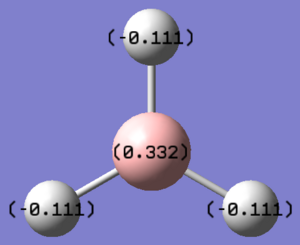
B - 0.278 The natural bond order analysis is run to give a representation of the charge distribution in the molecule. The NBO analysis produced the following charge distribution for the BH3 molecule, whereby the Boron atom has a positive charge of 0.332 Debye, meanwhile, the hydrogen atoms have a negative charge of -0.111. This is representative of the electron distribution in the molecule. We can therefore draw from this that a significant amount of the electron density is located on the hydrogen atoms, meanwhile the Boron atom possesses little in comparison. This data is illustrated in the picture below:
Vibrational Analysis
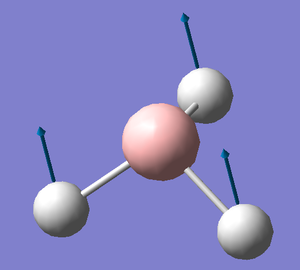
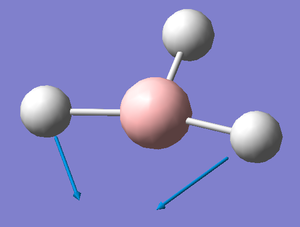
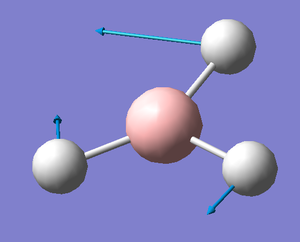
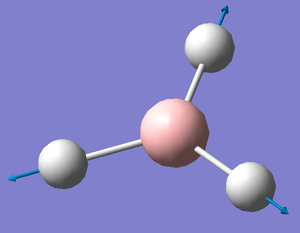
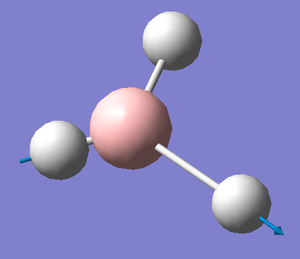
A frequency analysis was run on the optimised BH3 molecule to give its 6 expected vibrations. We know that there should be 6 vibrations according to the 3n-6 rule for non linear molecules. Each of the vibrations is illustrated with displacement vectors and their respective symmetry label in the table below:
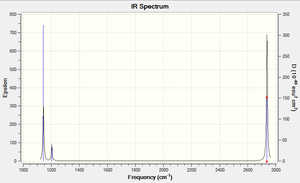
Despite the fact that there are clearly 6 vibrational stretches, observation of the IR spectrum alongside shows that only three are visible as peaks. This is because there are two sets of degenerate peaks (vibrations 2 &3 and 5 & 6) which overlap in the spectrum and therefore appear only to give one peak. Vibration 4 is totally symmetric insomuch that the dipoles created by the vibrations cancel one another out rendering this stretch IR inactive, hence why it is seen to give an intensity of zero thus not appearing in the spectrum.
Isomerism in Cis and Trans octahedral Mo complexes
Both cis and trans isomers of the [Mo(CO)4(PPh3)2] complex were constructed in gaussview and their geometry optimised using the DFT/B3LYP method with the LANL2-MB basis set also ensuring to insert "opt=loose" into the additional key words. This basis set is the most basic where MB stands for minimal basis, therefore gives the least accurate optimisation; however, it does require far less computing power to perform the calculation which in turn means the calculations are relatively fast. Note that the phenyl groups have been substituted with Chloride atoms for ease of calculation. The effect of this substitution is to reduce the computing power required to perform the calculation because not only are the chlorine atoms far simpler and smaller than the phenyl groups, but they eliminate the issue with the potential for the phenyl groups to rotate thus reducing the length of the optimisation procedure. This substitution is possible because Cl atoms have been shown to have a similar electronic contribution to the bonding as phenyl groups, and they are sterically quite large.
After this initial optimisation, both isomers were futher optimised using the LANL2-DZ basis set (removal of "opt=loosse" in additional key words), a more rigorous basis set which produces more accurate values for the optimisation. Before performing this optimisation, the PCL3 groups were all rotated as illustrated in the instructions in order to obtain the global optimisation minimum for each molecule as opposed to a local minimum. The optimised structures for both isomers are shown below:
| Mo cis optimisation C2v symmetry | Mo trans optimisation D4h symmetry |
The optimisation data tells us that the two isomers possess almost exactly the same energy to 3 decimal places; where the cis isomer has an energy of -2.719e-18kJ whilst the trans isomer has an energy of -2.719e-18kJ.
The LANL2DZ is a better basis set than LABL2-MB but is still considered a minimal basis set especially for phosphorous. It fails to include the presence of the low lying d atomic orbitals present on the phosphorous atom and also fails to account for phosphorous' tendancy to be hypervalent. The effect of this is to lower the accuracy in the optimisation of both of the Mo complex isomers. To increase the accuracy we must tell gaussian to account for the factors mentioned above using the following method:
Insertion of extrabasis into the top and
(blank line)
P 0
D 1 1.0
0.55 0.100D+01
(blank line)
into the bottom of the gaussian input file before submitting the molecule again to SCAN gives the programme the order to model the full chemical behaviour of phosphorous. The new, more optimised files were used in the frequency calculations, before submitting to scan the above code was again placed in the log file to keep the basis set and pseudo potential the same.
IR data for Cis and Trans Molybdenum Complexes
| Number | Trans vibrational frequencies (cm-1) | Cis vibrational frequencies (cm-1) |
| 1 | 1950 | 1945 |
| 2 | 1951 | 1949 |
| 3 | 1977 | 1958 |
| 4 | 2031 | 2023 |

 |
 |
 |
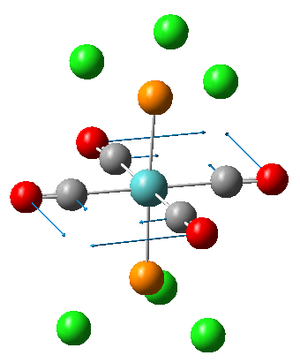 |
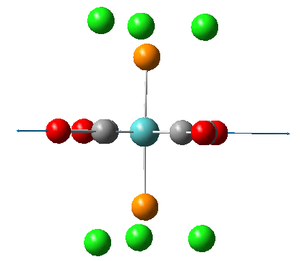
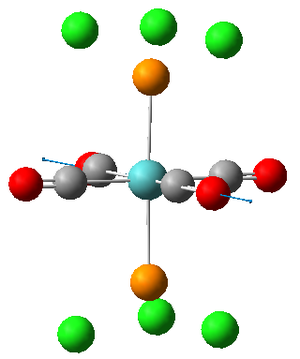
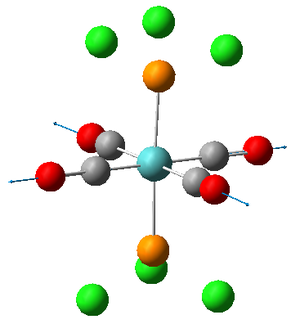
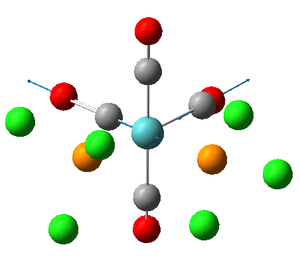
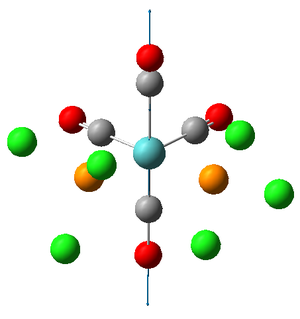
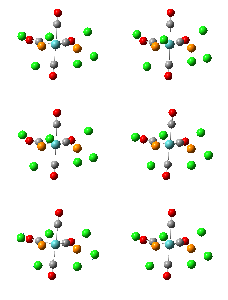
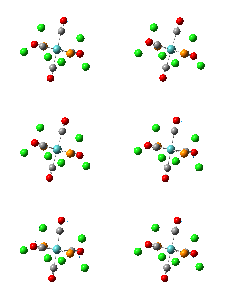
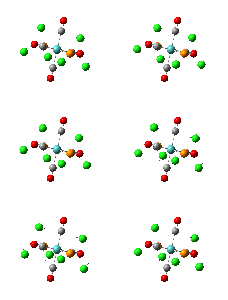
Vibrations 1 and 2 are very similar; two carbonyls vibrate anti to each other in both vibrations but are located on different axes. The frequencies and therefore the energies of the two vibrations are slightly different but this is only because the calculation is performed on a rigid molecule in which the position of the Cl will effect the carbonyl vibrations. In reality however, the M0-P bond within the molecule will be free to rotate assuming T>0K thus rendering the two vibrations equivalent. We can therefore describe the two vibrations as being degenerate.
 |
 |
 |
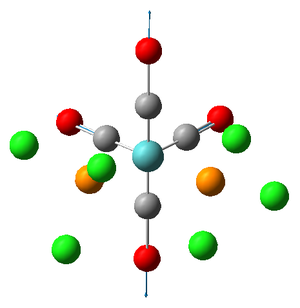 |
The literature value for the vibrational frequency for Co is 2143 cm-1; however, when coordinated to a metal the frequencies at which the stretches occur for the CO group decrease due to the introduction of back donation[3] from the metal. The larger the extent of the back bonding, the stronger the M-C bond as it obtains increased electron density but the weaker the CO bond, hence the decrease in frequency of the CO stretch. This allows us to determine which carbonyl groups possess the greatest extent of back donation. The carbonyls in the trans isomer all experience the same extent of back donation, deducible from the fact that the vibrations have equal frequency. The carbonyls in the cis isomer on the other hand have different degrees of back donation since they are not in the same environment, deducible from the different wavenumber values for the stretches. This differing environments is likely to be a results of trans effect[4] interactions with the phosphorous group. The expected effect of this would be to lengthen the trans CO bond, thus lowering its energy hence wavenumber which agrees with the annotations of the vibrations on association of the frequencies with each picture.
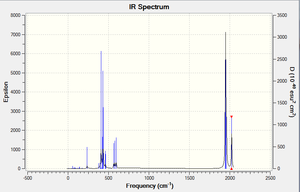
The IR spectra for both the cis and trans isomers have been provided above and upon observation of both it is apparent that the carbonyls in the trans isomer only give rise to one band, meanwhile those in the ciz isomer give rise to 4 bands. This can be explained using the above argument whereby all those carbonyls in the trans isomer are in the same environment and therefore the vibrations all overlap. Conversely, for the cis isomer, these bands do not overlap as the carbonyls are no longer in the same environment, hence giving rise to four distinguishable bands. allocated.
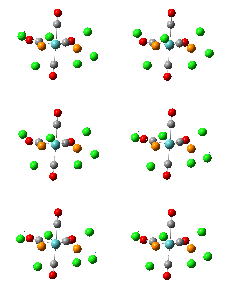
The Low frequency data for both isomers is supplied below to illustrate firstly that the optimisation process for each isomer has obtained a minimum (no negative values) and therefore we can conclude that we have obtained the optimised geometry. Secondly, we can see by observation of the vibrations that both the PCl3 groups are able to rotate in each isomer and at room temperature there would be sufficient energy to allow the Mo-P bond to fully rotate in both isomers. It is this phenomena that renders the vibrations degenerate in the trans complex.
|
|
|
|
The links to the frequency calculations for both isomers are provided below:
Mini Project: Observing the effect of changing the central metal in a bistriphenylphosphine complex
This project sets out to determine the effect of altering the central metal atom in the complex containing Bistriphenylphosphine ligands on the strength of the metal phosphorous bond ([M]-P) specifically using analysis of the corresponding IR stretch. The metals that will be tested are Gold (Au), Silver (Ag) and Copper (Cu), therefore the aim of this project is to identify how the bond strength is altered with increasing atomic weight (descending group 11).

Note that just like for the Molybdenum complexes, the phenyl groups have been replaced by Cl atoms in order to minimise the computational power required to run the calculations, thus decreasing the length of the optimisation process.
Hypothesis
It is believed that the strength of the bond will decrease as we descend the group because the atomic size of the metals will increase which in turn will mean that the metal orbitals become larger and more diffuse which gives rise to a poorer overlap with the phosphorous ligand orbitals. This means the bond length should be expected to increase, meanwhile the bond strength should decrease.
Optimisation Procedure
First the geometry of each structure was optimised using the DFT-B3LYP method accompanied by the medium LanL2DZ basis set which gives a moderately accurate value. Once this optimised structure had been achieved for each molecule, the advanced optimisation technique was employed to further improve the optimisation of the respective geometries of the structures.
Once the first optimisation has been performed an advanced optimisation will be executed in much the same way as for the Mo complexes described earlier. We know that the phosphorous atoms prefer to be hypervalent and like to use their low lying d atomic orbitals. In order to model this, one must use an advanced optimisation method which uses a superior basis set to improve accuracy. The issue with the LANL2DZ pseudo-potential and associated basis set is that they only consider valence s and p orbital functions and so cannot account for the tendencies of phosphorus mentioned above. The insertion of extrabasis into the line including the basis set information at the top of the gaussian input file as well as the following code
P 0 D
1 1.0 0.55
0.100D+01
into the bottom of the input file gives the programme the necessary information to model the hypervalent tendencies of phosphorous as well as the interaction of its low lying d atomic orbitals.
1st Optimisation data
GOLD Au.opt. File Name Au.opt_log_30126 File Type .log Calculation Type FOPT Calculation Method UB3LYP Basis Set LANL2DZ Charge 0 Spin Doublet E(UB3LYP) -238.17816604 a.u. RMS Gradient Norm 0.00000332 a.u. Imaginary Freq Dipole Moment 0.0002 Debye Point Group C1 Job cpu time: 0 days 0 hours 19 minutes 58.1 seconds.
Item               Value     Threshold  Converged?
Maximum Force            0.000009     0.000450     YES
RMS     Force            0.000004     0.000300     YES
Maximum Displacement     0.000255     0.001800     YES
RMS     Displacement     0.000083     0.001200     YES
Predicted change in Energy=-1.940485D-09
Optimization completed.
   -- Stationary point found.
Geometry Bond distances: Au-P = 2.48 Angstroms, P-Cl = 2.27 Angstoms Bond angles: Cl-P-Au = 111.511o, Cl-P-Cl = 107.36o
SILVER Ag_opt. File Name Ag.opt.log_30124 File Type .log Calculation Type FOPT Calculation Method UB3LYP Basis Set LANL2DZ Charge 0 Spin Doublet E(UB3LYP) -248.48615852 a.u. RMS Gradient Norm 0.00000289 a.u. Imaginary Freq Dipole Moment 0.0005 Debye Point Group C1 Job cpu time: 0 days 0 hours 13 minutes 39.4 seconds.
Item               Value     Threshold  Converged?
Maximum Force            0.000010     0.000450     YES
RMS     Force            0.000003     0.000300     YES
Maximum Displacement     0.000856     0.001800     YES
RMS     Displacement     0.000265     0.001200     YES
Predicted change in Energy=-4.086086D-09
Optimization completed.
   -- Stationary point found.
Geometry Bond distances: Ag-P = 2.62 Angstroms, P-Cl = 2.29 Angstoms Bond angles: Cl-P-Ag = 111.34o, Cl-P-Cl = 107.54o
COPPER Cu_Opt. File Name Cu.opt.log_30139 File Type .log Calculation Type FOPT Calculation Method UB3LYP Basis Set LANL2DZ Charge 0 Spin Doublet E(UB3LYP) -298.86561459 a.u. RMS Gradient Norm 0.00002524 a.u. Imaginary Freq Dipole Moment 0.0001 Debye Point Group C1 Job cpu time: 0 days 0 hours 10 minutes 45.9 seconds.
       Item               Value     Threshold  Converged?
Maximum Force            0.000040     0.000450     YES
RMS     Force            0.000026     0.000300     YES
Maximum Displacement     0.001144     0.001800     YES
RMS     Displacement     0.000567     0.001200     YES
Predicted change in Energy=-8.485141D-09
Optimization completed.
   -- Stationary point found.
Geometry Bond distances: Cu-P = 2.36 Angstroms, P-Cl = 2.29 Angstoms Bond angles: Cl-P-Cu = 109.88o, Cl-P-Cl = 109.07o
We can see from the data in this first optimisation that the complex with the copper central atom is the most stable with a total energy of -7.847E5kJ/mol, followed by the silver complex with a total energy of -6.524E5kJ/mol, closely followed by the gold complex with an energy of -6.25336E5kJ/mol. This complies with what was expected in the hypothesis in so much that the stability of the molecule decreases upon introduction of heavier atoms with larger atomic radius as we descend the group.
On the other hand, the bond lengths of the three complexes appear to disagree with the hypothesis. The data tells us that the Cu-P bond is the shortest as expected but that the Au-P bond is in fact shorter than that of the Ag-P bond. This phenomena disagrees with the hypothesis; however, if we recall that gold has f orbitals which neither the copper or silver atoms posses. As a result of the presence of these f orbitals, gold is able to undergo lanthanide contractions which significantly decrease the ionic radius of the atom resulting in a far smaller than otherwise expected atom. Consequently, the Au-P bond distance is also far smaller than would otherwise be expected.
Avanced Optimisation data
The geometry of all the molecules was noted and the output file was checked for each to ensure that the optimisation had converged for each calculation.
GOLD Geometry
Bond distances: Au-P = 2.46 Angstroms, P-Cl = 2.16 Angstoms; Bond angles: Cl-P-Au = 112.15o, Cl-P-Cl = 106.65o
Converged-YES, YES, YES, YES
SILVER Geometry
Bond distances: Ag-P = 2.65 Angstroms, P-Cl = 2.17 Angstoms; Bond angles: Cl-P-Ag = 113.05o, Cl-P-Cl = 105.70o
Converged-YES, YES, YES, YES
Copper Geometry
Bond distances: Cu-P = 2.34 Angstroms, P-Cl = 2.18 Angstoms; Bond angles: Cl-P-Cu = 110.18o, Cl-P-Cl = 108.76o
Converged-YES, YES, YES, YES
Problems Encountered
After collecting all the optimisation data from both the first optimisation and the advanced optimisation for each variation of the complex it was noticed on observation of the frequency data that the geometry had not in fact been minimised. This was highlighted by the low frequency data which for each complex gave several large negative values, indicative of a maximum as opposed to a minimum. This incidentally initiated an entire revisit to the optimisation procedure, performed exclusively for the Gold complex since it would be too time consuming to attempt to distinguish what exactly was being done wrong for each complex.
Low frequency IR analysis of the structures was used to give any hints as to what aspects of the geometry could be changed to derive the absolute optimised structure.
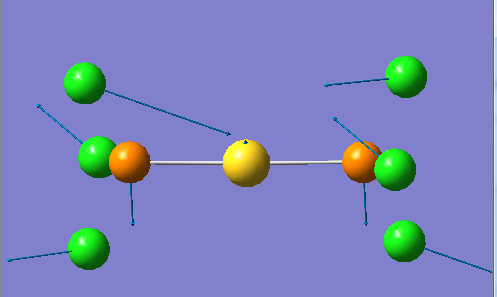
| Number | Frequency (cm-1,/sup> | intensity |
| 1 | 52.27 | 309.4 |
| 2 | 32.41 | 2.637 |
 1 1
|
 2 2
|
In vibrations 1 the Cl atoms on the left side converge and the Cl atoms on the right side diverge, meanwhile the central metal [M] and attached phosphorous atoms shift from side to side. This is an antisymmetric stretch. In vibration 2 there is a bending of the P-[M]-P bond. In addition the two lower left Cl atoms diverge while the upper left Cl moves in and out towards the metal centre, on the other side the two upper right Cl atoms converge while the lower right Cl atom moves in and out in a plane away from the metal centre.
These vibrations imply a desire for the molecule to bend. This information inspired the idea to optimise a bent version of the complex alongside a linear version in order to see if this were in fact the optimised geometry.
Remedy optimisation procedure
After realising that the first two optimisation procedures had failed to produce the optimised geometry for all three complexes the whole calculation was revisited and checked. Initially, all the structures had been drawn in as linear molecules with a P-[M]-P bond angle of 180o; however, the output files would return and this bond angle would change to a value only slightly below 180. Consequently, two new molecules were created, one linear and one bent with an P-[M]-P bond angle of 170, as the previous method was yet to provide the desired results. In addition to this, the charge of the complex was determined as it had been forgotten to insert this for the prior optimisation calculations. The gold complex was believed to have a 1+ charge, and is possible to deduce that the silver and copper complexes would posses the same charge. It must also be noted that the spin was set to singlet in the calculation since there are no half spin electrons in the complex and according to the following equation 2s=1 in which the spin (s) = o gives us 1, indicative of a singlet.
3rd optimisation: The bent molecule was transformed back into a linear molecule upon optimisation and the Cl atoms were obscurely orientated around the phosphorous groups with altering bond distances for each of the P-Cl bonds. Incidentally the total energy of this structure (-6.242E5kJ/mol) was higher than that of the linear structure (-6.249E5kJ/mol) so we could immediately discard this conformation after drawing the one useful piece of information that the linear structure does in fact posses the optimum geometry.
The summary data for the optimisation of both the linear and bent complexes are shown below:
Au.opt3.LINEAR File Name Au_LINEAR_log_30339 File Type .log Calculation Type FOPT Calculation Method UB3LYP Basis Set Gen Charge 1 Spin Singlet E(UB3LYP) -238.02123376 a.u. RMS Gradient Norm 0.00000683 a.u. Imaginary Freq Dipole Moment 0.0000 Debye Point Group C1 Job cpu time: 0 days 0 hours 19 minutes 20.6 seconds.
Au.opt3.BENT File Name Au_BENT_log_30340 File Type .log Calculation Type FOPT Calculation Method Basis Set Charge 1 Spin Singlet E(UB3LYP) -237.75647128 a.u. RMS Gradient Norm 0.00003129 a.u. Imaginary Freq Dipole Moment 0.0530 Debye Point Group C1 Job cpu time: 0 days 0 hours 28 minutes 25.7 seconds.
Again analysis of the IR data for what was belived to be the final attempt at optimising the linear complex showed that we had again approached a maximum instead of a minimum. The optimisation output .log file was checked thoroughly to ensure that the optimisation had converged which indeed it had, signified by four YES responses to the convergence criteria. Finally, cross comparison of the total energy values from the optimisation and its corresponding frequency analysis highlighted that the energies were different. This indicates that an element of human error was introduced by using the wrong file on which to perform the frequency analysis. The output files were again checked to match the total energy and the frequency analysis was performed one more time ensuring that the total energy of the molecule for which the analysis was run was exactly equal to that of the optimisation. The desired result was finally produced and the low frequency data to support the identification of a minimum and thus the optimised geometry of the molecule are shown below.
Below is proof that finally the desired molecule with the fully optimised geometry had finally been obtained. In other words instead of finding the turning point of a local minimum/maximum, we have now found the structure corresponding with the global minimum of the energy curve (the absolute minimum). The total energy of this structure is very similar to that of the previously determined structures in the initial optimisations with a value of -6.249E5kJ/mol.
Low frequencies --- -2.4597 -0.3410 0.0000 0.0000 0.0001 0.7508 Low frequencies --- 2.0539 25.1162 25.2102
This is the link for the frequency analysis
T2_Au_freq. File Name T2_Au_freq.log_30565 File Type .log Calculation Type FREQ Calculation Method RB3LYP Basis Set Gen Charge 1 Spin Singlet E(RB3LYP) -238.02123374 a.u. RMS Gradient Norm 0.00000684 a.u. Imaginary Freq 1 Dipole Moment 0.0001 Debye Point Group C1 Job cpu time: 0 days 0 hours 5 minutes 41.3 seconds.
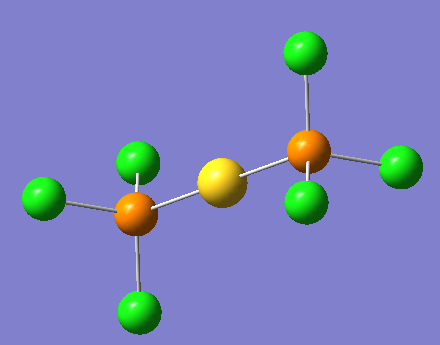
Eventually the optimised structure was discovered for the gold complex and this can be seen below from two different angles:
|

|
These images show that the molecule has adopted an antiperiplanar like geometry to minimise steric interaction between the chlorides giving a total energy of -6.249E5kJ/mol for the gold complex. The geometry fo the complex is as follows:
Bond distance: Au-P = 2.38 Angstroms, P-Cl = 2.06 Angstoms
Bong angle: Au-P-Cl = 112.8o, Cl-P-Cl = 106.0o
All of which are very similar to the geometry data obtained from the advanced optimisation. On this basis, it can be assumed that the general trends observed and reported on for the incorrectly optimised data should remain unchanged for the correctly optimised data and thus these observations should hold true. We can therefore conclude that the trend descending the group does not appear to agree with the concept that was hypothesised. This is especially obvious in the case of the gold complex where its Au-P bond length is significantly shorter than that of the Ag-P bond length in the silver complex. It would be interesting to examine the IR vibrations to allocate the stretch for this bond in order to determine if this difference in length is due to a difference in strength of the bond or simply the contraction in the gold atom as described earlier.
The MOs of the optimised molecule were calculated by changing the job type to energy and adding 'pop=full' in the additional key words tab. The natural bond orbital was also determined in this calculation by selecting the 'full nbo' tab.
The charge distribution of the Gold complex is illustrated in the picture below:
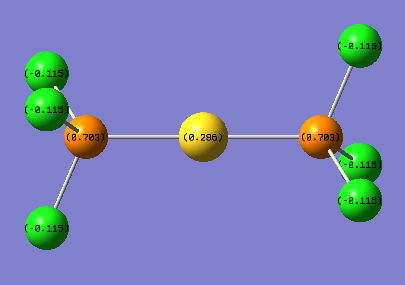
This is the link for the population analysis of the gold complex along with the MO data.
Conclusion
Ultimately, the use of computational methods such as those displayed in this module are especially useful to the inorganic chemist. This is perhaps best displayed by the ease with which the energy levels of an MO diagram can be accurately adjusted by use of the energy values for the individual MOs. Another highly employable feature is the facile nature in which the geometry of any complex or molecule can be optimised and from this it is possible to calculate a wealth of molecular data to any varying degree of accuracy by use of different basis sets.
References
- ↑ Fourier transform infrared spectroscopy of the BH3 V3 band, Kentarou Kawaguchi, Nobeyama Radio Observatory, Minamimaki, Minamisaku, Nagano 384-13, Japan
- ↑ J. Am. Chem. Soc., 1995, 117 (18), pp 5089–5104, Publication Date: May 1995 [1]
- ↑ Shriver and Atkins, "Inorganic Chemistry", Forth Edition, p.176
- ↑ Anderson, K. M.; Orpen, A. G. On the relative magnitudes of the cis and trans influences in metal complexes. Chem. Commun. 2001, 2682-2683.

