Mod5:mathieu.fox08
Module 1: The basic techniques of molecular mechanics and semi-empirical molecular orbital methods for structural and spectroscopic evaluations
Mathieu Fox
report address: http://pubs.acs.org/doi/pdfplus/10.1021/jo900196t
Section 1: The Hydrogenation of Cyclopentadiene Dimer
Cyclopentadiene can readily undergo a Diels-Alder cycloaddition with itself to produce a dimer which can take two isomeric forms. The exo and endo isomers are shown as molecules 1 and 2 respectively below.

ChemBioDraw Ultra 12.0 was used to draw the structure of the four molecules. The MM2 [1] function within the calculations tab was used to determine the minimum energy structure of each molecule.
| Dimer | Total Energy kcal/mol |
|---|---|
| Molecule 1 (exo) | 31.8817 kcal/mol |
| Molecule 2 (endo) | 34.0153 kcal/mol |
Observation of the total energy values for molecules 1 (exo) and 2 (endo) show that the exo product is the more stable thus the thermodynamic product, discernible due to its lower energy. This can be accounted for because the exo conformer has a less strained conformation; specifically, less torsion exists in the molecule. Despite this, we find that the endo product remains the major product. This becomes apparent on observation of the transition states below which show that there is a large amount of steric hindrance for the production of the exo product. Meanwhile, there is little steric hindrance present in the transition state for the endo product. It is deducible that the endo transition state has a lower energy, thus a lower Activation Energy and therefore it can be concluded that the reaction is governed by kinetics.

As for molecules 1 & 2, the total energy was found for molecules 3 & 4 using the MMS energy minimisation programme. The results below show that molecule 4 is the more thermodynamically stable product which results from hydrogenation. The most significant contribution to the energy difference is due to the bend energy (bond strain). It can be assumed that product 4 is less hindered than 3 using the argument that on hydrogenation a greater amount of bond strain is released in the formation of 4. This can be explained by observing discrepancies in bond angle at the sp2 carbons which in ideal conditions would have an optimum bond angle of 120. The observed bond angles for products 3 and 4 are roughly 107 and 112 respectively thus it is evident that 4 is nearer ideal conditions.
Molecule 3 Total Energy: 35.9304 kcal/mol
Molecule 4 Total Energy: 31.1556 kcal/mol
| Relative Contributions | Molecule 3 Energies (kcal/mol) | Molecule 4 Energies (kcal/mol) |
|---|---|---|
| Stretch | 1.2657 | 1.0973 |
| Bend | 19.8958 | 14.5063 |
| Torsion | 10.7752 | 12.4976 |
| 1,4 VDW | 5.6293 | 4.5127 |
| Total Energy | 35.6892 | 31.1539 |
Section 2: The Stereochemistry of Nucleophilic additions to a pyridinium ring (NAD+ analogue)
This section comprises two reactions which demonstrate nucleophilic additions to a Pyridinium ring at the 4- position.
Molecule 5:
The optically active derivative of Prolinol (N-methyl pyridoxasepinone,5) reacts with MethylMagnesium Iodide to alkylate the pyridine ring at the C(4) position. The MethylMagnesium Iodide is as a Grignard reagent in which the methyl group acts as a nucleophile attacking the pyridine ring in a regio- and stereo- selective manner. The mechanism for this reaction is shown below:

Shultz et al [2] suggest that the high regio- and stereoselection for addition of Grignard reagents to molecule 5 may be a result of coordination between the electropositive Mg atom on the Grignard reagent and the electronegative amide oxygen atom as shown in the mechanism above. Conjugate delivery of the organic ligand from magnesium to C(4) of the pyridine ring would generate the magnesium enolate again displayed in the above mechanism.
Different conformations of N-methyl pyridoxapinone (molecule 5) where created and a comparison of their total energies was conducted in order to determine the most stable conformation. The fundamental aim of this procedure was to deduce the position of the carbonyl group in this most stable conformer as it directly influences the outcome of the reaction. In order to achieve this, emphasis was placed on the geometry of the carbonyl bond of the amide in relation to the aromatic pyridinium ring by measuring the dihedral angle between the O atom of the carbonyl and the C(4) atom for each conformer.
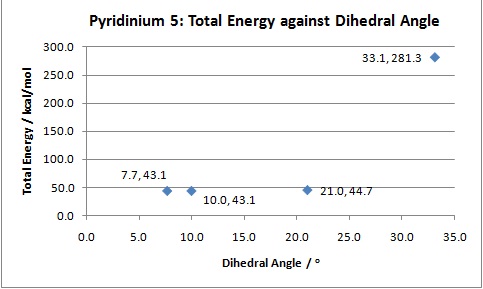
The results shown in the above plot illustrate that molecule 5 tends to exist with the oxygen of the carbonyl amide group angled upwards from the plane of the pyridine ring. This accounts for the stereochemistry of the product where the methyl is also located above the plane of the aromatic ring. This is due to the coordination[3] of the Grignard reagent with the oxygen during the reaction thus encouraging attack at C(4) from above.
Molecule 7
The reaction between PhNH2 (aniline) and N-methylquinolium (7)[4] is again regio- and stereo selective. The lone pair on the nitrogen in aniline permits it to act as a nucleophile, attacking at the C(4) position on the pyridine ring. The mechanism for this reaction is shown below:
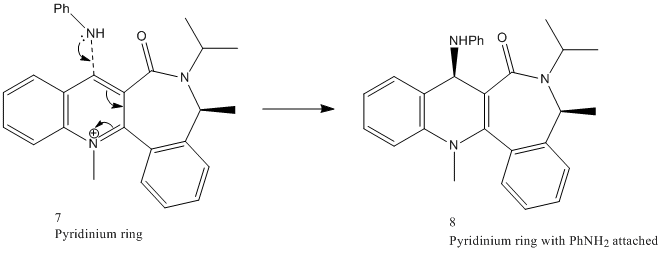
The reaction above illustrates that aniline reacts on the opposite face with respect to the C=O bond of the amide functionality. This phenomena can be attributed to steric control exerted by the C=O group on the large attacking amine [5].
As with molecule 5, the energies of the different N-methyl quinolinium were compared in order to determine the most stable conformation of the molecule. Furthermore, because the C=O bond of the amide functionality directly influences the stereocontrol of the reaction with aniline and thus the product formed, its geometry with respect to the aromatic pyridinium ring was monitored by measuring the dihedral angle between the carbonyl and C(4) on the aromatic ring. A plot of the resulting data is displayed below:
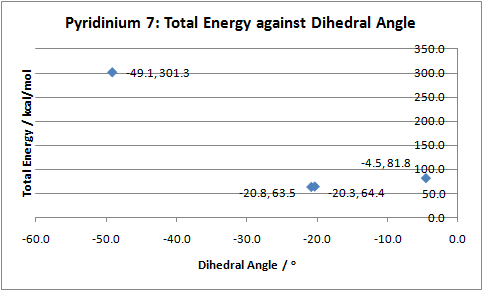
The above data illustrates that the C=O bond of the amide functionality tends to point downwards, below the plane of the aromatic ring. Using this observation to explain regio- and stero- selectivity, we can conclude that nucleophilic attack by aniline does not occur from the bottom face because the carbonyl exerts both electronic and steric hindrance. Consequently, the nucleophilic attack by the aniline occurs from the top face of the C(4) position.
The amine is located in the upper plane with respect to the aromatic ring because the steric repulsion exerted by the C=O group on the large attacking amine forces aniline to attack from the opposite side of the molecule, thus in the upper plane.
Possible Improvements
The molecular mechanics MM2 [6] force field calculation is considerably less accurate than other computational approaches and so if this were to be replaced by another more rigorous method the accuracy of the data produced would increase. Dewar's MOPAC[7] method and Pople's Gaussian[8] densitry functional theory (DFT)[9] method are both alternative methods with improved accuracy. Instead of MM2's force field approach, both methods consider molecular orbitals and electronic structure of the molecules and are therefore able to produce better energy calculations and geometry optimisations.
Furthermore, Gaussian has the capacity to minimise the energy of two molecules with respect to one another; this is especially useful when examining reaction mechanisms. Particularly so because it permits determination of the optimum conformation of the reactants, thus allowing determination of the regio- and stereo- chemistry of the reaction under consideration. Incidentally, ChemBioDraw Ultra 12.0 is unable to perform this for the reaction of molecule 5 with MethylMagnesium Iodide because Mg is not supported by the programme. The addition of the MeMgI molecule would however increase the total energy of the molecule upon energy minimisation. On the other hand, for the reaction between molecule 7 and aniline, the energy of the molecules are optimised individually instead of with respect to one another.
Both experimental procedures and computational analysis could be improved by introducing bulky groups to the molecule to render them less conformationally flexible. The effect of this would be to increase the energy barrier between ring-flipping of the cycloalkanes thus limiting interconversion of the conformers. Incidentally, the effect of adding bulky groups is also beneficial for computational techniques since it is easier to optimise the geometry and minimise the energy of a molecule when there is a favourable ring conformation.
Stereochemistry and Reactivity of an Intermediate in the Synthesis of Taxol
Atropisomerism
Atropisomers are a form of stereoisomer which result from hindered rotation about single bonds where the steric barrier to rotation is too great to allow interconversion thus isolating the conformers. The reaction scheme below is an example of two variations of the taxol molecule which exist as atropisomers:

| Taxol molecule isomer 9
|
Taxol molecule isomer 10
|
| Stretch / kcal mol-1 | Bend / kcal mol-1 | Stretch-Bend / kcal mol-1 | Torsion / kcal mol-1 | Non-1,4 VdW / kcal mol-1 | 1,4 VdW / kcal mol-1 | Dipole/Dipole / kcal mol-1 | Total Energy / kcal mol-1 | |
|---|---|---|---|---|---|---|---|---|
| Molecule 9 | 3.1830 | 18.8526 | 0.3241 | 20.7519 | 1.1801 | 15.0245 | -0.0541 | 59.2621 |
| Molecule 10 | 2.7462 | 15.8686 | 0.3578 | 17.4893 | 0.0876 | 12.8258 | 0.0579 | 49.4332 |
Comparison of the total energy of the taxol atropisomers, molecule 9 (59.2 kcal/mol) and molecule 10 (49.4 kcal/mol) indicates that molecule 10 is in fact considerably lower in energy therefore more stable and thus the thermodynamically favourable product. Upon observation of the above table it becomes apparent that the greatest contribution to this discrepancy in energy originates from the bending energy. Molecule 9 is found to have a significantly higher bending energy of 18.9 kcal/mol, meanwhile, molecule 10 has a value of 15.9 kcal/mol. This excessive strain present in molecule 9 is due to the fact that this isomer is locked in a strained high energy twist boat conformation in which the carbonyl is pointing above the plane of the ring, whereas molecule 10 exists with the low energy chair conformation in which the carbonyl group is pointing below the plane of the ring[10]. It can therefore be concluded that molecule 10 is the more stable of the two and that molecule 9 will spontaneously isomerise to form molecule 10 upon heating to overcome the energy barrier.
Hyperstability of 9&10
Hyperstable olefins are alekenes which are less strained than the saturated hydrocarbons which would form upon their hydrogenation [11]. Hyperstable alkenes are unreactive due to stability achieved by the cage structure of a trans-cycloalkene with at least 8 carbon atoms[12] and because of the greater strain in the parent alkene. This overall effect is to render them resistant to hydrogenation.
Modelling Using Semi-empirical Molecular Orbital Theory
Regioselective Addition of Dichlorocarbene
Molecule 12
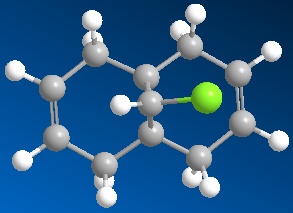
The reaction procedure below illustrates the regioselectivity of the addition of the Dichlorocarbene to the diene. Immediate observation highlights that the anti-alkene (that on the opposite side to the Cl) is reluctant to react with the dichlorocarbene, meanwhile, the syn-alkene (that on the same side as the Cl) readily reacts. Analysis of both the Molecular Orbitals (MO) and the Infra Red (IR) sprectra for this molecule are used to explain these phenomena.

 |
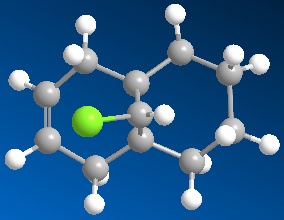 |
Diene shown above on the left, meanwhile the monoene is shown on the right.
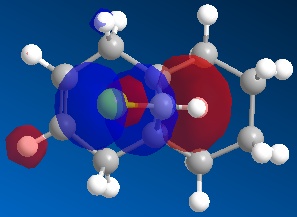
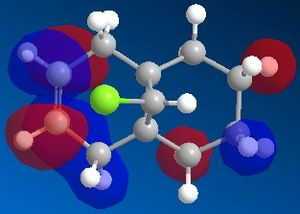
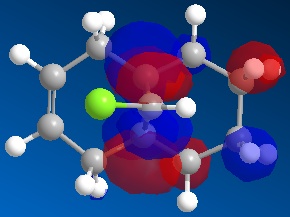
The reactivity, hence regioselectivity of the reaction of the diene with dichlorocarbene is determined by the Molecular Orbitals of the diene. The reaction proceeds via the nucleophilic attack of the diene on the electrophilic carbene molecule; therefore it is important to understand where the electron density is greatest in the nucleophile. The frontier orbitals (HOMO & LUMO) in particular are those which give most detail about the distribution of electron density in the molecule thus giving a good indication of where the reaction will occur most readily.
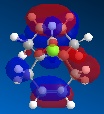
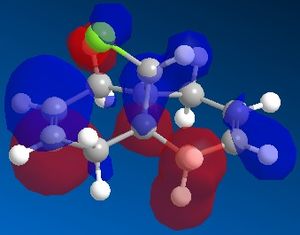
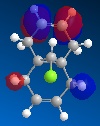
Observation of the HOMO in the picture below indicates that there is greater electron density located on the syn-alkene than the anti-alkene which renders this the more nucleophilic double bond. The carbene is electrophile so will attack the more electron rich site, so in this case the syn-alkene is the favourable site at which the reaction occurs.
Further to this, an antiperiplanar stabilising interaction acts upon the anti-alkene. The LUMO+1 MO diagram shows the C-Cl σ* meanwhile the HOMO-1 MO diagram shows the π orbital of the anti-alkene. These two orbitals undergo an interactive overlap who's overall effect is to lower the energy of the anti-alkene π orbital to a lower energy than that of the syn-alkene. Consequently, the anti-alkene π orbital is less reactive towards electrophilic attack due to its increased stability, hence will only react with a very strong electrophile.
 |
 |
 |
 |
 |
Hydrogenated anti (exo) Dichlorocarbene
 |
 |
 |
 |
Vibrational Frequencies
| Bend/Stretch | Frequency | Intensity |
|---|---|---|
| C-Cl stretch | 770.94 | 25.1083 |
| anti C=C stretch | 1737.17 | 4.2114 |
| syn C=C stretch | 1757.38 | 3.9342 |
| Bend/Stretch | Frequency | Intensity |
|---|---|---|
| C-Cl stretch | 779.80 | 21.4840 |
| anti C=C stretch | - | - |
| syn C=C stretch | 1757.38 | 3.9342 |
The table above shows that the IR value of the C-Cl[15] bond is strongly in accordance with the literature value of 760 cm-1 for both the diene and monoene[16]. Conversely, the calculated IR values for both the alkene[17] bonds are substantially higher than those in the literature which are reported to be 1640-1680 cm-1.
Remembering that E=hv and that v=c/λ we can rearrange to get E=h.c.ω where ω is the wavenumber. Using this rearrangement we can assume that the higher the wavenumber, the greater the bond energy and therefore stronger the bond which in turn means the bond is more stable. For the anti-alkene this can be described using the same argument as above involving the stabilising overlap. However, the IR data for the syn-alkene does not seem to adhere to the argument proposed earlier whereby the the anti-alkene was more stable than the syn-alkene. In actual fact, the IR data signifies that the syn-alkene gives rise to the peak with the higher wavenumber and is therefore the stronger, more stable bond. We can elucidate this disagreement with the earlier argument when we acknowledge that IR bond stretches depend on both the π and σ contributions to the bond as well as other external factors in the molecule, as opposed to earlier discussion where the stability of π-bonds was discussed exclusively to explain the reactivity. Incidentally, it is possible to conclude that the two arguments do not contradict one another as the π bond can be unavailable for electrophilic attack but the whole bond can still have lower energy. Thus the overall destabilisation of the anti-alkene bond must be explained by either effects in σ bonds or otherwise by an inherent destabilising effect in the molecule as the π bond is not responsible.
Finally comparison between the syn-alkene stretch for both the diene and monoene shows that they both produce a peak at a very similar frequency. This indicates that the anti-alkene has very little if not any effect on the strength of the opposite alkene bond.
Addition of Substituents to the Ring
Having determined the effect of the Chloro atom (located on the bridgehead of the molecule) on the alkene bonds, further investigation into the effect of adding substituent groups onto the ring was analysed. This was performed by addition of an electronegative OH group and an electropositive Silyl group to the anti-alkene and the resulting IR data was analysed to detect their respective influences on the stretching frequencies. The structure of the two new molecules are shown below with the OH substituted molecule on the left and the silyl substituted molecule on the right:
 |
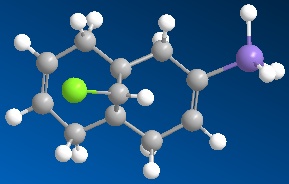 |
Comparison of Tables 6 and 7 for the IR of the substituted molecules with Tables 4 and 5 illustrates that the primary effect of adding the substituents is to lower the stretching frequency of both the C-Cl and C=C bonds, thus their strength and stability is also decreased. Unsurprisingly, the most substantial change in stretching frequency is observable in the anti-alkene to which the substituents are attached.
Similarly, the Silyl group lowers the frequency most significantly despite the fact that this group is Electropositive and should in actual fact increase the electron density in the C=C bond. This unexpected observation might potentially be due to the occurrence of electron donation from the π orbital of the C=C bond into a vacant d orbital on the Si atom thus reducing electron density and therefore also decreasing bond stability and strength.
Conversely, the Electronegative the OH group removes electron density from the bond as it is inherently inductively-withdrawing but it does also donate electron density by resonance. Incidentally, the overall effect of the OH groups causes the stretching frequency of the two alkene bonds to converge.
| Bend/Stretch | Frequency | Intensity |
|---|---|---|
| C-Cl stretch | 765.29 | 6.6635 |
| anti C=C stretch | 1753.29 | 59.3276 |
| syn C=C stretch | 1757.77 | 37.3881 |
| Bend/Stretch | Frequency | Intensity |
|---|---|---|
| C-Cl stretch | 763.83 | 17.4257 |
| anti C=C stretch | 1690.35 | 19.1383 |
| syn C=C stretch | 1756.25 | 5.5086 |
Structure based Mini project using DFT-based Molecular orbital methods: Tandem Wittig-Ene Reaction Approach to Kainic Acid
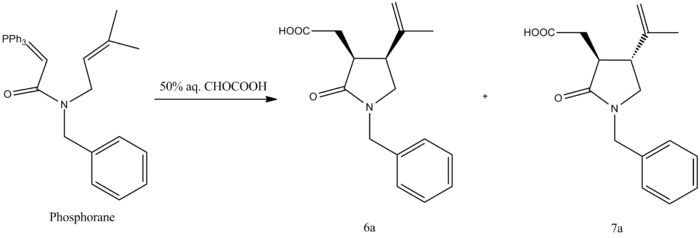
The mini project will discuss the tandem Wittig-intramolecular ene reaction step in the synthesis of kainic Acid peformed experimentally by M.S. Majuh et al[18]. This reaction involves the one-pot Wittig olefinations and ene reaction with glyoxalic cis to give the cis fused pyrrolidine skeleton of kainic acid but forms two diasterioisomers in the process.
The aim of this project is to use computational calculations of molecular properties, namely 13C NMR with which comparisons will be made with the experimental data of the two isomers in an attempt to characterise the two isomers.
Isomerism
The overall reaction shown below illustrates the two isomers which are formed, one taking the cis form of N-Benzyl-2-pyrrolidone 6a and the other, the trans form of N-Benzyl-2-pyrrolidone 7a.
| 6a |
|
7a |
|
The above Jmols show the 6a isomer on the left and the 7a isomer on the right.
The total energy for each isomer was determined using the MM2 force field method giving the following energy values for molecule 6a and 7a respectively: 11.8530 kcal/mol and 11.5686 kcal/mol. From this it is evident that 7a, the trans product is lower in energy and therefore more thermodynamically stable than 6a, the cis product. The difference in energy is so negligible though that it cannot be the sole factor influencing the 1:7 ratio produced experimentally for 6a:7a as determined from the H1 NMR in the report. If we use the following equation ∆G=-RTlnk coupled with the knowledge of the ratio of the product it is possible to determine the total change in Gibbs Free energy for the reaction; this comes to value of -4821.1 kJ/mol. This highlights the fact that the small energy difference between the product cannot exclusively account for the product ratio.
| Relative Contributions | Molecule 6a Energies (kcal/mol) | Molecule 7a Energies (kcal/mol) |
|---|---|---|
| Stretch | 1.2401 | 1.2940 |
| Bend | 9.4150 | 8.2819 |
| Torsion | -2.6845 | -1.8640 |
| 1,4 VDW | 10.7905 | 11.1288 |
| Total Energy | 11.8530 | 11.5686 |
As shown in the mechanism, two reactions, that is, the Wittig reaction and the intramolecular ene reaction, took place in a tandem fashion, yielding product 6a along with its thermodynamically more stable, trans analogue 7a in varying proportions. The mechanism can be observed below to clarify the way in which the reaction proceeds:
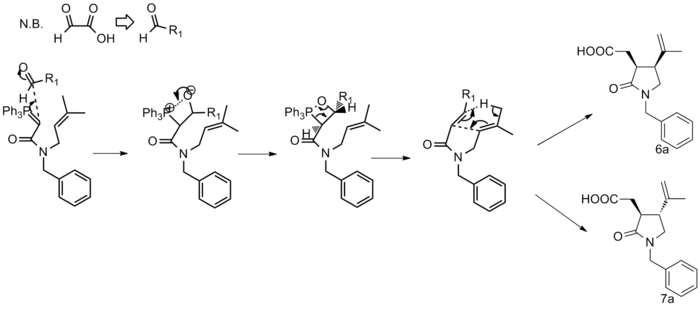

In order to try and evaluate the reason behind the unaccountable 1:7 ratio for the synthesis of the products, the transition states (TS) for the formation of the two products are shown in the thumbnail alongside. Here it is possible to see that the two TS occupy a twist boat formation which is why in the above table comparing torsion, bending and stretch energies shows little change between the two molecules; however, if we observe the steric interactions, it becomes apparent that in the TS which gives rise to 6a there is a significant 1,3 steric repulsion present between the upwards facing hydrogen and the R1 group. Meanwhile the TS which gives rise to 7a does not posses any such significant steric repulsions so can therefore be assumed to have lower energy thus possesses a lower energy of activation. On this basis, we can conclude that not only is the thermodynamic product predominantly produced but that the reaction is also governed by kinetic factors thus rendering 7a the substantial major product
C13 NMR data
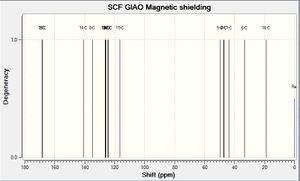
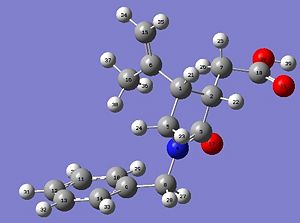
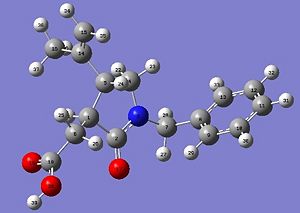
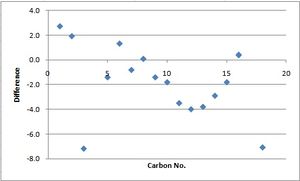
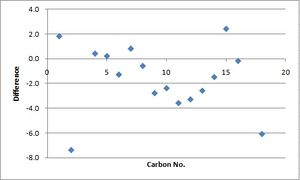
All the experimental data submitted in the literature report is displayed below with the 13C NMR data highlighted in bold. Alongside each set of data for the respective molecules is a thumbnail which shows a plot theoretically calculated NMR data. The following equation shall be used to modify the peak associated with the Amide carbon: δcorr = 0.96δcalc + 12.2. The amide carbons were found to be number 3 and 2 in 6a and 7a respectively and when operated on they give peaks of 173.7 and 173.8 which both correspond a lot better with the experimental data.

N-Benzyl-2-pyrrolidone (6a): Yield 60%; white crystalline solid, mp 113-114 °C. IR (ν max): 3485-2289, 1739, 1639 cm-1. 1H
NMR (CDCl3, 300 MHz): δ 1.48 (s, 3H), 2.47 (dd, J ) 4.5 Hz, 16.2 Hz, 1H), 2.71 (dd, J ) 8.7 Hz, 16.2 Hz, 1H), 3.10-3.22 (m, 3H), 3.51-3.56 (m, 1H), 4.50 (s, 2H), 4.75 (s, 1H), 4.85 (s, 1H), 7.29-7.38 (m, 5H). 13C NMR (CDCl3, 75 MHz): δ 19.7, 31.8, 41.1, 42.3, 47.2, 49.6, 115.6, 128.0, 128.7, 128.8, 135.3, 142.2, 175.0, 175.4. HRMS: m/z [M + Na]+ calcd for C16H19NO3Na, 296.1263; found, 296.1253.
Preparation of N-Benzyl-2-pyrrolidone (7a): IR (ν max):
3485-2289, 1739, 1639 cm-1. 1H NMR (CDCl3, 300 MHz): δ 1.70
(s, 3H), 2.64 (dd, J ) 4.8 Hz, 16.2 Hz, 2H), 2.74-2.83 (m, 1H),
2.89-2.93 (m, 1H), 3.10-3.16 (m, 1H), 3.30-3.36 (m, 1H), 4.42
(d, J ) 14.7 Hz, 1H), 4.57 (d, J ) 14.7 Hz, 1H), 4.85 (s, 1H), 4.87 (s, 1H), 7.24-7.36 (m, 5H). 13C NMR (CDCl3, 75 MHz): δ 19.2, 34.7, 41.7, 46.4, 47.0, 49.5, 114.0, 127.9, 128.1, 128.7, 128.8, 128.9, 135.5, 142.4, 174.3, 175.7. HRMS: m/z [M + Na]+ calcd for C16H20NO3NNa, 296.1263; found, 296.1260.
The 13C NMR was predcited using the Gauge Invariant Molecular Orbital (GIAO)[19] technique with Gaussian denisty functional theory (DFT)[20]. The specific method used was mPW1PW91 and the solvent was CDCl3.
 |
 |
| Carbon number | Calculated chemical shift (ppm) | Experimental chemical shift (ppm) |
|---|---|---|
| 3 | 168.2 | 175.4 |
| 18 | 167.9 | 175.0 |
| 6 | 143.5 | 142.2 |
| 9 | 133.9 | 135.3 |
| 10 | 127.0 | 128.8 |
| 14 | 125.8 | 128.7 |
| 11 | 125.2 | 128.7 |
| 13 | 124.2 | 128.0 |
| 12 | 124.0 | 128.0 |
| 15 | 113.8 | 115.6 |
| 5 | 48.2 | 49.6 |
| 8 | 47.3 | 47.2 |
| 1 | 45.0 | 42.3 |
| 2 | 43.0 | 41.1 |
| 7 | 31.0 | 31.8 |
| 16 | 20.1 | 19.7 |
| Carbon number | Calculated chemical shift (ppm) | Experimental chemical shift (ppm) |
|---|---|---|
| 2 | 168.3 | 175.7 |
| 18 | 168.2 | 174.3 |
| 14 | 140.9 | 142.4 |
| 8 | 134.9 | 135.5 |
| 13 | 126.2 | 128.8 |
| 9 | 125.9 | 128.7 |
| 10 | 125.7 | 128.1 |
| 12 | 124.6 | 127.9 |
| 11 | 124.3 | 127.9 |
| 15 | 116.4 | 114.0 |
| 5 | 49.7 | 49.5 |
| 4 | 47.4 | 47.0 |
| 7 | 47.2 | 46.4 |
| 1 | 43.5 | 41.7 |
| 6 | 33.4 | 34.7 |
| 16 | 19.0 | 19.2 |
The scatter graphs alongside the table represent a plot of the difference between the experimental NMR data and the calculated NMR data against the corresponding carbon atom. This difference was calculated by subtracting the experimental data from the theoretically calculated data. These spectra show that the experimental and theoretical NMR data for each molecule fit one another relatively accurately although it is clear that there are some discrepancies for both molecules. Due to the fact that there are discrepencies between the NMr data, it is not possible to comment on whether the disatereomers have been identified correctly. The most plausible reason behind this discovery is potentially due to the formation of alternative conformers of the two diastereomers. These would effect the experimental NMR by rendering them an average of these different isomers for each molecule, hence explaining why the NMR data does not appear to correlate exactly.
Conclusion
The computational methods used in this report were unable to accurately distinguish whether the two diasteromers had been differentiated between correctly in the journal; however, it seems fair to assume that it is highly likely that the correct conformations have been deduced. A possible improvement to the procedure would be to use Nuclear Overhauser effect spectroscopy (NOESY) as it is capable of determining correlations between atoms which are near one another in space, thus posses through-space coupling.
References
- ↑ 1.0 1.1 1.2 N.L.J. Allinger, CJ. Am. Chem. Soc., 1977, 99, 8127: DOI:10.1021/ja00467a001
- ↑ ↑ 12.0 12.1 A.G. Shultz, L. Flood, J.P. Springer, J. Org. Chem., 1986, 51, 838: [1]
- ↑ Y.H. Lai, Synthesis, 1981, 1981, 585: DOI:10.1055/s-1981-29537
- ↑ S. Leleu, C. Papamicaël, F. Marsais, G. Dupas, V. Leavacher, Tetrahedron: Asymmetry, 2004, 15, 3919: DOI:10.1016/j.tetasy.2004.11.004
- ↑ S. Leleu, C. Papamicaël, F. Marsais, G. Dupas, V. Leavacher, Tetrahedron: Asymmetry, 2004, 15, 3919[2]
- ↑ N.L.J. Allinger, CJ. Am. Chem. Soc., 1977, 99, 8127: DOI:10.1021/ja00467a001
- ↑ MOPAC2009, J.J.P. Stewart, Stewart Computational Chemistry, Colorado Springs, USA, 2008: web
- ↑ Gaussian 09, Revision A.1, M. J. Frisch, G. W. Trucks, H. B. Schlegel, G. E. Scuseria, M. A. Robb, J. R. Cheeseman, G. Scalmani, V. Barone, B. Mennucci, G. A. Petersson, H. Nakatsuji, M. Caricato, X. Li, H. P. Hratchian, A. F. Izmaylov, J. Bloino, G. Zheng, J. L. Sonnenberg, M. Hada, M. Ehara, K. Toyota, R. Fukuda, J. Hasegawa, M. Ishida, T. Nakajima, Y. Honda, O. Kitao, H. Nakai, T. Vreven, J. A. Montgomery, Jr., J. E. Peralta, F. Ogliaro, M. Bearpark, J. J. Heyd, E. Brothers, K. N. Kudin, V. N. Staroverov, R. Kobayashi, J. Normand, K. Raghavachari, A. Rendell, J. C. Burant, S. S. Iyengar, J. Tomasi, M. Cossi, N. Rega, J. M. Millam, M. Klene, J. E. Knox, J. B. Cross, V. Bakken, C. Adamo, J. Jaramillo, R. Gomperts, R. E. Stratmann, O. Yazyev, A. J. Austin, R. Cammi, C. Pomelli, J. W. Ochterski, R. L. Martin, K. Morokuma, V. G. Zakrzewski, G. A. Voth, P. Salvador, J. J. Dannenberg, S. Dapprich, A. D. Daniels, O. Farkas, J. B. Foresman, J. V. Ortiz, J. Cioslowski, and D. J. Fox, Gaussian, Inc., Wallingford CT, 2009: web
- ↑ JP. Hohenberg, W. Kohn, Phys. Rev., 1964, 136, B864: DOI:10.1103/PhysRev.136.B864
- ↑ 21.0 21.1 S.W. Elmore, L.A. Paquette, Tetrahedron Lett., 1991, 32, 319: DOI:10.1016/S0040-4039(00)92617-0 10.1016/S0040-4039(00)92617-0 10.1016/S0040-4039(00)92617-0 10.1016/S0040-4039(00)92617-0 10.1016/S0040-4039(00)92617-0
- ↑ W.F. Maier, P.v.R. Schleyer, J. Am. Chem. Soc., 1981, 103, 1891: DOI:10.1021/ja00398a003
- ↑ J.R. Wiseman, W.A. Pletcher, J. Am. Chem. Soc., 1970, 92, 956: DOI:10.1021/ja00707a035
- ↑ G. Socrates, Infrared and Raman Characteristic Group Frequencies, 3rd Edition, 2001, p. 65.
- ↑ G. Socrates, Infrared and Raman Characteristic Group Frequencies, 3rd Edition, 2001, p. 65.
- ↑ 6.0 6.1 IR Correlation Table[6]
- ↑ J. Coates, “Interpretation of Infrared Spectra, A Practical Approach", Encyclopedia of Analytical Chemistry, John Wiley & Sons Ltd, Chichester, 2000
- ↑ 6.0 6.1 IR Correlation Table[6]
- ↑ Mahesh S. Majik, Peruninakulath S. Parameswaran and Santosh G. Tilve J. Org. Chem., 2009, 74 (9), pp 3591–3594 Publication Date (Web): April 7, 2009 (Note) [DOI: 10.1021/jo900196t]
- ↑ R. Ditchfield, J. Chem. Phys., 1972, 56, 5688: DOI:10.1063/1.1677088
- ↑ JP. Hohenberg, W. Kohn, Phys. Rev., 1964, 136, B864: DOI:10.1103/PhysRev.136.B864
