Mod2422354
Module 2 - Inorganic Computational Lab
Introduction
This inorganic computational module aims to explore and analyse data which will give us a further comprehension of bonding and other interactions occurring between atoms. Gaussian was used to carry out the calculations, different methods and basis sets were experimented with to optimise different molecules.
Molecular orbital and natural bond orbital analysis will be studied as well as vibrational and frequency analysis to determine, for example, whether or not a transition state is present. Gaussview also allows us to view the infrared spectra of our molecules and see the different vibration modes.
This module is divided into two parts, the first consists of using computational techniques to familiarise ourselves with the study of molecules and then moving to more complicated systems. The second is a mini-project in which ionic liquids are used as examples to study how their structure is important.
Optimising a BH3 molecule
The first molecule optimised was a BH3 molecule, which has a relatively simple structure, it has a trigonal planar strucutre and is higly symmetric. The DFT/B3LYP method used and a 3-21G basis set was employed when running the optimisation. [1] Link to BH3 optimisation: http://hdl.handle.net/10042/20700
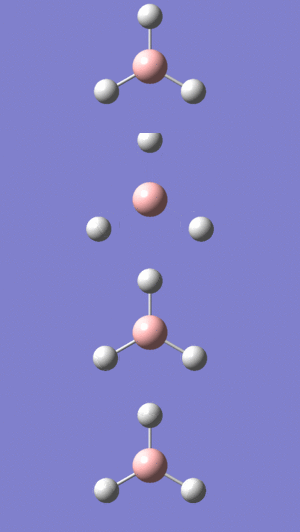
| File name | BH3 optimisation |
| File Type | .log |
| Calculation Type | FOTP |
| Calculation Method | RB3LYP |
| Basis Set | 3-21G |
| Charge | 0 |
| Spin | Singlet |
| E(RB3LYP) | -26.46226338 a.u. |
| RMS Gradient Norm | 0.00020672 a.u. |
| Imaginary Freq | |
| Dipole Moment | 0.0000 Debye |
| Point Group | D3H |
If the optimisation was succesful and is complete, the gradient should be close to 0, i.e. less than 0.001. We can see in table 1 above that it is the case - RMS Gradient: 0.00020672 Below is a section of the output file showing that the optimisation did converge. The log files are always checked to make sure the calculations were done properly and did not fail. Simply put, this means that for a small displacement the energy doesn't change.
          Item               Value     Threshold  Converged?
 Maximum Force            0.000413     0.000450     YES
 RMS     Force            0.000271     0.000300     YES
 Maximum Displacement     0.001610     0.001800     YES
 RMS     Displacement     0.001054     0.001200     YES
 Predicted change in Energy=-1.071764D-06
BH bond distance: 1.19349Å ± 0.05
HBH bond angle: 120.000° ± 0.05
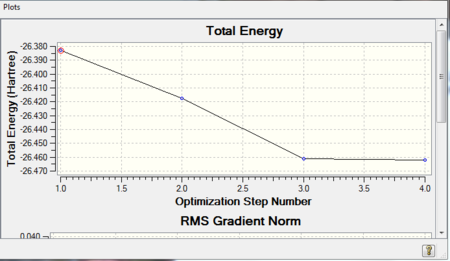

Electrons and nuclei are constantly trying to arrange themselves so that they are in their most stable form, i.e. there are no net forces acting in the molecule and we can say it's in equilibrium. This corresponds to the lowest energy position; when optimising a molecule, Gaussian is 'searching' for the structure which has the lowest energy.
When the molecules are not at this 'equilibrium point' there are forces acting on them and pushing them to different positions which in turn changes their energy. Thus, when the slope of the energy versus the change in position is zero we know that we are at equilibrium and that the best structure was obtained.
Figure 2 shows the steps involved in Gaussian trying to find the minimum energy structure by going through the potential energy surface of BH3, which we can see is approximately at -26.4608 a.u., the more precise value is: -26.46226338 a.u. which can be read off table 1.
What is a bond? After running several different calculations on Gaussian and analysing the different results, this question became a challenge. The usual picture we have in our heads of a chemical bond is generally not the most accurate one; sometimes after running an optimisation the molecule appeared to be missing bonds (see fig.1b below of ammonia borane). This occurs because gaussview 'creates' the bonds for us to see based on a defined distance criteria and so if the distance between two atoms is greater than this value it will look like there are no bonds. To find the value of this distance after which the bond is no longer a bond, we need to know the lowest energy configuration of the molecule since a bond will form if it is the most favourable state for the atoms which means that their energy is lower than it would be if they remained apart.

Optimising a BH3 molecule using a higher level basis set
This time, when optimising a BH3 molecule, a higher level basis set was used: 6-31G(d,p). This determines the accuracy with which the Schrodinger equation is solved, this basis set has a much higher accuracy than the 3-21G used in the previous optimisation above.
Link to optimisation: http://hdl.handle.net/10042/20701

| File Name | BH3 Optimisation_31g_dp-2 |
| File Type | .log |
| Calculation Type | FOTP |
| Calculation Method | RB3LYP |
| Basis Set | 6-31G(d,p) |
| Charge | 0 |
| Spin | Singlet |
| E(RB3LYP) | -26.61532374 a.u. |
| RMS Gradient Norm | 0.00010236 a.u. |
| Imaginary Freq | |
| Dipole Moment | 0.0000 Debye |
| Point Group | CS |
Below is a section of the output file showing that the optimisation was successful and converged.
Item               Value     Threshold  Converged?
 Maximum Force            0.000005     0.000450     YES
 RMS     Force            0.000003     0.000300     YES
 Maximum Displacement     0.000020     0.001800     YES
 RMS     Displacement     0.000012     0.001200     YES
 Predicted change in Energy=-1.312911D-10
 Optimization completed.
    -- Stationary
The optimised BH bond distance measured was 1.19232 Å ± 0.05 and the optimised HBH bond angle: 120.000° ± 0.05.
This is in agreement with the literature value. [2]
Total energy of 3-21g optimised structure: -26.46226338 a.u.
Total energy of 31g-dp optimised structure: -26.61532374 a.u.
Using pseudo-potentials on a larger basis set: TlBr3
TlBr3 optimisation: http://hdl.handle.net/10042/20444
| File Name | TlBr3 optimisation |
| File Type | .log |
| Calculation Mehod | RB3LYP |
| Basis Set | LANL2DZ |
| Charge | 0 |
| Spin | Singlet |
| E(RB3LYP) | -91.21812851 a.u. |
| RMS Gradient Norm | 0.00000090 a.u. |
| Imaginary freq | |
| Dipole Moment | 0.0000 Debye |
| Point Group | D3H |
Below is an excerpt of the log file showing that the placements are converged.
Item               Value     Threshold  Converged?
 Maximum Force            0.000002     0.000450     YES
 RMS     Force            0.000001     0.000300     YES
 Maximum Displacement     0.000022     0.001800     YES
 RMS     Displacement     0.000014     0.001200     YES
 Predicted change in Energy=-6.084033D-11
 Optimization completed.
    -- Stationary point found.
Optimised TlBr bond distance: 2.65095 Å ± 0.05
Optimised BrTlBr bond angle: 120.000° ± 0.05
This is quite close to the literature value of 2.512Å.[3]
BBr3 optimisation: http://hdl.handle.net/10042/20493
| File Name | logfile(11) |
| File Type | .log |
| Calculation Type | FOTP |
| Calculation Method | RB3LYP |
| Basis Set | Geb |
| Charge | 0 |
| Spin | Singlet |
| E(RB3LYP) | -64.43645277a.u. |
| RMS Gradient Norm | 0.00000384 a.u. |
| Imaginary freq | |
| Dipole Moment | 0.0002 Debye |
| Point Group | CS |
Item               Value     Threshold  Converged?
 Maximum Force            0.000008     0.000450     YES
 RMS     Force            0.000005     0.000300     YES
 Maximum Displacement     0.000036     0.001800     YES
 RMS     Displacement     0.000024     0.001200     YES
 Predicted change in Energy=-4.098477D-10
 Optimization completed.
    -- Stationary point found.
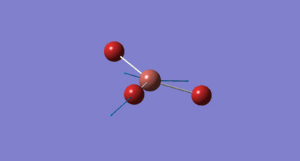
Optimised BBr bond distance: 2.02000 Å ± 0.05
Optimised BrBBr bond angle: 120.000° ± 0.05
These are in agreement with literature.[4]
The trend observed upon going from BH3 to BBr3 and then TlBr3 is that the bonds lengthen. This means that the bonds are getting weaker. The BH bond length is 1.19Å whereas the BBr bond length is 2.02Å; Br is left with 3 lone pairs after bonding to boron whereas this is not the case with 1s1 H, it is also a larger atom than hydrogen. We expect the orbital overlap to be poorer in BBR than BH as there an orbital size mismatch and hence weaker bonds. Upon changing the central atom to thallium the bond lengthening is even bigger: 2.65Å. Tl is in the same group as boron, it has 3 valence elctrons which are used up in bonding to the three Br atoms. In this case, however, Tl is much larger than Br hence its orbitals are more diffuse and there is again poor overlap and thus relatively weak bonds compared to BH3 where both atoms are similar in size.
Frequency Analysis for BH3
| File Name | Carolina_Bh3_freq4 |
| File Type | .log |
| Calculation Type | FREQ |
| Calculation Method | RB3LYP |
| Basis Set | 6-31G(d,p) |
| Charge | 0 |
| Spin | Singlet |
| E(RB3LYP) | -56.55776856 a.u. |
| RMS Gradient Norm | 0.00000885 a.u. |
| Imaginary freq | 0 |
| Dipole Moment | 1.8464 Debye |
| Point Group | C1 |
         Item               Value     Threshold  Converged?
 Maximum Force            0.000024     0.000450     YES
 RMS     Force            0.000012     0.000300     YES
 Maximum Displacement     0.000079     0.001800     YES
 RMS     Displacement     0.000053     0.001200     YES
 Predicted change in Energy=-1.629730D-09
 Optimization completed.
    -- Stationary point found.
 Low frequencies ---  -49.0720  -47.9624  -47.9619   -0.0054    0.1003    0.2313
 Low frequencies --- 1162.2158 1212.6569 1212.6596
 Harmonic frequencies (cm**-1), IR intensities (KM/Mole), Raman scattering
 activities (A**4/AMU), depolarization ratios for plane and unpolarized
 incident light, reduced masses (AMU), force constants (mDyne/A),
 and normal coordinates:
                     1                      2                      3
                    A2"                    E'                     E'
 Frequencies --  1162.2158              1212.6569              1212.6596
 Red. masses --     1.2531                 1.1072                 1.1072
 Frc consts  --     0.9973                 0.9593                 0.9593
 IR Inten    --    92.6277                14.0189                14.0225
  Atom  AN      X      Y      Z        X      Y      Z        X      Y      Z
     1   5     0.00   0.00   0.16     0.00   0.10   0.00    -0.10   0.00   0.00
     2   1     0.00   0.00  -0.57     0.00   0.08   0.00     0.81   0.00   0.00
     3   1     0.00   0.00  -0.57    -0.39  -0.59   0.00     0.14   0.39   0.00
     4   1     0.00   0.00  -0.57     0.39  -0.59   0.00     0.14  -0.39   0.00
| Mode number | Form of the vibration | Frequency (cm-1) | Literature value[5] | Intensity | Literature value | Symmetry
D3H point group |
| 1 | 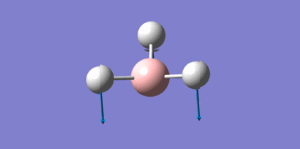 |
1162.22 | 1148 | 92.6277 | 88 | a2 |
| 2 | 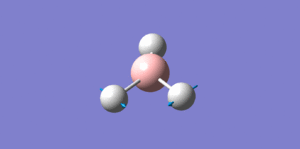 |
1212.66 | 1182 | 14.0189 | 14 | e' |
| 3 | 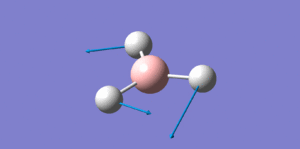 |
1212.66 | 1182 | 14.0225 | 14 | e' |
| 4 | 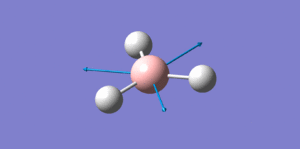 |
2584.99 | 2503 | 0.0000 | 0 | a1' |
| 5 |  |
2718.42 | 2597 | 126.2357 | 130 | e' |
| 6 |  |
2718.43 | 2597 | 126.2261 | 130 | e' |

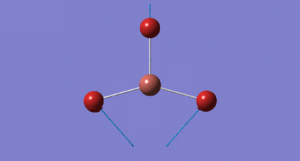
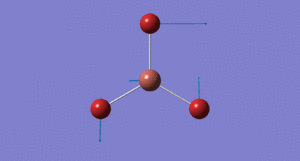
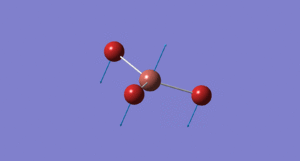
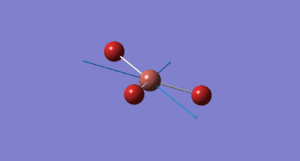
The reason why only three peaks can be seen the above spectra whereas there are clearly six different vibrations modes is because only three are active IR stretches. The E' vibrational modes are degenerate and hence only one peak is seen for each; additionally the a1' is totally symmetric, this means we cannot see it in the IR spectrum as it does not induce a dipole moment.
Frequency Analysis for TlBr3
| File Name | Carolina_TlBr3_freq |
| File Type | .log |
| Calculation Type | FREQ |
| Calculation Method | RB3LYP |
| Basis Set | LANL2DZ |
| Charge | 0 |
| Spin | Singlet |
| E(RB3LYP) | -91.21812851 a.u. |
| RMS Gradient Norm | 0.00000088 a.u. |
| Imaginary freq | 0 |
| Dipole Moment | 0.0000 Debye |
| Point Group | D3H |
Low frequencies ---   46.4289   46.4292   52.1449
 Harmonic frequencies (cm**-1), IR intensities (KM/Mole), Raman scattering
 activities (A**4/AMU), depolarization ratios for plane and unpolarized
 incident light, reduced masses (AMU), force constants (mDyne/A),
 and normal coordinates:
                     1                      2                      3
                    E'                     E'                     A2"
 Frequencies --    46.4289                46.4292                52.1449
 Red. masses --    88.4613                88.4613               117.7209
 Frc consts  --     0.1124                 0.1124                 0.1886
 IR Inten    --     3.6867                 3.6867                 5.8466
  Atom  AN      X      Y      Z        X      Y      Z        X      Y      Z
     1  81     0.00   0.28   0.00    -0.28   0.00   0.00     0.00   0.00   0.55
     2  35     0.00   0.26   0.00     0.74   0.00   0.00     0.00   0.00  -0.48
     3  35     0.43  -0.49   0.00    -0.01  -0.43   0.00     0.00   0.00  -0.48
     4  35    -0.43  -0.49   0.00    -0.01   0.43   0.00     0.00   0.00  -0.48
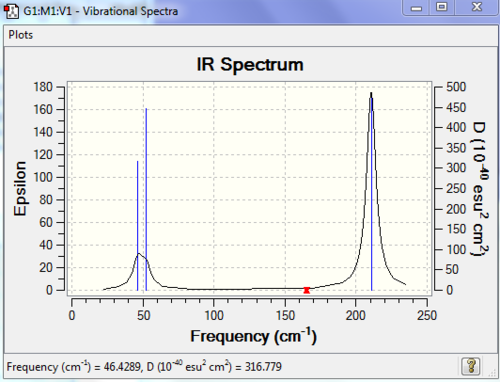
These values agree with literature.[6]
Low frequencies ---   -3.4213   -0.0026   -0.0004    0.0015    3.9367    3.9367
 Low frequencies ---   46.4289   46.4292   52.1449
 Harmonic frequencies (cm**-1), IR intensities (KM/Mole), Raman scattering
 activities (A**4/AMU), depolarization ratios for plane and unpolarized
 incident light, reduced masses (AMU), force constants (mDyne/A),
 and normal coordinates:
                     1                      2                      3
                    E'                     E'                     A2"
 Frequencies --    46.4289                46.4292                52.1449
 Red. masses --    88.4613                88.4613               117.7209
 Frc consts  --     0.1124                 0.1124                 0.1886
 IR Inten    --     3.6867                 3.6867                 5.8466
  Atom  AN      X      Y      Z        X      Y      Z        X      Y      Z
     1  81     0.00   0.28   0.00    -0.28   0.00   0.00     0.00   0.00   0.55
     2  35     0.00   0.26   0.00     0.74   0.00   0.00     0.00   0.00  -0.48
     3  35     0.43  -0.49   0.00    -0.01  -0.43   0.00     0.00   0.00  -0.48
     4  35    -0.43  -0.49   0.00    -0.01   0.43   0.00     0.00   0.00  -0.48
TlBr3 freq: http://hdl.handle.net/10042/20500
| 1162.22 | a2" | 52.14 |
| 1212.66 | e' | 46.43 |
| 1212.66 | e' | 46.43 |
| 2584.99 | a1 | 165.27 |
| 2718.42 | e' | 210.69 |
| 2718.42 | e' | 210.69 |
The lowest real normal mode for TlBr3 is 46cm-1 for the the e' vibrational mode. The two spectra have quite different frequency values although they look quite similar, i.e. they have the same vibrational modes. If we look at the frequencies for BH3 and TlBr3 we can see that the latter molecule has lower frequencies. There has also been a reordering of modes.
The large difference in frequency values indicates that even though both molecules have the same geometry and same vibrational modes, they are very different. Thallium is a much larger atom than boron and similarly bromine is a much larger atom than hydrogen. The fact that TlBr3 is a larger molecule and much heavier than BH3 is the main reason behind the fact that it has lower frequencies. This means that it has a larger reduced mass (μ) and thus a lower frequency.
For both spectra the a1' and e' lie close together but higher in energy than the a2 and e' because the first couple correspond to shortening and the lengthening of bonds where as the second couple correspond to atoms moving in different directions. Hence the first couple have a higher frequency value.
It is important that the same method and basis set are used throughout the different calculations if we want to be able to study the molecules and make comparisons. The low frequencies represent the motions of the centre of mass of the molecule, they correspond to the '-6' bit of the 3N-6 rule to figure out how many vibration modes a molecules will have where N is the number of atoms.
MOs
Link to population analysis of BH3: http://hdl.handle.net/10042/20510
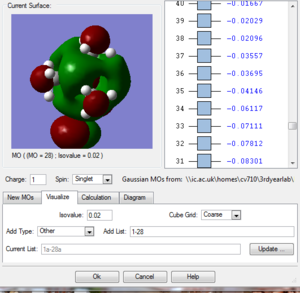
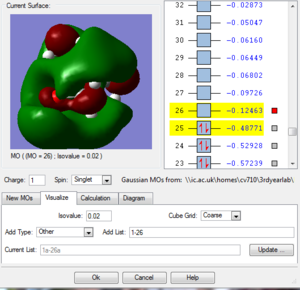
To obtain computed MOs the method used was still DFT/B3LYP but this time set to Energy and not Optimisation. In the additional keywords section the words pop=full were included and the option full NBO was also selected, this is done in order to turn on the MO analysis.
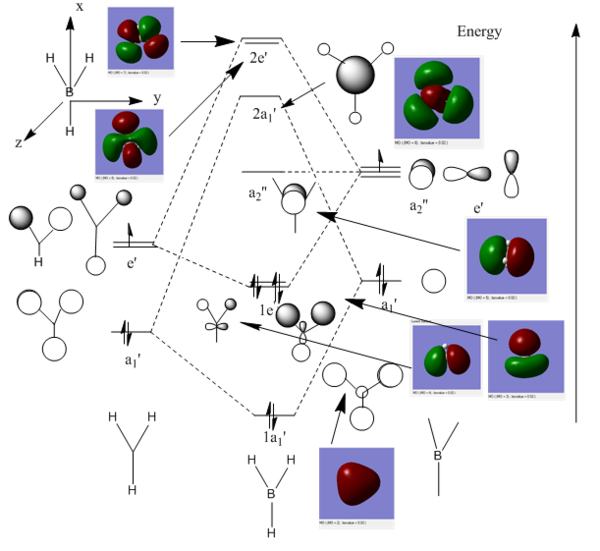
In fig.19 below we can see a valence molecular orbital diagram of BH3 with its different energy levels. The molecular orbitals were drawn using a linear combination of atomic orbitals, thanks to Gaussian we can now compare these with the computed MOs.
Firstly, I will describe the 3 bonding MOs, not including the core 1s MO as this is a valence MO diagram, followed by the 4 antibonding MOs.
The 1a1' computed MO is the all bonding combination, which is represented by the red triangle in the computed version. The 1e' is composed of two molecular orbitals, the first one has a phase pattern which is the same as that of the y axis and the second the same as the x axis. We can see that 2 of the hydrogen s orbitals overlap with the boron py to generate an MO that has two in-phase overlaps - this is represented by a red cloud and a green cloud. Similarly, 3 s hydrogen atomic orbitals overlap with the boron px orbital to give a bonding MO represented by a green cloud (which is slightly larger than the red cloud as two of the H s orbitals also overlap with each other, hence a bigger overlap). This is the highest occupied molecular orbital (HOMO) of BH3, as it's quite low in energy we expect that our molecule will not be willing to donate electrons easily. This makes sense since we know that boron is an electron deficient element.
The a2" MO is the lowest unoccupied molecular orbital, the fact that it is a non-bonding orbital tell us a lot about BH3. We know that it will very easily accept electrons, i.e. it tends to coordinate to other molecules and accept electrons into this empty orbital, forming adducts for example.
This MO has the same phase pattern as the z axis, which is why in the computed MO we see a red cloud next to a green cloud, this is viewed side on whereas the drawn MO is viewed along the z axis. If the computed MO were seen along the z axis we would see the green cloud cropping up behind the red cloud. The 2a1' MO is overall antibonding, the 3 s hydrogen orbitals have a different phase (green) than that of the boron atom (red). Finally, the 2e' MOs are overall antibonding with alternating phases.
We can conclude that LCAO is a good approach in determining the shape of the MOs, the drawn MOs do resemble the computed ones. Hence LCAO is a very useful way of trying to get an accurate and realistic picture of bonding interactions occurring within our molecule, drawing an MO diagram is another way of solving the Schrodinger equation.
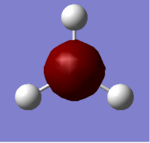
I have also included a picture of the boron 1s non-bonding atomic orbital purely for illustrative purposes.
NBO analysis

Before the natural bond orbital analysis could be carried out, a molecule of ammonia was optimised using the DFT/B3LYP method and a 6-31G(d,p) basis set. Below is the summary table and the output file showing that the optimisation was successful and the calculation converged. This was followed by a frequency analysis to ensure we have a minimum. After computing the molecular orbitals, the NBO analysis could be carried out.
Link to NH3 optimisation: http://hdl.handle.net/10042/20733
Optimised NH bond distance: 1.01799Å ± 0.05
Optimised HNH bond angle: 105.741° ± 0.05
         Item               Value     Threshold  Converged?
 Maximum Force            0.000024     0.000450     YES
 RMS     Force            0.000012     0.000300     YES
 Maximum Displacement     0.000079     0.001800     YES
 RMS     Displacement     0.000053     0.001200     YES
 Predicted change in Energy=-1.629727D-09
 Optimization completed.
    -- Stationary point found.
| File Name | NH3optimisation |
| File Type | .log |
| Calculation Type | FOTP |
| Calculation Method | RB3LYP |
| Basis Set | 6-31G(d,p) |
| Charge | 0 |
| Spin | Singlet |
| E(RB3LYP) | -56.55776856 a.u. |
| RMS Gradient Norm | 0.00000885 a.u. |
| Imaginary freq | 0 |
| Dipole Moment | 1.8464 Debye |
| Point Group | C1 |
Link to freq analysis: http://hdl.handle.net/10042/20734
| File Name | CAROLINA_NH3freq |
| File Type | .log |
| Calculation Type | FREQ |
| Calculation Method | RB3LYP |
| Basis Set | 6-31G(d,p) |
| Charge | 0 |
| Spin | Singlet |
| E(RB3LYP) | -56.55776856 a.u. |
| RMS Gradient Norm | 0.00000887 a.u. |
| Imaginary freq | 0 |
| Dipole Moment | 0.0000 Debye |
| Point Group | C1 |
 Low frequencies ---  -30.7927   -0.0010   -0.0006    0.0011   20.2690   28.2324
 Low frequencies --- 1089.5544 1694.1237 1694.1863
 Harmonic frequencies (cm**-1), IR intensities (KM/Mole), Raman scattering
 activities (A**4/AMU), depolarization ratios for plane and unpolarized
 incident light, reduced masses (AMU), force constants (mDyne/A),
 and normal coordinates:
                     1                      2                      3
                     A                      A                      A
 Frequencies --  1089.5544              1694.1237              1694.1863
 Red. masses --     1.1800                 1.0644                 1.0644
 Frc consts  --     0.8253                 1.8000                 1.8001
 IR Inten    --   145.4402                13.5557                13.5561
  Atom  AN      X      Y      Z        X      Y      Z        X      Y      Z
     1   7     0.12   0.00   0.00     0.00  -0.02  -0.06     0.00   0.06  -0.02
     2   1    -0.53  -0.21   0.00    -0.07  -0.04   0.73     0.25   0.14   0.19
     3   1    -0.53   0.11   0.18     0.25  -0.25  -0.02    -0.07  -0.61   0.40
     4   1    -0.53   0.11  -0.18    -0.18   0.51   0.18    -0.18  -0.42  -0.36
Link to NH3 MO analysis: http://hdl.handle.net/10042/20552
 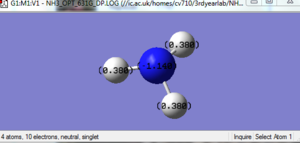 |
The nitrogen atom has a charge of -1.140 and the hydrogen atoms 0.380; this is expected since nitrogen is very electronegative.
NH3BH3
NH3BH3 optimisation: http://hdl.handle.net/10042/20736 NH3BH3 frequency analysis: http://hdl.handle.net/10042/20738

         Item               Value     Threshold  Converged?
 Maximum Force            0.000121     0.000450     YES
 RMS     Force            0.000057     0.000300     YES
 Maximum Displacement     0.000508     0.001800     YES
 RMS     Displacement     0.000294     0.001200     YES
 Predicted change in Energy=-1.611643D-07
 Optimization completed.
    -- Stationary point found.
| File name | NH3Bh3opti |
| File Type | .log |
| Calculation Type | FOTP |
| Calculation Method | RB3LYP |
| Basis Set | 6-31G(d,p) |
| Charge | 0 |
| Spin | Singlet |
| E(RB3LYP) | -83.22469032 a.u. |
| RMS Gradient Norm | 0.0005935 a.u. |
| Imaginary Freq | |
| Dipole Moment | 5.5648 Debye |
| Point Group | C1 |
BN bond length: 1.68747Å ± 0.05 BH bond length: 1.20875Å ± 0.05 NH bond length: 1.00275Å ± 0.05
HNH bond angle: 35.865° ± 0.05 HBH bond angle: 32.981° ± 0.05
Frequency Analysis
 Low frequencies ---    0.0009    0.0011    0.0011   18.5340   23.7773   41.0318
 A
 Frequencies --   266.2781               632.2307               639.8263
 Red. masses --     1.0078                 4.9939                 1.0453Low frequencies ---  266.2868  632.2307  639.8263
 Harmonic frequencies (cm**-1), IR intensities (KM/Mole), Raman scattering
 activities (A**4/AMU), depolarization ratios for plane and unpolarized
 incident light, reduced masses (AMU), force constants (mDyne/A),
 and normal coordinates:
                     1                      2                      3
                     A                      A
 Frc consts  --     0.0421                 1.1761                 0.2521
 IR Inten    --     0.0000                14.0032                 3.5517
  Atom  AN      X      Y      Z        X      Y      Z        X      Y      Z
     1   1     0.00   0.00  -0.45     0.37   0.01   0.00     0.58   0.17   0.00
     2   1     0.00  -0.39   0.22     0.35   0.00   0.00    -0.30   0.20  -0.02
     3   1     0.00   0.39   0.22     0.35   0.00   0.00    -0.29   0.20   0.02
     4   1     0.00   0.00  -0.36    -0.28   0.03   0.00     0.46   0.11   0.00
     5   1     0.00   0.32   0.18    -0.29  -0.01   0.03    -0.23   0.14   0.02
     6   1     0.00  -0.32   0.18    -0.29  -0.01  -0.03    -0.23   0.14  -0.02
     7   7     0.00   0.00   0.00     0.36   0.00   0.00     0.00  -0.05   0.00
     8   5     0.00   0.00   0.00    -0.48   0.00   0.00     0.00  -0.03   0.00
E(NH3)= -56.55776856 a.u. E (BH3)= -26.61532374 a.u. E(NH3BH3)= -83.22469032 a.u.
ΔE=E(NH3BH3)-[E(NH3)+E(BH3)]= -0.005159802 a.u. which is equivalent to -135.4706015kJ/mol
[7] The value above corresponds to the dissociation energy of NH3BH3.
Mini-project: Using Ionic Liquids as Designer Solvents
A comparison of nitronium, phosphonium and sulphonium cations is made in the first part of this mini-project. They were all firstly optimised using the DFT/B3LYP method and a 6-31G(d,p) basis set and turning off the symmetry (nosymm - to obtain the correct energy minimum) followed by a frequency analysis which was carried out to ensure each cation has a minimum i.e. all the frequencies are positive. After this, a Molecular orbital and Natural Bond orbital calculation was carried out for each cation. Both the nitronium and phosphonium cations adopt a tetrahedral geometry whereas the sulphonium cation has a lone pair thus adopting a pyramidal structure.
Each time the calculation converged, meaning the optimisation was successful. The corresponding frequency analysis for each molecule were equally successful.
[N(CH3)4]+
Link to optimisation: http://hdl.handle.net/10042/20739.
| File name | [N(CH3)4]+optimisation |
| File Type | .log |
| Calculation Type | FOTP |
| Calculation Method | RB3LYP |
| Basis Set | 6-31G(d,p) |
| Charge | 1 |
| Spin | Singlet |
| E(RB3LYP) | -214.18127170 a.u. |
| RMS Gradient Norm | 0.00013636 a.u. |
| Imaginary Freq | |
| Dipole Moment | 11.2875 Debye |
| Point Group | C1 |
Item               Value     Threshold  Converged?
 Maximum Force            0.000316     0.000450     YES
 RMS     Force            0.000083     0.000300     YES
 Maximum Displacement     0.001044     0.001800     YES
 RMS     Displacement     0.000334     0.001200     YES
 Predicted change in Energy=-8.995256D-07
 Optimization completed.
    -- Stationary point found.
We can see above the section of the output file which shows that the optimisation was successful, it converged. Furthermore, the gradient is less 0.001 (see table 1).
Link to frequency analysis:http://hdl.handle.net/10042/20748
| File name | Carolina_[N(CH3)4]+freq |
| File Type | .log |
| Calculation Type | FREQ |
| Calculation Method | RB3LYP |
| Basis Set | 6-31G(d,p) |
| Charge | 1 |
| Spin | Singlet |
| E(RB3LYP) | -214.18127170 a.u. |
| RMS Gradient Norm | 0.00013641 a.u. |
| Imaginary Freq | |
| Dipole Moment | 11.2875 Debye |
| Point Group | C1 |
 Low frequencies ---  -15.9313   -6.4345   -0.0009   -0.0005    0.0007    8.0946
 Low frequencies ---  183.5180  281.4500  288.2367
 Harmonic frequencies (cm**-1), IR intensities (KM/Mole), Raman scattering
 activities (A**4/AMU), depolarization ratios for plane and unpolarized
 incident light, reduced masses (AMU), force constants (mDyne/A),
 and normal coordinates:
                     1                      2                      3
                     A                      A                      A
 Frequencies --   183.4962               281.4475               288.2272
 Red. masses --     1.0079                 1.0330                 1.0331
 Frc consts  --     0.0200                 0.0482                 0.0506
 IR Inten    --     0.0000                 0.0000                 0.0001
  Atom  AN      X      Y      Z        X      Y      Z        X      Y      Z
     1   6     0.00   0.00   0.00     0.01  -0.01   0.00     0.02  -0.01   0.00
     2   1     0.25  -0.17   0.00     0.35  -0.25   0.00    -0.19   0.14   0.00
     3   1    -0.25  -0.09  -0.15    -0.31  -0.12  -0.21     0.25   0.07   0.13
     4   1     0.00   0.27   0.15     0.01   0.33   0.21     0.02  -0.25  -0.12
The frequency analysis is essentially the second derivative of the potential energy surface.By looking at the frequency analysis data above (table 2 and output excerpt) we can see that we have a minimum since the frequencies are all positive.
Link to MO pop analysis: http://hdl.handle.net/10042/20786
 |
 |
 |
 |
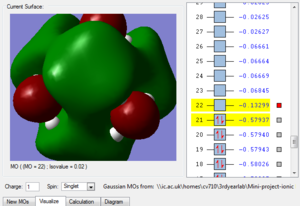 |
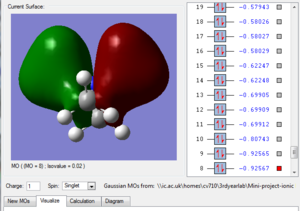
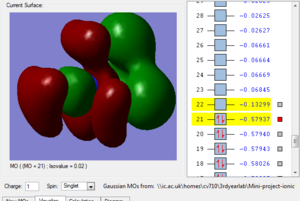
Fig.1 in table 3 above shows a bonding molecular orbital of the nitronium cation. The large clouds represent an overlap of orbitals giving rise to a bonding interaction. We can also see weak through space antibonding interactions, between the 'red cloud' and the 'green cloud' which have opposite phase, this isn't significant as the two aren't close to each other. Hence this MO is highly bonding.
Fig.2 shows another bonding MO, the large green cloud represents a region of strongly bonding overlap as well as the red cloud. However, there are some through space antibonding interactions as the phases alternate, still not very important as this MO is still very bonding but more significant than the previously described MO.
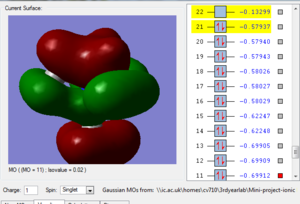
Fig. 3 is the MO just below the HOMO, we can see that it still overall quite bonding, strong bonding overlap represented by the two large clouds, as well as weaker bonding shown by the two smaller clouds. There are 4 through space antibonding interactions and two through space bonding interactions.
Fig.4 is the highest occupied molecular orbital and as we can see it is still bonding (large green and red clouds on the right showing strong bonding overlap) but the antibonding interactions have also increased. Each time the phase changes (colour change) there is a node, i.e. a region of zero electron density. These are unfavourable
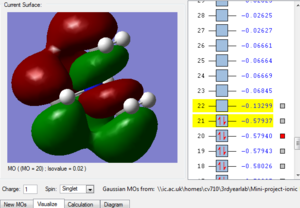
Fig.5 is the lowest unoccupied MO and has overall an antibonding character, there is bonding overlap but it's interspresed with bonding interactions of opposite phase, so there are 8 nodes.
How many and what kinds of nodes are there? How delocalised is the MO?)
P(CH3)4
Link to optimisation:http://hdl.handle.net/10042/20747
| File name | [P(CH3)4]+optimisation |
| File Type | .log |
| Calculation Type | FOTP |
| Calculation Method | RB3LYP |
| Basis Set | 6-31G(d,p) |
| Charge | 1 |
| Spin | Singlet |
| E(RB3LYP) | -500.82700328 a.u. |
| RMS Gradient Norm | 0.00000721 a.u. |
| Imaginary Freq | |
| Dipole Moment | 9.1167 Debye |
| Point Group | C1 |
         Item               Value     Threshold  Converged?
 Maximum Force            0.000009     0.000450     YES
 RMS     Force            0.000003     0.000300     YES
 Maximum Displacement     0.001045     0.001800     YES
 RMS     Displacement     0.000267     0.001200     YES
 Predicted change in Energy=-1.998404D-08
 Optimization completed.
    -- Stationary point found.
Link to frequency analysis: http://hdl.handle.net/10042/20746
| File name | Carolina_[P(CH3)4]+freq |
| File Type | .log |
| Calculation Type | FREQ |
| Calculation Method | RB3LYP |
| Basis Set | 6-319(d,p) |
| Charge | 1 |
| Spin | Singlet |
| E(RB3LYP) | -500.82700328 a.u. |
| RMS Gradient Norm | 0.00000722 a.u. |
| Imaginary Freq | 0 |
| Dipole Moment | 9.1167 Debye |
| Point Group | C1 |
Low frequencies ---   -0.0014    0.0031    0.0039   11.9293   11.9316   11.9342
 Low frequencies ---  169.1354  206.8878  206.8890
 Harmonic frequencies (cm**-1), IR intensities (KM/Mole), Raman scattering
 activities (A**4/AMU), depolarization ratios for plane and unpolarized
 incident light, reduced masses (AMU), force constants (mDyne/A),
 and normal coordinates:
                     1                      2                      3
                     A                      A                      A
 Frequencies --   169.1354               206.8865               206.8878
 Red. masses --     1.0078                 1.0254                 1.0254
 Frc consts  --     0.0170                 0.0259                 0.0259
 IR Inten    --     0.0000                 0.0000                 0.0000
 Raman Activ --     0.0000                 0.0000                 0.0000
 Depolar (P) --     0.0629                 0.7470                 0.7189
 Depolar (U) --     0.1184                 0.8552                 0.8365
  Atom  AN      X      Y      Z        X      Y      Z        X      Y      Z
     1   6     0.00   0.00   0.00    -0.02   0.00   0.01     0.00   0.02  -0.01
     2   1     0.00  -0.25   0.14    -0.02   0.04   0.01     0.00  -0.16   0.10
     3   1     0.24   0.08  -0.14    -0.06  -0.01   0.02     0.16   0.08  -0.13
     4   1    -0.24   0.17   0.00     0.00  -0.03   0.00    -0.17   0.15   0.00
Link to MO pop analysis: http://hdl.handle.net/10042/20748
S(CH3)3
Link to optimisation: http://hdl.handle.net/10042/20750
| File name | [S(CH3)3]+optimisation |
| File Type | .log |
| Calculation Type | FOTP |
| Calculation Method | RB3LYP |
| Basis Set | 6-31G(d,p) |
| Charge | 1 |
| Spin | Singlet |
| E(RB3LYP) | -517.68327886 a.u. |
| RMS Gradient Norm | 0.00002994 a.u. |
| Imaginary Freq | |
| Dipole Moment | 10.7124 Debye |
| Point Group | C1 |
         Item               Value     Threshold  Converged?
 Maximum Force            0.000029     0.000450     YES
 RMS     Force            0.000019     0.000300     YES
 Maximum Displacement     0.000442     0.001800     YES
 RMS     Displacement     0.000197     0.001200     YES
 Predicted change in Energy=-6.703667D-08
 Optimization completed.
    -- Stationary point found.
Link to freq analysis: http://hdl.handle.net/10042/20751
| File name | Carolina_[S(CH3)3]+freq |
| File Type | .log |
| Calculation Type | FREQ |
| Calculation Method | RB3LYP |
| Basis Set | 6-31G(d,p) |
| Charge | 1 |
| Spin | Singlet |
| E(RB3LYP) | -517.68327886 a.u. |
| RMS Gradient Norm | 0.00003001 a.u. |
| Imaginary Freq | 0 |
| Dipole Moment | 10.7124 Debye |
| Point Group | C1 |
Low frequencies ---  -12.7454   -8.8485    0.0044    0.0046    0.0050   23.2472
 Low frequencies ---  160.1132  195.7040  199.5356
 Harmonic frequencies (cm**-1), IR intensities (KM/Mole), Raman scattering
 activities (A**4/AMU), depolarization ratios for plane and unpolarized
 incident light, reduced masses (AMU), force constants (mDyne/A),
 and normal coordinates:
                     1                      2                      3
                     A                      A                      A
 Frequencies --   160.0282               195.6976               199.5234
 Red. masses --     1.0179                 1.0393                 1.0396
 Frc consts  --     0.0154                 0.0235                 0.0244
 IR Inten    --     0.0001                 0.0569                 0.0556
  Atom  AN      X      Y      Z        X      Y      Z        X      Y      Z
     1   6     0.00   0.00   0.02     0.04   0.00   0.00     0.00   0.00   0.01
     2   1    -0.25  -0.11  -0.14     0.04  -0.01  -0.01     0.37   0.19   0.27
     3   1     0.25   0.11  -0.14     0.06   0.00  -0.01    -0.36  -0.19   0.27
     4   1     0.00   0.00   0.34     0.03   0.03   0.02     0.00   0.00  -0.45
     5   6     0.00   0.01  -0.01    -0.02   0.01   0.00    -0.03   0.00   0.01
Link to MO pop analysis: http://hdl.handle.net/10042/20752
 |
 |
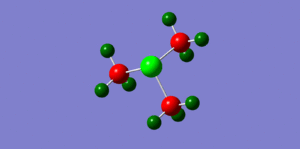 |
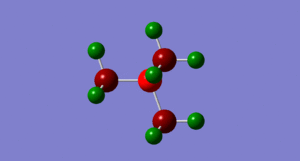
By looking at fig. 6 the results of the charge distribution from the NBO analysis are as expected, the central nitrogen atom is electronegative hence bright red (-0.396), the hydrogen atoms are highly electropositive and so are green whereas the carbon atoms, which are in between are dark red/wine coloured.
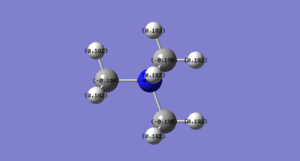
The phosphonium cation charge distribution (fig. )was also as expected, phosphorus is in the same group as nitrogen but just below it, i.e. it's electropositive and hence bright green(remembering that electronegativity is at its highest at the top right corner of the periodic table). Curiously, the hydrogen atoms appear to be a darker shade of green which would indicate that they are not as electropositive as in the nitronium cation; the charge numbers prove that they are in fact more electropositive (nitronium hydrogens: 0.182 whereas the phosphonium hydrogens: 0.193). The carbon atoms appear to be a brighter red which suggests they are slightly more electronegative; again confirmed by charge numbers (nitronium C: -0.196/ phosphonium C: -0.511) This is probably the case because they are bonded to a very positively charged phospohorus which is making the carbons less electropositive in comparison.
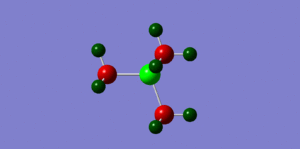
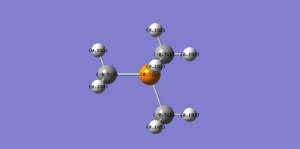
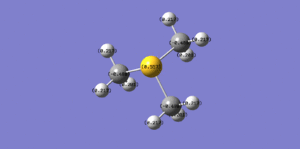
When looking at the sulphonium cation in fig. we can see the central sulphur atom is bright green like the phosphorus atom, both highly electropositive. However, the carbon atoms are a brighter shade of red than in the nitronium cation (for the same reason as in the phosphonium), they are more electronegative (-0.488). The hydrogen atoms are more electropositive than the nitronium and phosphonium hydrogens (0.217 compared to 0.182 and 0.193 respectively.
We can conclude that in the phosphonium and sulphonium cases the carbon atom contributes more to the CX bond as it's more electronegative. The opposite is true for in the nitronium cation, the nitrogen atom contributes more to the CX bond as it is more elctronegative. The image we usually have of a positive charge sitting on the N atom in a nitronium cation is not valid, clearly it is the most electronegative element. However, the positive charge can be drawn to just mean that it has lost and electron, thus making it a cation, not to say it has 'become positive' so to speak.
 |
 |
 |
Part 2: Study of the influence of functional groups
A molecule of [N(CH3)3(CH2OH)]+ was optimised using a 6-31G(d,p) basis set and the DFT/B3LYP method was used.
Link to CH2OH optimisation: http://hdl.handle.net/10042/20753
| File name | CH2OH optimisation |
| File Type | .log |
| Calculation Type | FOTP |
| Calculation Method | RB3LYP |
| Basis Set | 6-31G(d,p) |
| Charge | 1 |
| Spin | Singlet |
| E(RB3LYP) | -289.39472187 a.u. |
| RMS Gradient Norm | 0.00001599 a.u. |
| Imaginary Freq | |
| Dipole Moment | 6.8378 Debye |
| Point Group | C1 |
         Item               Value     Threshold  Converged?
 Maximum Force            0.000038     0.000450     YES
 RMS     Force            0.000007     0.000300     YES
 Maximum Displacement     0.000413     0.001800     YES
 RMS     Displacement     0.000103     0.001200     YES
 Predicted change in Energy=-1.195588D-08
 Optimization completed.
    -- Stationary point found.
Link to frequency analysis:http://hdl.handle.net/10042/20755
| File name | Carolina_CH2OH freq |
| File Type | .log |
| Calculation Type | FREQ |
| Calculation Method | RB3LYP |
| Basis Set | 6-31G(d,p) |
| Charge | 1 |
| Spin | Singlet |
| E(RB3LYP) | -289.39472187 a.u. |
| RMS Gradient Norm | 0.00001591 a.u. |
| Imaginary Freq | |
| Dipole Moment | 6.8378 Debye |
| Point Group | C1 |
Low frequencies ---  -10.7122   -0.0004    0.0006    0.0007   14.1937   20.2166
 Low frequencies ---  132.1185  215.5530  255.8822
 Harmonic frequencies (cm**-1), IR intensities (KM/Mole), Raman scattering
 activities (A**4/AMU), depolarization ratios for plane and unpolarized
 incident light, reduced masses (AMU), force constants (mDyne/A),
 and normal coordinates:
                     1                      2                      3
                     A                      A                      A
 Frequencies --   132.1072               215.5509               255.8809
 Red. masses --     2.1652                 1.1222                 2.7716
 Frc consts  --     0.0223                 0.0307                 0.1069
 IR Inten    --     5.1327                 4.0469                27.7968
  Atom  AN      X      Y      Z        X      Y      Z        X      Y      Z
     1   6     0.08  -0.01  -0.07     0.04  -0.01  -0.02    -0.03  -0.09   0.12
     2   1     0.27   0.06  -0.19    -0.20  -0.11   0.15     0.11  -0.03   0.08
     3   1    -0.07   0.13  -0.04     0.32  -0.17  -0.02    -0.22  -0.06   0.08
     4   1     0.09  -0.21  -0.03     0.02   0.24  -0.20    -0.02  -0.23   0.27
Link to MO pop analysis: http://hdl.handle.net/10042/20756
Link to CH2CN optimisation: http://hdl.handle.net/10042/20760
| File name | CH2CNopti |
| File Type | .log |
| Calculation Type | FOTP |
| Calculation Method | RB3LYP |
| Basis Set | 6-31G(d,p) |
| Charge | 1 |
| Spin | Singlet |
| E(RB3LYP) | -306.39376690 a.u. |
| RMS Gradient Norm | 0.00004759 a.u. |
| Imaginary Freq | |
| Dipole Moment | 3.7037 Debye |
| Point Group | C1 |
         Item               Value     Threshold  Converged?
 Maximum Force            0.000147     0.000450     YES
 RMS     Force            0.000025     0.000300     YES
 Maximum Displacement     0.001539     0.001800     YES
 RMS     Displacement     0.000319     0.001200     YES
 Predicted change in Energy=-7.869094D-08
 Optimization completed.
    -- Stationary point found..
Link to CH2CN freq: http://hdl.handle.net/10042/20765
| File name | Carolina_CH2CN freq |
| File Type | .log |
| Calculation Type | FREQ |
| Calculation Method | RB3LYP |
| Basis Set | 6-31G(d,p) |
| Charge | 1 |
| Spin | Singlet |
| E(RB3LYP) | -306.39376690 a.u. |
| RMS Gradient Norm | 0.00004740 a.u. |
| Imaginary Freq | 0 |
| Dipole Moment | 3.7037 Debye |
| Point Group | C1 |
Low frequencies ---   -3.0441    0.0005    0.0007    0.0010    7.4533   14.4504
 Low frequencies ---   91.3352  154.0982  210.6400
 Harmonic frequencies (cm**-1), IR intensities (KM/Mole), Raman scattering
 activities (A**4/AMU), depolarization ratios for plane and unpolarized
 incident light, reduced masses (AMU), force constants (mDyne/A),
 and normal coordinates:
                     1                      2                      3
                     A                      A                      A
 Frequencies --    91.3243               154.0981               210.6384
 Red. masses --     3.0819                 5.3797                 1.0648
 Frc consts  --     0.0151                 0.0753                 0.0278
 IR Inten    --     6.2111                 8.5329                 0.3333
  Atom  AN      X      Y      Z        X      Y      Z        X      Y      Z
     1   6    -0.07   0.02  -0.15     0.04   0.04  -0.20    -0.02   0.00  -0.02
     2   1    -0.26   0.06  -0.09     0.12   0.14  -0.29     0.21   0.09  -0.18
     3   1    -0.07  -0.01  -0.36     0.04   0.05  -0.10    -0.02  -0.01   0.28
     4   1     0.09   0.00  -0.09    -0.04  -0.07  -0.28    -0.27  -0.10  -0.17
Link to MO pop analysis: http://hdl.handle.net/10042/20766
We can see in table 5 above that the shape of the HOMOs and LUMOs quite significantly as one of the substituents is changed. The [N(CH2OH)]+ HOMO has many more through space antibonding interactions than the nitronium cation and hence is higher in energy, whilst the [N(CH3)3(CH2CN)]+HOMO has a less significant bonding overlap to begin with and is also hgher in energy than the nitronium HOMO.
The [N(CH2OH)]+ LUMO is slightly more antibonding than the LUMO of the nitronium cation, we can see that it has more nodes i.e. when the phase changes and the wavefunction goes to zero. The [N(CH2CN)]+ LUMO is quite similar to the nitronium LUMO even though it's less antibonding.
By simply looking at the pictures above it can be quite difficult to determine which is more bonding/antibonding than which as they are all very complex molecular orbitals with multiple bonding and antibonding interactions. This is why the energy values were written in the picture descriptions in table 5 above.
OH is an electron donating group through resonance thus we would expect it to have a relatively high energy HOMO so that it can donate electrons easily, which is the case as we can see by looking at the MO pictures and the computed MO energies.

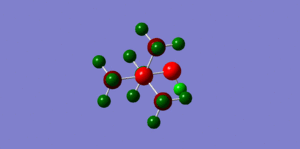
CN is an electron withdrawing group through resonance which means the nitrogen atom, being very electronegative, is pulling electron density away from the carbon atom and making it more electropositive (bright green) as we can see in figure 7 above. The oxygen atom on the OH group is very electronegative (bright red) which makes the proton attached to it much more electropositive than the other methyl protons, which is why it's bright green.
Conclusion
After analysing many different molecules, raging form small relatively simple ones to more complex ones, both in the first and second part of this module, it is clear that there are many properties which can be thoroughly studied using computational methods. The relative ease with which we can confirm if a calculation was successful, and therefore if the results obtained are valid, is what distinguishes computational labs from the typical experimental labs. Here we know when something has gone wrong and are able to correct it. Overall, the methods and basis sets used to carry out the different calculations were successful. This allowed for the structure and bonding of these molecules to be further explored.
Carolina Vieira CID: 00641284
References
- ↑ http://pubs.acs.org/doi/pdf/10.1021/ja00709a003
- ↑ http://144.206.159.178/ft/621/78706/14010584.pdf
- ↑ http://actachemscand.dk/pdf/acta_vol_36a_p0125-0135.pdf
- ↑ http://xray.uky.edu/people/parkin/papers/73_JOMCv666p103.pdf
- ↑ http://jcp.aip.org/resource/1/jcpsa6/v129/i22/p224308_s1
- ↑ http://pubs.acs.org/doi/abs/10.1021/ja00123a011
- ↑ http://www.nrcresearchpress.com/doi/abs/10.1139/v09-114#.UIE-8XiwWp0

