Mac716compphyslabreport
Exercise 1: H + H2 molecule
Question 1
Q: What value do the different components of the gradient of the potential energy surface have at a minimum and at a transition structure? Briefly explain how minima and transition structures can be distinguished using the curvature of the potential energy surface.
Minima
At a minimum, the gradient of the potential energy with respect to the inter-nuclear distance is zero and the second derivative is greater than zero:
eg. ∂V(r1)/∂r1=0 and ∂2V(r1)/∂r12>0 for r1
Hence the value(s) for r1 above at which the two conditions above are satisfied represent a minimum in potential energy ie. when the distance between C and the B-A product, r1, is so large that the potential energy interaction has reached a minimum.
Similarly, when ∂V(r2)/∂r2=0 and ∂2V(r2)/∂r22>0, the distance between A and the B-C molecule, r2, is so large that the potential energy interaction has reached a minimum.
Hence, minima can correspond to reactants, products or intermediates on the potential energy surface and a represented by point on the potential energy surface in which the potential energy is a minimum in all directions, q,: ie. ∂2V(q)/∂q20 [1]
Transition state
The tradition state is represented by a saddle point on the potential energy surface.
In the direction of the reaction pathway, q2 there is a maximum in potential energy: ie. [1]
∂V(q2)/∂q2=0 and ∂2V(q2)/∂q22<0 Condition 1
In the direction orthogonal to the reaction pathway q1, (as well as in all other directions), there is minimum in potential energy: ie.
∂V(q1)/∂q1=0 and ∂2V(q1)/∂q12>0 Condition 2
Hence, the transition point is given by the intersection point between this maximum and minimum which is given by condition 3:
∂V(q1)/∂q1 ∂V(q2)/∂q2=0 Condition 3
Hence, a transition pointe. a saddle point on the PES is given by a point at which the three above conditions are true. [1]
Question 2
Q:Report your best estimate of the transition state position (rts) and explain your reasoning illustrating it with a “Internuclear Distances vs Time” plot for a relevant trajectory.
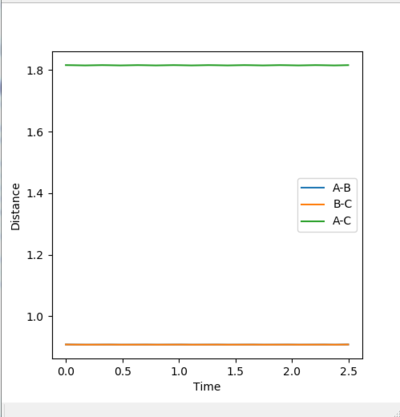
Different distances with r1=r2 and p1=p2=0 where tested for values ranging between 0.800 Å and 0.910 Å for r. The best estimate for the transition state position was found as rts=0.908 Å. At this distance, the "distance vs. time" plot shows 3 approximately flat lines. The A-B and C-B distance are equal at 0.908 Å (orange and blue lines are superimposed) and the lines are approximately flat suggesting that the A-B and C-B bonds (which do not vibrate since the system does not possess any kinetic energy) do not spontaneously alter in length significantly (so as to further decrease the potential and hence total energy of the system) when the A-B and B-C distances are equal at0.908 Å. The A-C distance is approximately 2(0.908)= 1.816 Å ie. twice the A-B distance. This line (green) is also approximately flat suggesting that the A-C distance does not fluctuate significantly around this value.
Hence, the presence of the flat lines on the "distance vs.time" plot suggest that at r1=r2=0.908 Å the atoms do not spontaneously move further/close to one another significantly so to decrease the potential energy of the system. This suggests that at this point, the system is very close to the transition energy state ridge ie. the saddle point on the PES.
Question 3
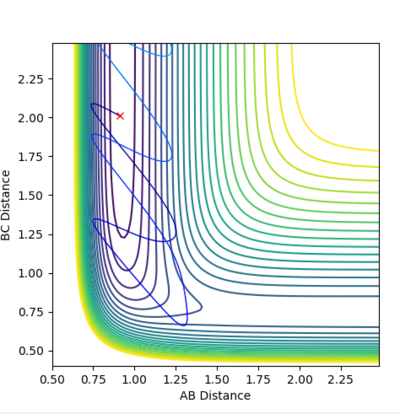
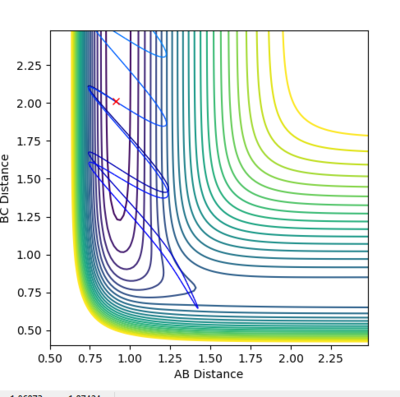
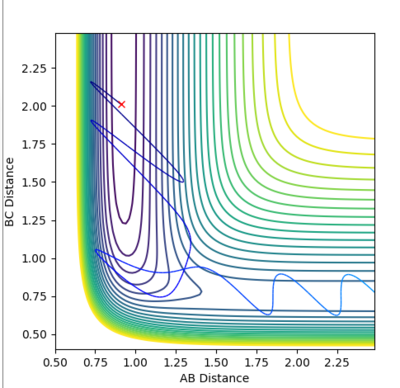
Q:Comment on how the mep and the trajectory you just calculated differ.
The MEP shows that the system tend moves towards the configuration with the lowest potential energy. When r1=0.918 Å and r2=0.908 Å, the A-B distance is smaller than the B-C distance. At each step the velocity is reset to zero so that the components do not accumulate any kinetic energy. Hence the system follows the lowest potential energy pathway and system 'rolls' down this curve to a configuration of lower potential energy at each step ie. C moves progressively further away from B-A to a lower energy state. The MEP shows that the system spontaneously moves to a lowest potential energy state even when the particles do not accumulate any momentum.
For the dynamics surface plot, the components of the system are able to accumulate kinetic energy: this means C is able to move away from the A-B molecule much more quickly than if the kinetic energy was set to zero after each step. Furthermore, in the dynamic model, the A-B bond fluctuates slightly around 0.908 Å (and hence possesses vibrational energy) whereas in the MEP model, the A-B bond does not fluctuate significantly around its mean bond length (as the system cannot accumulate any kinetic energy).
Jas213 (talk) 01:30, 29 May 2018 (BST) Why did you not provide any contour/surface plots here?
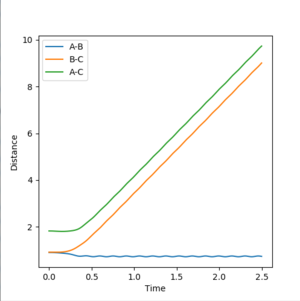
Internuclear distance vs. time:
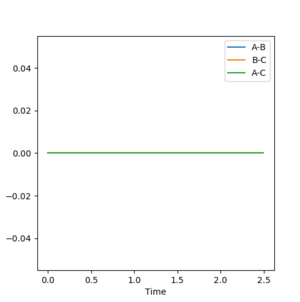
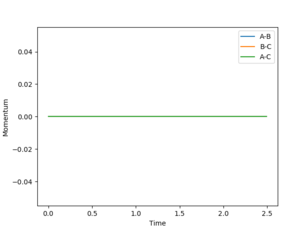
For the MEP "Internuclear distance vs. time" plot:
p1(2.5s)=0 p2(2.5s)=0
For the MEP model, A-B the bond length cannot vibrate significantly around its mean value since the vibrational energy is set to zero at each new step. The vibrational energy between the A-C and C-B atoms is also set to zero at each new step so the graph shows a superposition of three flat curves which do not show any significant amount of vibration and hence the change in momentum is zero at each point.
Jas213 (talk) 01:31, 29 May 2018 (BST) Label your plots, what property are you plotting here?
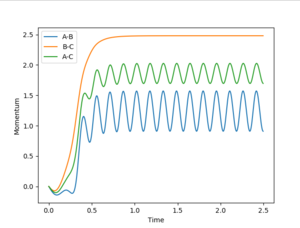
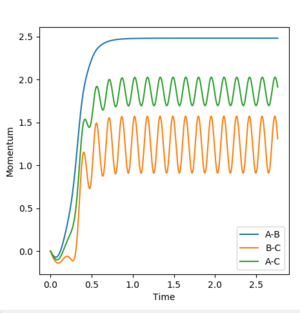
For the dynamic "internuclear distance vs. time" plot:
For the dynamic model , the A-B bond distance vibrates most significantly around its mean value. The C molecule has the greatest momentum suggesting it is away from the A-B molecule quickly.
p1(2.5s)=2.5 p2(2.5s)=0.9
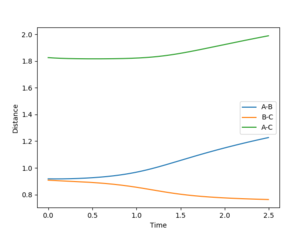
Distance vs. time:
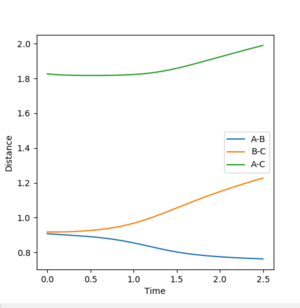
Mep "distance vs. time" plot:
For the mep model, the B-C and A-C distances increase less rapidly than in the dynamic model. At 2.5s, the distance between C and the B (from the B-A molecule) is 1.23 Å in the mep model and 9.03 Å in the dynamic model. This suggest that the C molecule moves away from the A-B molecule much more slowly than in the dynamic model. This is because in this model the kinetic energy of the C molecule is set to zero after each step. This suggest that the C molecule moves away from the A-B molecule purely on the basis of lowering the potential energy and hence the total energy of the system.
The r2 distance also decrease much more rapidly in the dynamic model: the mep model reaches r2=0.77 Å at approximately 2.0 s while the dynamic model reaches r2=0.77 Å at approximately 0.5s.
r1(2.5s)=1.23 Å
r2(2.5s)=0.77 Å
Dynamic "distance vs. time" plot:
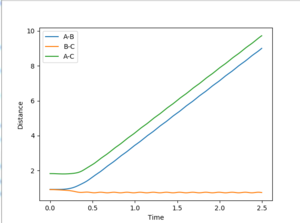
For the dynamic model, the B-C and A-C distances increase much more rapidly than in the mep model (the distance/time gradients in the dynamic model are much greater than those in the mep model). This suggests that in the dynamic model, the C molecule moves away from the A-B molecule much more quickly since it is able to accumulate kinetic energy and hence the potential energy of the system is decreased much more rapidly than in the map model. The A-B distance decreases much more quickly in the dynamic model (at approximately 0.5 s) than in the map model (at approximately 2.0 s) and the A-B bond vibrates around the 0.77 Å.
r1(2.5s)=9.03 Å
r1(2.5s)=0.77 Å
For both models, the r2 distance is 0.77 Å at 2.5s suggesting that ultimately after a very large number of steps in the mep model, the dynamic and mep model give the same r2 distances. It is expected that after an infinite number of steps, the r1 and r2 distances will be the same for both systems.
Reversing the directions
Ie. the distances r1=rts, r2=rts+ δ were used ie. r1=0.908 Å and r2=0.918 Å and p1=p2=0
Internuclear distance vs. time for mep plot:
Internuclear distance vs. time for dynamic plot:
The internuclear distance vs. time graph for the mep model shows 3 flat curves because the kinetic energy and hence vibrational energy is set to zero after each step. For the internuclear distance vs. time dynamic plot the A molecule moves quickly away from B-C while the B-C product molecule is in a excited vibrational state.
Distance vs. time for mep plot:
Distance vs. time for dynamic plot:
For the distances of r1=0.908 Å and r2=0.918 Å. In the mep model, the B-C bond distance decreases and the A-B bond distance increases spontaneously so as to decrease the potential energy of the system. The A-B bond distance increase much more rapidly than in the mep model since in the dynamic model the distance/time graph has a much steeper gradient. In dynamic model the B-C bond distance also decreases more rapidly than in the mep model and the bond vibrates around its mean value: : the mep model reaches r1=0.77 Å at approximately 2.0 s while the dynamic model reaches r1=0.77 Å at approximately 0.5s. Hence, the plots for the (r1=rts+δ, r2=rts) and the (r1=rts, r2=rts+ δ) give graph of the same shape (as if atoms the labels for atoms A and C were oppositely labelled).
Reactive and unreactive trajectories
For initial positions r1=0.74 Å and r2=2.0 Å
| Example | p1 | p2 | Total energy (kcal/mol) | Reactive or unreactive | Description of T | Contour plot | Inter-nuclear distance plot |
|---|---|---|---|---|---|---|---|
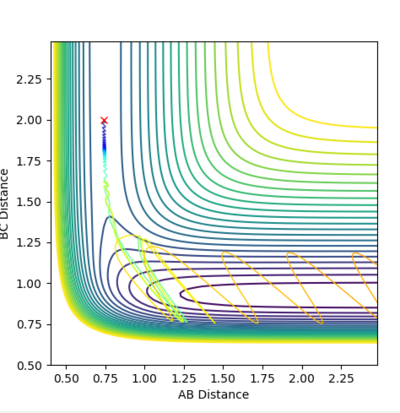
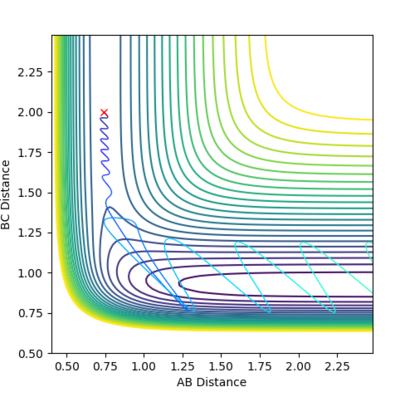
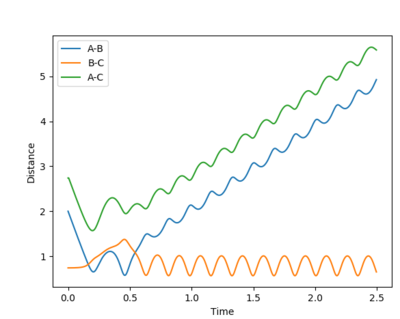
| Example 1 | -1.25 | -2.5 | -99.018 | Reactive | The digram shows the A molecule approaching the B-C molecule with mainly translational kinetic energy.. The collision between A and the B-C molecule passes over the saddle point to for a vibrationally excited A-B molecule and in which the C molecule moves progressively further away from the product A-B molecule. The distance vs. time plot suggests that the reactant molecules possess very little vibrational kinetic energy while the product molecule possess more vibrational energy. Hence, the reactants have enough translational and vibrational energy (p1=-1.25) for the reaction to be successful. [2] | 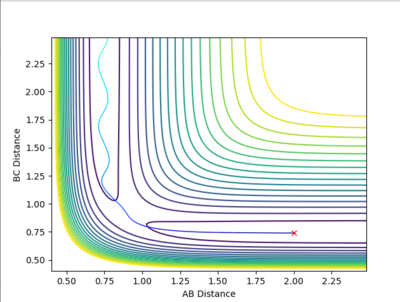 |

|
| Example 2 | -1.5 | -2.0 | -100.456 | Un-reactive | The reactants possess more vibrational energy than in the Example 1 since p2=-1.5. The reactants collide but the B-C molecule is vibrationally excited. A collision between the A and B-C molecule on this reaction pathway does not take the system to the saddle point and so no product molecule is formed. The reaction is unsuccessful and the B-C and A molecules more further apart once more. A possible explanation to this could be that the reactants do not possess enough translational energy in order to collide successfully to for a product molecule. [2] | 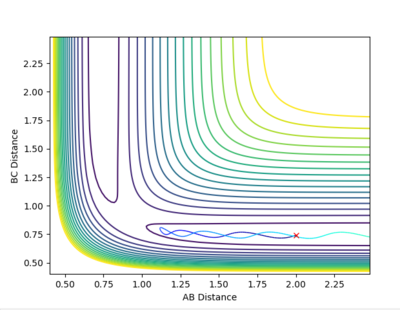 |

|
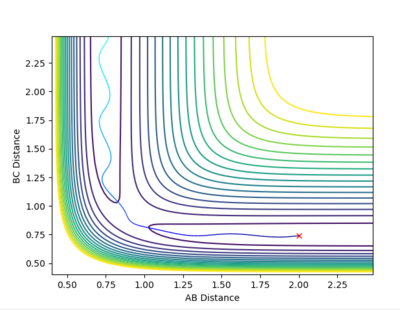
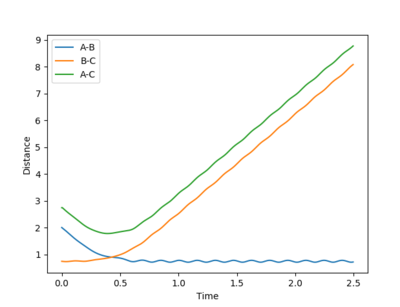
| Example 3 | -1.5 | -2.5 | -98.956 | Reactive |
The reactants possess the same amount of vibrational energy as in Example 2 (p1=-1.5) but the reactants in example 3 possess more translational kinetic energy than in example 2 since p2=-2.5 for this reaction. Unlike Example 2 this is a successful reaction. The reactants possess enough translational kinetic energy in order to collide successfully and for products. The A-B product molecules are in an excited vibrational state. [2] |
 |
|
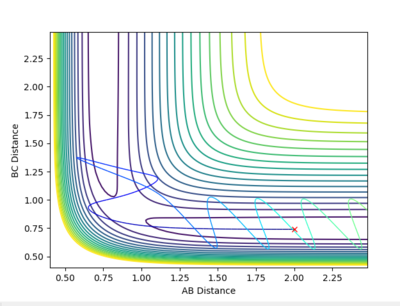
| Example 4 | -2.5 | -5.0 | -84.956 | Un-Reactive | Description
The incoming reactant molecule possesses mainly translational energy. The reactants pass through the transition state region. The B-C product has enough energy to recross the barrier region and reform the reactant molecules with excess vibrational energy. Transition state theory assumes that once a reactant crosses the transition state barrier it forms a “deactivated” product which can no longer re-cross the transition state energy barrier. This I usually a good approximation when the barrier is large compared to RT. However, this approximation is much less reliable when the barrier is low compared to RT. [3] [4] |
 |
|
| Example 5 | -2.5 | -5.2 | -83.416 | Reactive |
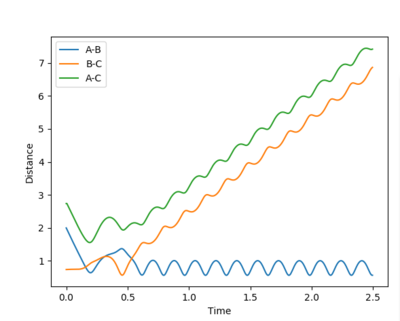
The reactant molecules have enough translational energy to cross the transition state region. The vibrationally excited product has enough kinetic energy to re-cross the barrier to re-form reactant which itself still has enough kinetic energy to re-crosses the barrier once more to form vibrationally excited product molecules. |
 |
|
p1 refers to vibrational energy and p2 refers to translational energy
All the systems have different total energy. The plots also suggest that the reaction is very sensitive to the initial reaction conditions. More specifically, a sufficient amount of total kinetic energy of the reactants does not guarantee that the reaction path will go through the transition state and go on to form products. Instead, the amount of vibrational and the amount of translational kinetic energy of the reactants determines whether or not a collision goes through the transition state to form products. [2]
Jas213 (talk) 01:35, 29 May 2018 (BST) What ratio of vibrational and translational E would you want in the above case? Very good and detailed description of each trajectory.
Three assumptions of transition state theory
State what are the main assumptions of Transition State Theory. Given the results you have obtained, how will Transition State Theory predictions for reaction rate values compare with experimental values?
The three assumptions of transition state theory are:
1. That the motion of the constituents of the system along the reaction coordinate can be described by classical mechanics (quantum effects are not considered by TST).
2. That the species in the system in the different energy states are populated according to the Boltzman distribution.
3. Activated complexes that cross the transition state barrier are assumed to go on to form products. In transition state theory, the product formed is assumed to be "deactivated" and barrier recrossing is not considered by TST. [5] [3] [3]
Transition state theory relies on the assumption that a potential energy surface defined in coordinate space can be used to calculate trajectories along which reactants pass through a transition state to form products without being able to turn back and reform reactants. Hence, transition state theory relies on the Born-Oppenheimer approximation and assumes that the energy of species along the reaction pathway is distributed according to the Boltzmann distribution. [6]
Transition state theory assumes that once a reactant crosses the transition state barrier it forms a “deactivated” product which can no longer re-cross the transition state energy barrier. This is usually a good approximation when the barrier is large compared to RT. However, this approximation is much less reliable when the barrier is low compared to RT. [3] Furthermore, when the mass of the atoms are very small, such as H, quantum effects such as tunneling can allow reactant species with insufficient energy to cross the energy barrier and form products. Tunneling effects are driven by quantum effects which are not regarded in TST. Hence tunneling effects increase the actual rate of reaction compared to the TST estimate of the reaction rate. However, product molecules with sufficient energy can re-cross the transition state energy barrier re-forming reactants - this is know as barrier recrossing. Barrier recrossing is not considered in transition state theory. Hence barrier recrossing decreases the actual reaction rate compared to the TST reaction rate. Since barrier recrossing effects occur much more frequently than tunneling effect, the actual experimental reaction rate is less than the TST estimate of the reaction rate due to more important barrier recrossing factors. [4]
Jas213 (talk) 01:35, 29 May 2018 (BST) Very detailed.
Exercise 2: F-H-H system
PES inspection
Question 1:
Classify the F + H2 and H + HF reactions according to their energetics (endothermic or exothermic). How does this relate to the bond strength of the chemical species involved?
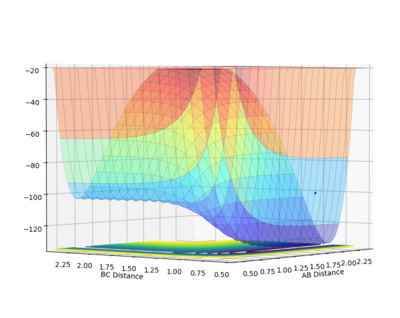
If atom A atom B and atom C represent H, H and F respectively: the potential energy surface shows that the potential energy of the system when the BC distance is very large compared to the AB distance, the system has a less negative potential energy. This suggest that the H2 + F is higher in energy. When the AB distance is very large compared to the BC distance, the potential energy of the system is lowered. This suggests that the H-F +H system is lower in energy than the H2 + F system. Hence the reaction F+ H2 --> H + H-F is an exothermic reaction and the H + H-F --> F+ H2 reaction is endothermic.
The H-H bond and H-F bond have ΔHo=436 kJ/mol and 565kJ/mol respectively. [7] For the H2 + F --> H-F + H, the ΔHorxn=436-565=-129 kJ/mol.Hence, this reaction is exothermic as heat is released to the surroundings.
For the H-F + H --> H2 + F reaction, ΔHorxn' =565-436=129 kJ/mol which is an endothermic reaction.
Potential energy surface for the A-B + C system where A, B and C represent H, H and F respectively:
Question 2:
Locate the approximate position of the transition state.
Because the H2 + F --> H-F + H reaction is exothermic, from Hammond's postulate, it is expected that the energy of the transition state will resemble that of the reactants more closely then that of the reactants ie. an early transition state is expected. The location of the transition state was found by manipulating the H-H distance (increasing between 1.0 and 0.5 Å) and B-C distance(decreasing between 1.5 and 2.0 Å) simultaneously. An estimate for the transition state position was found at H-H(A-B)=0.745 Å and H-F(B-C)=1.810 Å. At this point, the Internuclear distance vs. time graph shows three flat curves suggesting that a this point the atoms do to vibrate of diviate much from these bond distances ie. that the atoms are not moving so as to decrease the potential energy of the system and hence suggesting that this point is very close to the saddle point on the PES (transition state).
Question 3:
Report the activation energy for both reactions.
Finding the activation energy for the exothermic H2 + F --> H-F + H reaction:
The H-H bond distance was decreased slightly away from the stationary point (by decreasing the H-H bond distance by 0.01 so as to shift the system slightly towards the left of the stationary point.
Activation energy for the H2 + F --> H-F + H reaction:
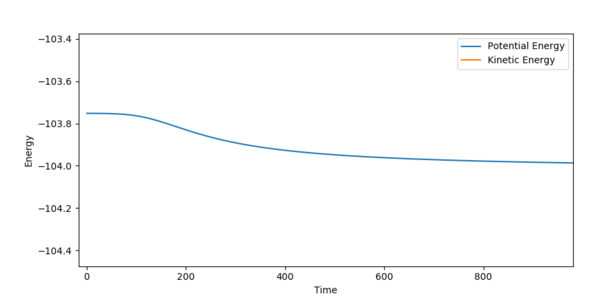
AB(HH):0.745 Å BC(HF):1.820 Å, (MEP, 200000 steps)--> Activation energy=-103.751-(-103.986)=0.235 kcal/mol
Finding the activation energy for the endothermic reaction H + H-F --> H2 + F reaction:
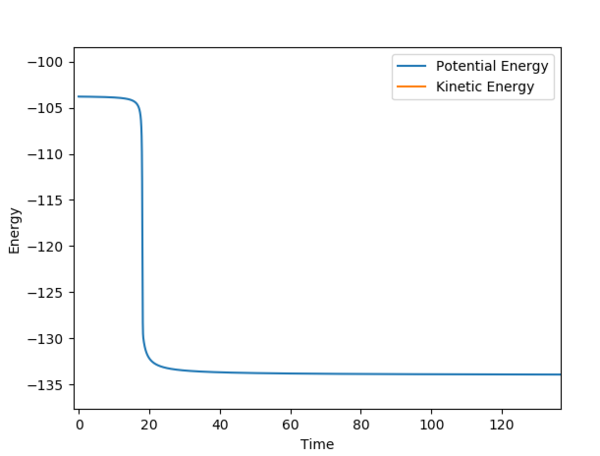
Have decreased slightly the B-C distance to lit the equilibrium to the H + H-F side of the stationary point. (AB)=0.745 Å and BC(HF)=1.700 Å , (MEP, 50000 steps)---> Potential energy=-104.163-(-133.076)=28.913 kcal/mol
The plots suggest that the activation energy for the exothermic reaction (H2 + F --> H-F + H) is very small compared to the activation energy for the endothermic (reverse) reaction (H + H-F --> H2 + F).
Reaction dynamics
Question 1:
In light of the fact that energy is conserved, discuss the mechanism of release of the reaction energy. How could this be confirmed experimentally?
Initial conditions of rH-H=0.74 and rH2-F=2.0 with p(AB)=-0.0 and p(BC)=-0.375. This gave a successful reaction.
Contour plot:
Internuclear momenta vs. time plot:
The formation of the H-F bond via an exothermic reaction. This energy is released as vibration and translational energy (ie. kinetic energy). The intermolecular momentum plot shows that the translational energy increases from 0.0 to approximately 2.5 as the B-C product moves away from the A molecule. The B-C molecule formed has a large amount of vibrational energy and so is vibrationally excited (orange curve shows the vibrational excitation of the B-C product molecule). The plot further suggest that more energy is release as vibrational energy than as translational energy for this exothermic reaction.Experimentally, this could be confirmed using IR spectroscopy. One would expect to see a main peak in the IR spectrum with several lower energy overtones. The greater the intensity of the overtones in the IR spectrum, the more vibrationally excited the product molecule formed.
For the initial condition of r(AB)=0.74, r(BC)=2.0 and p(B)=-0.5, values of p(AB) were tested between -3 and 3.
| p(AB) | Reactive or unreactive | Contour plot |
|---|---|---|
| -3 | Unreactive | 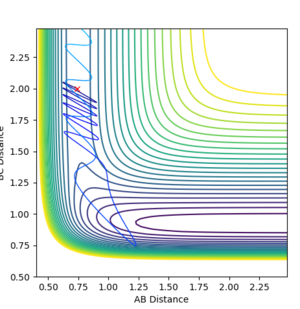
|
| -2.9 | Unreactive | 
|
| -2.8 | Unreactive | 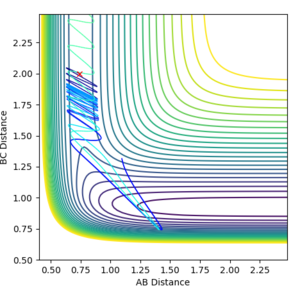
|
| 2.8 | Unreactive | 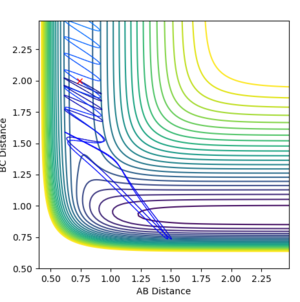
|
| 2.9 | Reactive | 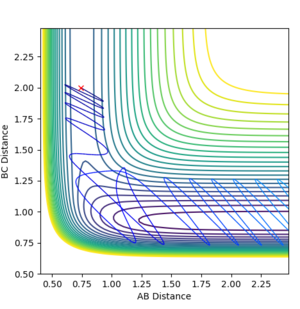
|
| 3 | Unreactive | 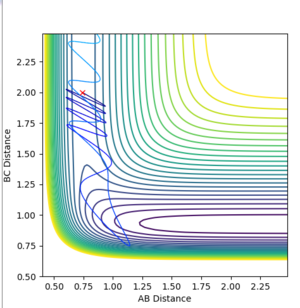
|
Interestingly, all of the different reactions tested did not give products. Only the reaction with p(AB)=2.9 gave rise to a successful reaction. This could suggest that even if the reactant have excess vibration energy, this does not necessarily allow them to surmount the transition state barrier. According to Polanyi's rules, that for this exothermic reaction, one is expected to have an early transition state and hence translational energy is more effective than vibrational energy for allowing the reactants to cross the barrier. Hence, this could indicate that increasing the translational energy of the reactants could allow the reactants to cross the energy barrier more effectively than vibrational energy. [8]
When p(BC) = -0.8 p(AB) = 0.1 these conditions give a successful reaction (for initial conditions of r(AB)=0.74, r(BC)=2.0 ). The contour plot is show below:
This suggest that even thoug h the amount of vibrational energy is relatively small, there is sufficient translational energy for the reactants to cross over the transition state to form products since the activation energy barrier is very low (calcualated as 0.235 kcal/mol). This observation is further supported by Polanyi's rules which state that for an exothermic reaction, the TS is early and hence translational energy is more effective in allowing the reactants to cross the transition state than increasing vibrational energy. [8]
Question 2:
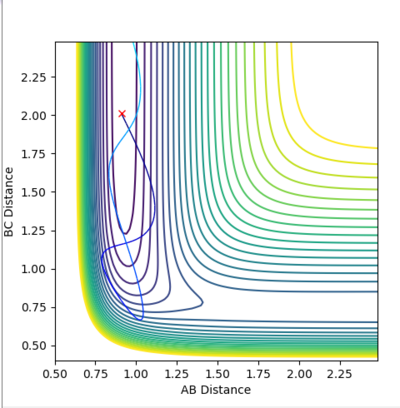
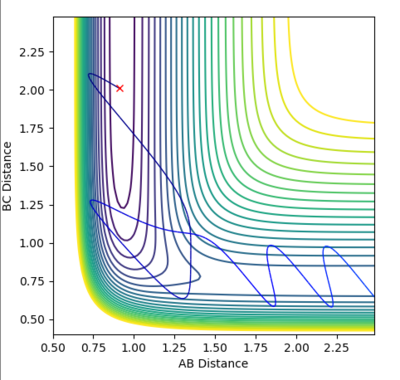
Using initial conditions of r(FH)=0.91 and r(H HF)=2.01 and low vibrational energy of p(H-F)=-1.0 and high momentum of r(H HF)=-7.0 the reaction was found to be unsuccessful - contour plot shown below.
Using initial conditions of r(HF)=0.91 and r(H HF)=2.01 different amounts of vibrational and kinetic energy were tested.
This is an endothermic reaction. According to Polanyi's rules, in an exothermic reaction Jas213 (talk) 01:39, 29 May 2018 (BST) I'm sure you mean endothermic., the transition state energy farrier is late (ie. occurs in the product channel) so that vibrational energy is more effective in allowing the reactant cross the barrier than translational energy. In example 5 above, the reaction is unsuccessful even though there in more translational energy available than in the Example 6 reaction. The reaction in Example 1 is successful while the reaction in Example 2 is unsuccessful: both reactions have the same amount of translational energy. However, the example 1 reaction has a greater amount of vibrational energy than the example 2 reaction. This hence lies in accordance for Polanyi's rules for endothermic reactions. [8]
Question 3
Discuss how the distribution of energy between different modes (translation and vibration) affect the efficiency of the reaction, and how this is influenced by the position of the transition state.
Polanyi's rules suggest that translational and vibrational energy are more effective in allowing the reaction to cross the transtion state depending on whether the transition state is late or early. For an early transition state barrier, translational energy allows for more effective crossing of the potential energy barrier than vibrational energy. Hence, for a reaction with an early transition state in the entrance channel, even with excess vibrational energy the reaction may still be unsuccessful if there is insufficient translational energy available to cross the barrier. A late transition state barrier is located in the exit channel and is more effectively crossed with vibrational energy than translational energy. Hence, for a reaction with a late energy barrier, reactants with excess translational energy but insufficient vibrational energy does not lead to a successful reaction. [8]
By considering Polanyi's rules and Hammond's postulate, exothermic reactions, in which the transition state is more similar to the reactants than the products suggesting that the saddle point of the PES is located in the reactant channel (ie. an early barrier). On the other hand, in an endothermic reaction, the transition state resemble the products more closely so it is expected that the stationary point in the PES is located in the exit channel (ie. late barrier). Therefore, depending on the position of the saddle point in the PES (whether it is in the entry (early TS) or exit (late TS)channel) vibrational or translational energy will be more or less effective in allowing the reactants to cross the potential energy barrier and form products. [8]
Jas213 (talk) 01:41, 29 May 2018 (BST) Very good report. Especially enjoyed your trajectories. Very lovely conclusion at the end.
References
- ↑ 1.0 1.1 1.2 Lewars EG. Computational Chemistry - Introduction to the Theory and Applications of Molecular and Quantum Mechanics. 16th ed. 2011. 16-17 p.
- ↑ 2.0 2.1 2.2 2.3 Atkins P, de Paula J. Atkins Physical Chemistry. 10th ed. Oxford University Press; 2014. 908-912 p.
- ↑ 3.0 3.1 3.2 3.3 Reimers J R. Computational Methods for Large Systems: Electronic Structure Approaches for Biotechnology and Nanotechnology. John Wiley & Sons; 2011. 134 p.
- ↑ 4.0 4.1 DaCosta H, Fan M.Rate Constant Calculation for Thermal Reactions: Methods and Applications. John Wiley & Sons; 2011. 142 p.
- ↑ Moore J W, Pearson R G. Kinetics and Mechanism. 3rd ed. 1961. 166 p.
- ↑ Silbey R J, Alberty R A. Physical Chemistry. John Wiley & Sons; 2001. 715 p.
- ↑ Atkins P, de Paula J. Atkins Physical Chemistry. 10th ed. Oxford University Press; 2014. 968 p.
- ↑ 8.0 8.1 8.2 8.3 8.4 Steinfield J L, Francisco J S, Hase W L. Chemical Kinetics and Dynamics. Prentice-Hall; 1989. 298-299 p.

