MRDPTH115
Molecular Reaction Dynamics
H + H2 System
Transition state
At the transition state, the overall potential energy is at a maximum, meaning that that the potential surface is at a minimum at that point along both axes, r1 and r2. Therefore, the following conditions are true[1]:
∂V/∂r1 = 0 and ∂V/∂r2= 0
The above conditions indicate, that the potential gradient is zero at that point of the potential surface, which corresponds to a maximum in potential energy, which in turn however indicates a minimum in kinetic energy. Further, it can be concluded that the rate of change of momentum p has to equal zero at the transition state, since the following equation has to be true:
F = dp/dt = -∂V/∂r = 0
The transition state is characterised by being a saddle point, where one finds a local minimum in one dimension and a local maximum in the other, so:
∂2V/∂r12 < 0 and ∂2V/∂r22 > 0
or
∂2V/∂r22 > 0 and ∂2V/∂r12 < 0
(This is true for a two-coordinate system. What about for an N-coordinate system? Tam10 (talk) 10:53, 1 June 2017 (BST))
It should be noted however, that in reality, the location of a transition state can be found with absolute precision. To locate the transition state, we use differential calculus, which deals with infinitesimally small changes in distances, meaning that it is impossible to find and exact single point[2].
Trajectories from r1 = r2: Locating the Transition State
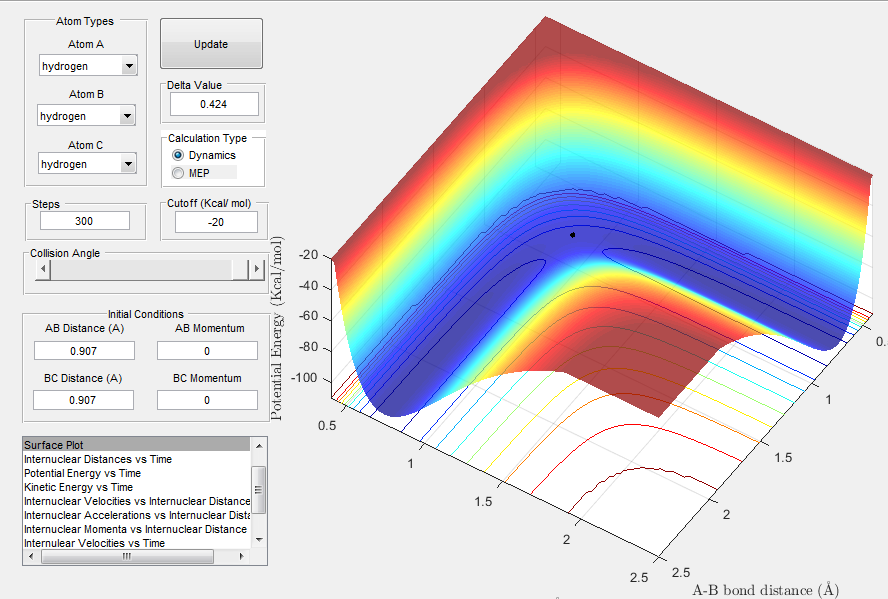
The image below shows the location of the transition state at r1 = r2 = 0.907 A.This point was determined by observing at which distance the H2 molecule does not oscillate (i.e. when there is no net force acting on it). Therefore, rts = 0.907 A.
Image 1: Location of transition state
Image 2 illustrates how the inter-nuclear distance varies with time. Since the rate of change of momentum is assumed to be zero at the transition state, we do not expect to observe a change in inter nuclear distance. Hence, the graph depicts straight lines, as expected.
Image 2: Inter-nuclear distance vs Time graph for r1 = r2 = 0.907 A
(There is still some oscillation here, but it's close enough. Tam10 (talk) 10:53, 1 June 2017 (BST))
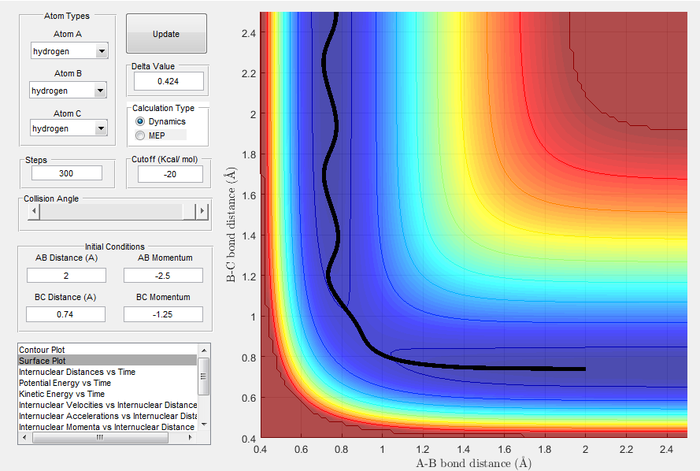
Trajectories from r1 = rts+δ, r2 = rts
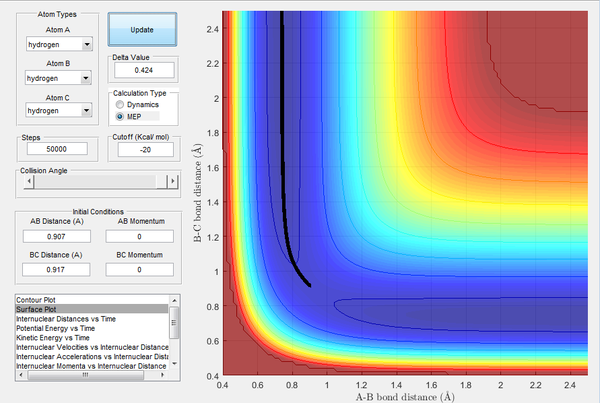
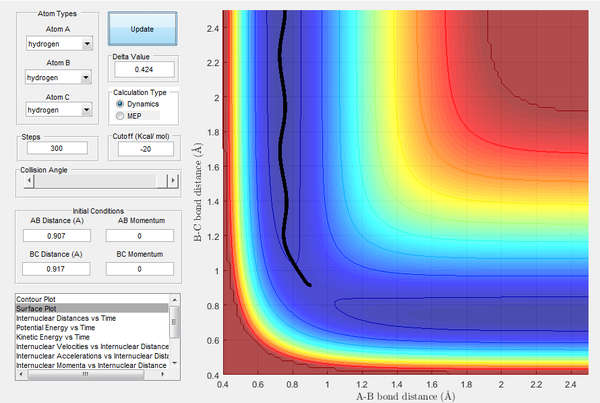
| Image 3: MEP Trajectory | Image 4: Dynamic Trajectory |
|---|---|
|
|
When calculating the MEP trajectory, the velocity of the particles (and thus their kinetic energies) are set to zero during each step of the calculation. As the kinetic energy (which includes vibrational motion) is set to zero, no vibrational motion is visible in the MEP trajectory (c.f. dynamic trajectory, where vibrational motion is clearly visible).
Reactive and Unreactive trajectories
Table 1: Reactivity of different initial momenta
Transition State Assumptions
The assumptions made upon the use of transition state theory are that if the reactants have sufficient energy to reach the transition state, products will be formed[1]. However, in reality, the kinetic energy of the reactants and the reaching of the transition state are not the only criteria that dictate whether a reaction will be successful or not. Other factors, such as whether the particles collide in a correct orientation and whether the reacting particles have the correct type of kinetic energy (translational, rotational or vibrational) also need to be considered[1].
F-H-H System
PES Inspection
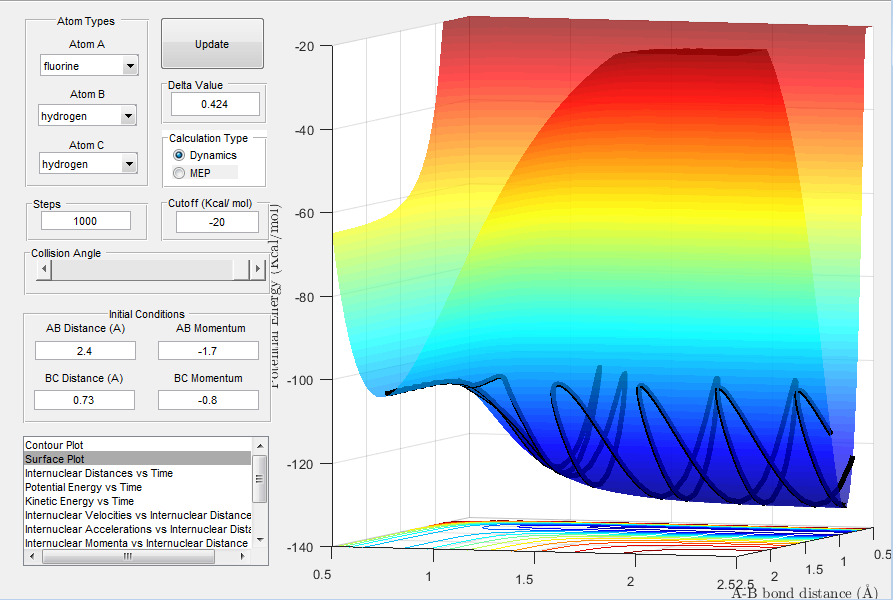
The forward reaction F + H2 → HF + H is exothermic, whilst the reverse reaction HF + H → F + H2 is endothermic. This was concluded by inspecting the potential energy surface of the forward reaction: one can recognise, that the reactants (H2 and F) are less stable than the products (HF and H). In the forward reaction, potential energy is converted to vibrational energy (see Image 10), releasing heat (vice versa for the reverse reaction). Hence, the forward reaction is classified as exothermic and the reverse as endothermic.
Furthermore, one can deduce that since the products (HF) are more stable than the reactants (H2), a H-F bond is presumably considerably stronger than a H-H bond.
Image 10: PES of reaction F + H2 → HF + H
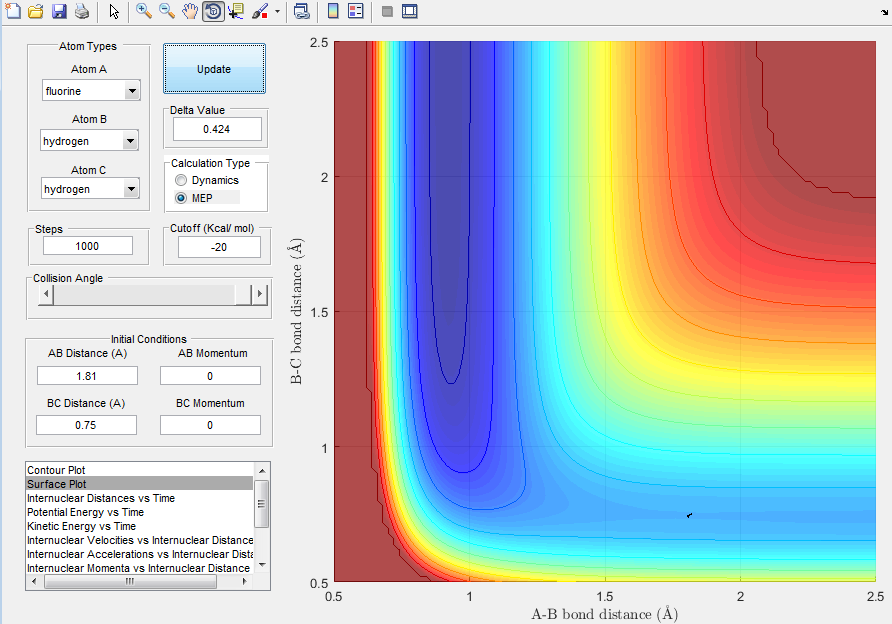
The approximate location of the transition state, which is the same for the forward and the reverse reaction, is at approximately r1 = 0.75 A and r2 = 1.81 A. The location of the transition state was found by considering the exothermic forward reaction, in which HF is formed, and by considering Hammond's postulate. The postulate states that for an exothermic reaction, the transition state is energetically and geometrically closer to the reactants (and vice versa for an endothermic reaction, which is closer to the products)[3]. Consequently, one would expect to find the transition state in the reactant trajectory.
Image 11: Location of Transition State
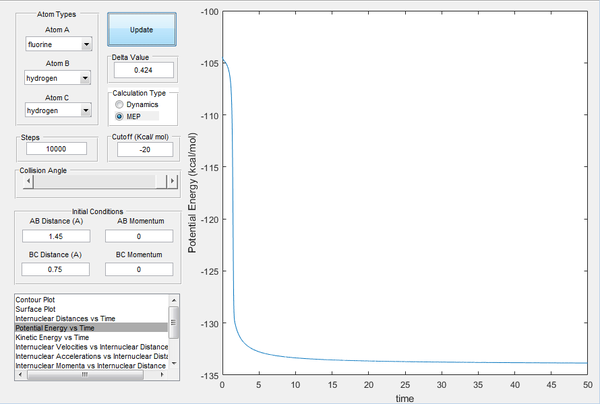
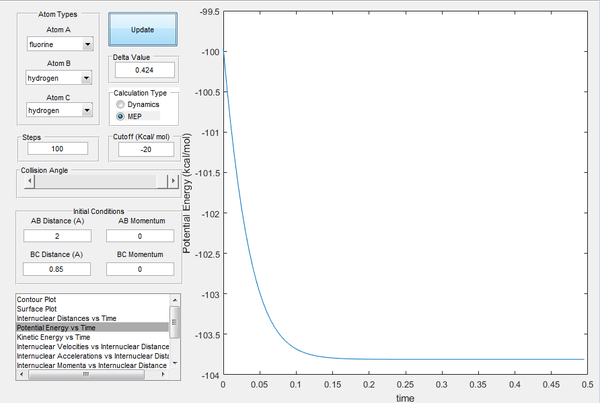
The activation energy of the forward reaction is the difference in energy of the reactants (H2 + F) and the transition state. Conversely, activation energy of the reverse reaction can be calculated by determining the difference in energy between the products of the forward reactants (HF + F) and the transition state. The potential energy against time graph in Image 12 allows us to calculate the energy difference between HF + H and the transition state, whilst the plot in Image 13 was used to compute the energy difference between the H2 + F and the transition state. The activation energy of the forward reaction is estimated at approximately 4 kcal/mol and the reverse reaction energy at 27 kcal/mol.
| Image 12: Potential Energy vs Time Endothermic Reaction | Image 13:Potential Energy vs Time Exothermic Reaction |
|---|---|
|
|
(You've used different energies for the TS in your calculations. It's best to write down the values for the energies of the stationary points so you can see where you went wrong. Tam10 (talk) 10:53, 1 June 2017 (BST))
Molecular Dynamics
For the forward reaction, as the incoming F atom collides with the H2 molecule, the F atom's translational energy is converted to potential energy (which reaches a maximum at the transition state). This potential energy in turn is converted to vibrational energy of the produced HF molecule and translational energy of the single H atom.
This theory may be verified experimentally by monitoring the temperature over the course of the reaction, since for the forward reaction (formation of HF) we expect the amount of vibrational energy to increase, corresponding to an increase in Temperature. Moreover, one could consider using IR spectroscopy to monitor the development of vibrational energy over the course of the reaction.
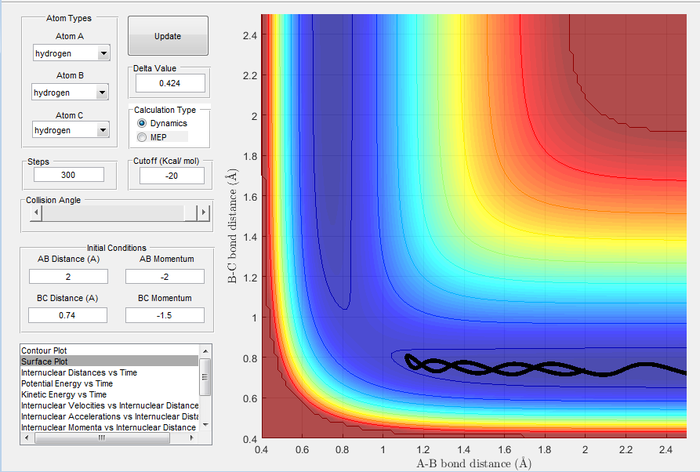
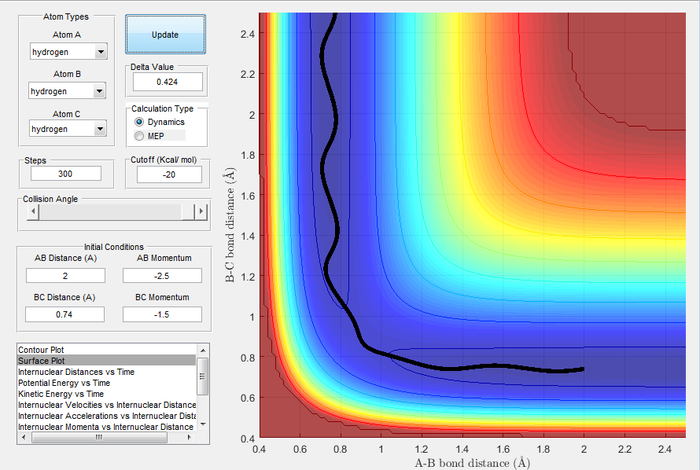
We empirically observe that for the forward reaction (formation of HF), the more vibrational energy the reacting H2 molecule has, the less likely it is that the reaction will be successful. The opposite is true for the reverse reaction (formation of H2): the more vibrational energy the reacting has, the more likely it is that the reaction will be successful. Examples demonstrating the theory are shown in Image 14 and Image 15 : the case in Image 14 shows that the forward reaction reactant molecule (H2 has a moderate amount of vibrational energy. Although, in the scenario shown in Image 15, the H2 molecule is given more vibrational energy, and the reaction is not successful. At this stage, it is worth noting that the transition state is closer to the reactants of the forward reaction (H2 and F). We can summarise our reasoning, that if the reacting species are close to the transition state (attractive PES), the more vibrational energy the reacting molecule has, the less likely it is that the reaction we go to completion.
| Image 14: | Image 15: |
|---|---|

|

|
(Why did you change the starting geometry? Tam10 (talk) 10:53, 1 June 2017 (BST))

