MRDJTR
Molecular Reactions Dynamics - James Rowley (JR4815)
Exercise 1
Question 1
Both the transition state and the minimum on a potential energy surface correspond to stationary points, . So, the components of the gradient, and , will have values of zero. Specifically, the transition state will be a saddle point and the minimum will be a minimum point; these can be differentiated between through the use of the discriminant, D.
If and then the stationary point is a minimum (potential energy minima). If, on the other hand, and takes any real value then the stationary point is a saddle point (transition state).
Question 2
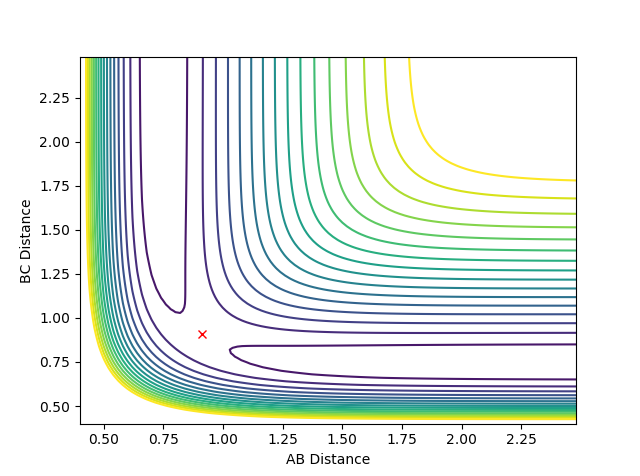
The transition state position for the reaction between H and H2, rts, is at approximately rAB = rBC = 0.91. The location of the transition state is indicated in figure 1; the red cross denotes the transition state. Note that the system does not deviate from this point if the momenta, pAB and pBC, are set to zero; hence, this trajectory corresponds to the transition state.
Mm10114 (talk) 15:56, 25 May 2018 (BST) It is yours TS estimate, that you've confirmed with a 2.5 ns long dynamics calculation, and you're correct. Worth considering: would you observe the same trajectory with increased length of the simulation (number of steps)?
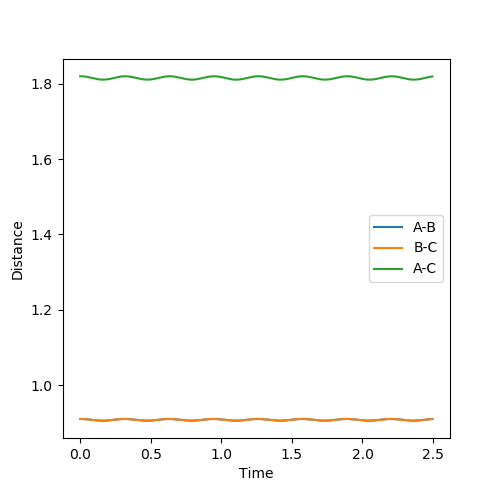
Figure 2 shows how the internuclear distances varies as function of time. This illustrates that rAB and rBC remain equal for all time; the trajectory is oscillating but never moving along the reaction coordinate; this further indicates that rAB = rBC = 0.91 is the transition state position.
Question 3
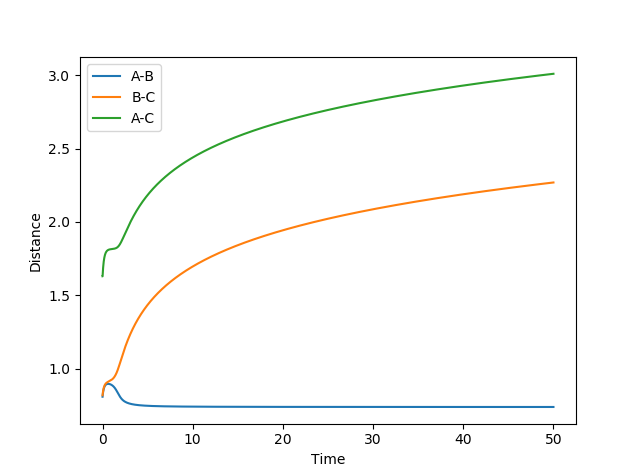

Figure 3 shows that the distance rAB decreases indicating that atoms A and B are forming a new bond and the distances rBC and rAC increase implying the BC bond breaks. The distances rAC and rBC increase with a decreasing rate.
Figure 4 shows the calculation of the reaction trajectory using the same parameters but with the dynamics calculation type. This shows a similar scenario but accounts for the AB bond vibrations hence the fluctuations in the distances. However, this indicates that rAC and rBC increase linearly (with a constant rate) rather than at a decreasing rate.
The result of the dynamics calculation type is more accurate, as in the MEP calculation, the velocity of the chemical species is reset to zero at each point (step) in time; this gives rise to the smooth curve.
Mm10114 (talk) 16:01, 25 May 2018 (BST) These are all good observations. However, the difference between MEP and dynamics is not a question of accuracy. Good spot that in dynamics we can observe the fluctuations in the distances. However, why is that? Have you looked at the energy vs time plot? What does this tell you about velocities?
Question 4
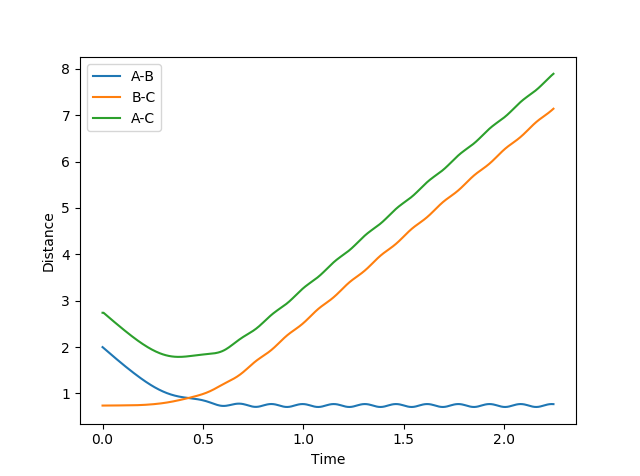
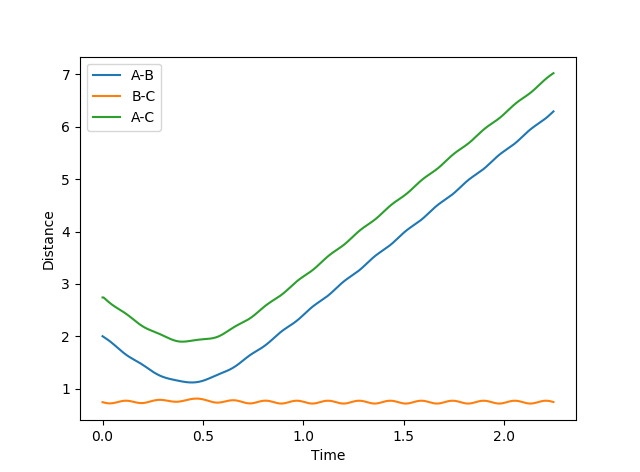
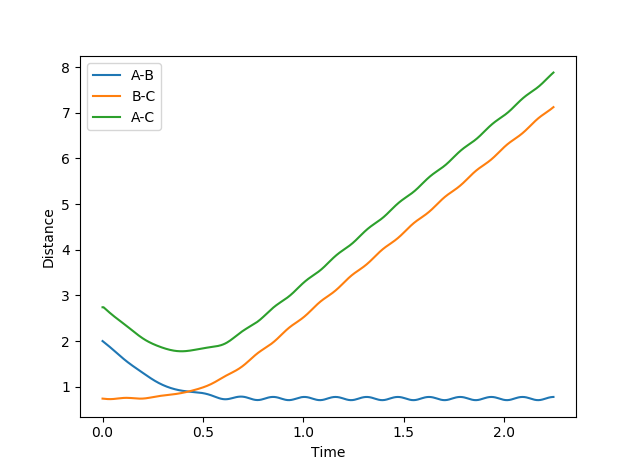
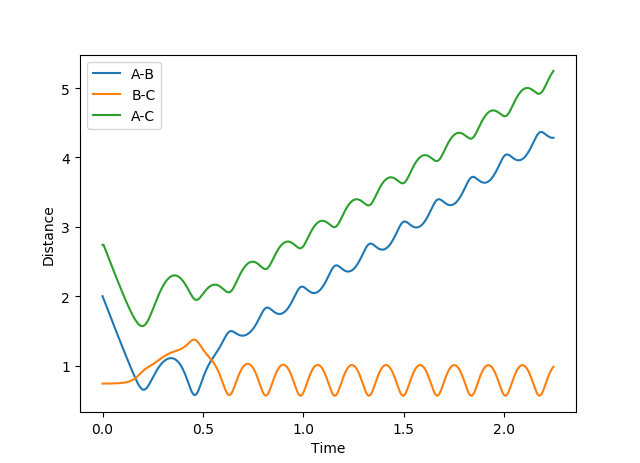
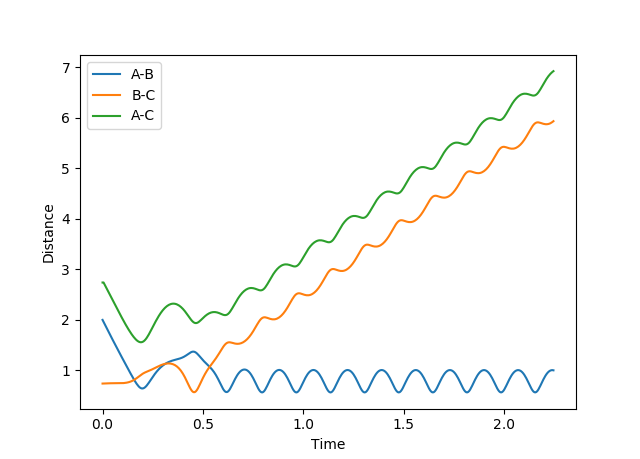
As shown in the graphs in the above table, when rAB decreases, this indicates a chemical reaction has occurred; therefore, the trajectory is reactive (as in the first, third and fifth trajectories). If rAB increases and rBC remains roughly constant (fluctuation due to bond vibrations) then the trajectory is unreactive (as in the second and forth trajectories).
Mm10114 (talk) 16:17, 25 May 2018 (BST) In this question it is specified to provide plots of the trajectory. You still can explain it using the internuclear distances vs time plot, however somehow you've got me lost. In the second part you say "If rAB increases", but it is first decreasing to only then start increasing with the reaction being unreactive.
Both the forth and fifth trajectories involve a barrier recrossing; the system passes through the transition state (potential energy maxima along the minimum energy path) only to pass back through the transition state and return to the reactants. In the fifth trajectory, the system then proceeds to pass through the transition state a third time to reach the products.
Note that initial values of rAB and rBC were fixed at 2.0 and 0.74 respectively for all five trajectories.
Mm10114 (talk) 16:17, 25 May 2018 (BST) So what conclusions can you draw from these observations?
Question 5
The main assumptions of Transition State Theory are:1
- The motion of the electrons is separate from the motion of the nuclei (Born-Oppenheimer Approximation)
- The reactant molecules are distributed among their states in accordance with the Maxwell-Boltzmann distribution
- Molecular systems that have passed through the transition state towards the products cannot turn around and reform reactants
- In the transition state, motion along the reaction co-ordinates may be considered independent of other motions and treated classically as a translation
- Even in the absence of an equilibrium between the reactant and product molecules, the transition states that are becoming products are distributed among their states according to the Maxwell-Boltzmann distribution
Transition State Theory will not predict rates of reactions correctly; it will overestimate them. As observed in the forth and fifth trajectories in the table above, the system can return to the reactants from the products (although trajectory five does ultimately form products) which is assumed not to occur in Transition State Theory. Additionally, by treating the motion along the reaction coordinate classically, quantum effects, such as tunneling through the energy barrier back to the reactants from the products is not accounted for. This may be especially prominent with the example of H + H2 as the reactants and products are the same and, therefore, isoenergetic, which is a requirement for tunneling to occur (consequence of the law of conservation of energy).
Mm10114 (talk) 16:20, 25 May 2018 (BST) You correctly discuss the third point, where your observations of the trajectories prove otherwise and that TST rate would be possibly overestimated. However, for the second part, would not taking tunnelling effect into account also result in overestimated rates?
Exercise 2
Question 6
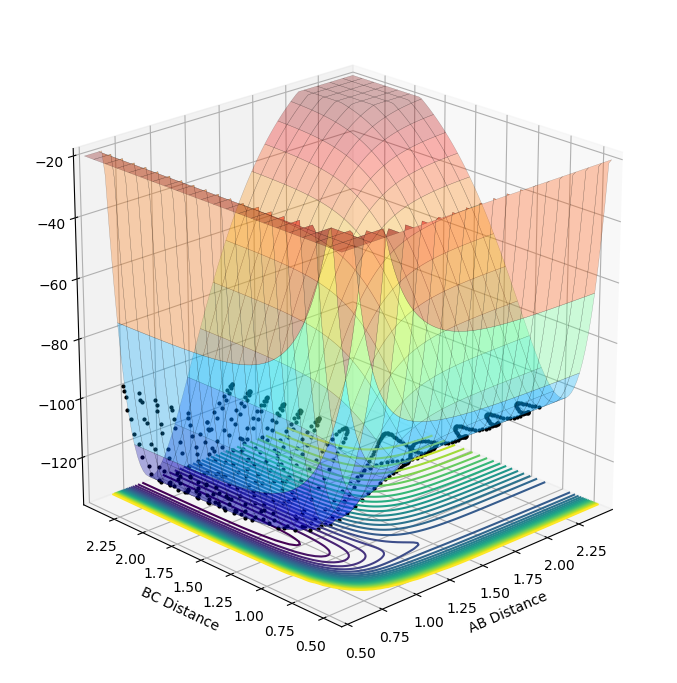
Figure 10 shows the surface plot for the reaction between F and H2. The reaction is exothermic as the products are lower in potential energy than the reactants. This indicates that the HF bond formed is stronger than the HH bond in the reactants; so, the net energy change throughout the reaction is negative as the energy released upon the formation of the HF bond outweighs the energy input required to overcome the activation barrier and break the HH bond.
Consequently, the reverse reaction between H and HF is endothermic.
Question 7
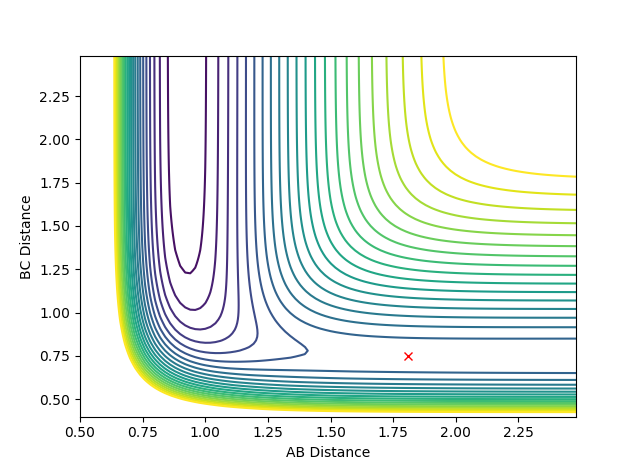
The transition state is located at approximately rAB = 1.81 (distance between F and HB) and rBC = 0.75 (HBHC bond length). As before, the red cross indicates the location of the transition state and upon setting the momenta pAB and pBC to zero, the system does not move from this point on the reaction coordinate. Therefore, this trajectory corresponds to the transition state.
Mm10114 (talk) 16:29, 25 May 2018 (BST) From this evidence you can't tell how long was the calculations (how many steps?). Wouldn't the internuclear distance vs time plot be also helpful to support the claim?
Question 8
(-103.742) - (-104.020) = 0.269
0.269 is the activation energy of the reaction between F and H2; the above calculation shows the energy of the reactant molecules (F and H2) subtracted from the energy of the transition state.
(-103.742) - (-134.025) = 30.274
30.274 is the activation energy of the reverse process. As expected, the activation energy for the reverse process is greater due to the fact that it is endothermic opposed to exothermic.
Mm10114 (talk) 16:22, 25 May 2018 (BST) What is the unit for energy here?
Question 9
Due to the law of conservation of energy, the products must have equal energy to the reactants, however, the reaction is known to be exothermic. So, in this simulation, the products must be generated in energetically excited states. The plot presented in figure 10 shows that excess potential energy is converted into kinetic energy; so, higher energy vibrational states are being populated in the products. This is evident upon observing the calculated reaction path. The black dotted line in figure 10 shows the reaction path; this indicates that when the system passes through the transition state in the direction of the products the potential energy drops. Subsequently, the potential energy of the system rises and then drops back down and so on; this is due to bond vibrations. At high values of potential energy (and low values of kinetic energy), the bond is either very long (longer than the equilibrium bond length) or very short (shorter than the equilibrium bond length). As the bond approaches it's equilibrium length, the majority of the potential energy will have been converted to kinetic energy. So, total energy remains constant in the products and is the same as in the reactants. The surface plot shows potential energy; when the products potential energy is at it's maximum (as shown on the reaction path), you can see by looking at figure 10 that this is approximately equal to the potential energy of the reactants which are in lower vibrational energy state. This is conveyed by the weaker amplitude of the oscillation in the potential energy of the reactants.
Mm10114 (talk) 16:25, 25 May 2018 (BST) Wouldn't showing the energy vs time plot for this reaction be valuable for this discussion?
This can be confirmed experimentally by infrared spectroscopy; if the products are occupying higher vibrational energy levels, the bond's vibrational frequency will be greater. So, the wavenumber associated with the HF bond vibration will be greater than expected.
Mm10114 (talk) 16:25, 25 May 2018 (BST) Good. Any other types of experiment?
Question 10
Polanyi's empirical rules state that for early transition states, translational energy is more effective at promoting a reaction than vibrational energy. Consequently, they also state that for late transition states, vibrational energy is more effective at promoting a reaction than translational energy.2
The reaction between F and H2 is exothermic, therefore, if more energy is distributed throughout the translation energy levels the reaction will be far more efficient. In exothermic reactions, the transition state is early (according to Hammond's postulate it will resemble the reactants rather than the products). As shown in figure 11, the transition state is located nearer the reactants; rAB is greater than rBC.
For the reverse reaction, the opposite applies as it is endothermic and possesses a late transition state (resembles the products). So, the reaction will be more efficient if more of the systems total energy is distributed throughout the vibrational energy levels.
Mm10114 (talk) 16:26, 25 May 2018 (BST) Good discussion and examples.
References
1) J.I. Steinfield, J.S. Francisco, W.L. Hase, Chemical Kinetics and Dynamics, Prentice Hall, New Jersey, 1989
2) Z. Zhang, Y. Zhou, D.H. Zhang, J. Phys. Chem. Lett., 2012, 3, 3416-3419

