MRD:zz171601327485
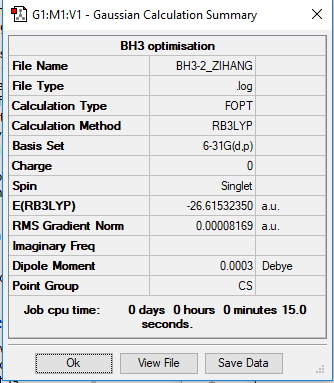
BH3
B3LYP/6-31G level (d,p)
         Item               Value     Threshold  Converged?
 Maximum Force            0.000203     0.000450     YES
 RMS     Force            0.000098     0.000300     YES
 Maximum Displacement     0.000736     0.001800     YES
 RMS     Displacement     0.000394     0.001200     YES

Low frequencies ---   -0.2263   -0.1037   -0.0054   47.9770   49.0378   49.0383
 Low frequencies --- 1163.7209 1213.6704 1213.6731
Frequency analysis log file: Media: ZIHANG_BH3_FREQ.LOG
optimised BH3 molecule |
| wavenumber (cm-1) | Intensity (arbitrary units) | symmetry | IR active? | type |
| 1164 | 92 | A2 | yes | out-of-plane bend |
| 1214 | 14 | E | yes | bend |
| 1214 | 14 | E | yes | bend |
| 2580 | 0 | A1 | no | symmetric stretch |
| 2713 | 126 | E | yes | asymmetric stretch |
| 2713 | 126 | E | yes | asymmetric stretch |
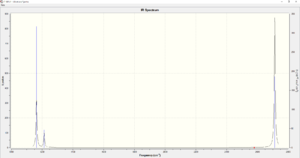
There are only three peaks shown in IR spectrum because some vibrations have the same frequencies (i.e. two vibrations have frequency 1214 cm-1, two vibrations have frequency 2713 cm-1). Also, the vibration with frequency 2580 cm-1 is IR inactive because it has 0 intensity. Therefore, only three peaks are shown in the IR spectrum.
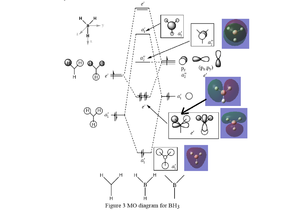
There is no significant difference between the real and LCAO MOs. This means that the LCAO MOs are quite accurate and can be very useful for predicting the real MOs.
Correct inclusion of some of the MOs, however, the top two e' LCAOs and MOs are missing the 3a1' MO is missing too. The evaluation is very brief and doesn't really discuss the similarities and differences. Smf115 (talk) 09:50, 30 May 2019 (BST)
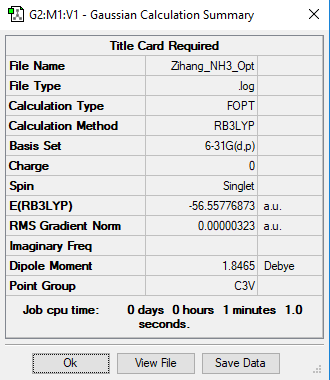
NH3
B3LYP/6-31G level (d,p)
         Item               Value     Threshold  Converged?
 Maximum Force            0.000006     0.000450     YES
 RMS     Force            0.000004     0.000300     YES
 Maximum Displacement     0.000012     0.001800     YES
 RMS     Displacement     0.000008     0.001200     YES

 Low frequencies ---   -0.0138   -0.0032    0.0018    7.0783    8.0932    8.0937
 Low frequencies --- 1089.3840 1693.9368 1693.9368
Frequency analysis log file: Media: ZIHANG_NH3_FRE2.LOG
optimised NH3 molecule |
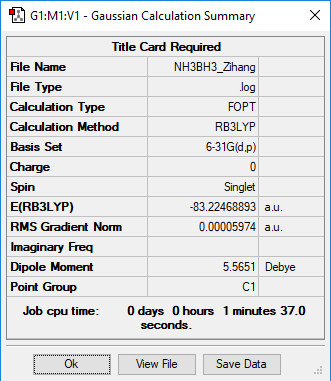
NH3BH3
B3LYP/6-31G level (d,p)
         Item               Value     Threshold  Converged?
 Maximum Force            0.000123     0.000450     YES
 RMS     Force            0.000058     0.000300     YES
 Maximum Displacement     0.000515     0.001800     YES
 RMS     Displacement     0.000296     0.001200     YES

 Low frequencies ---   -0.0011   -0.0011   -0.0006   15.6363   23.5923   41.3779
 Low frequencies ---  266.1209  632.2723  639.6323
Frequency analysis log file: Media: NH3BH3_ZIHANG_FRE.LOG
optimised NH3BH3 molecule |
E(NH3) = -56.55777 a.u.
E(BH3) = -26.61532 a.u.
E(NH3BH3) = -83.22469 a.u.
ΔE=E(NH3BH3)-[E(NH3)+E(BH3)]= -0.0516 a.u. = -135 kJ/mol
Therefore, according to the calculations above, the bond energy for B-N dative bond is 135 kJ/mol. This is a relatively weak bond, as comparing to C-H bond (413 kJ/mol) and C-C bond (348 kJ/mol) [2].
Correct calculation, good accuracy for the final reported values and nice comparison with references. Smf115 (talk) 09:52, 30 May 2019 (BST)
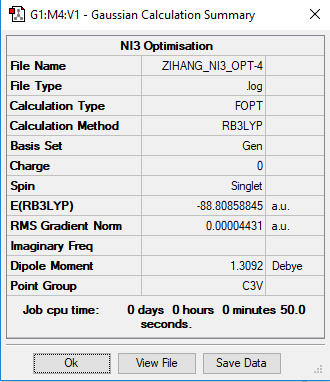
NI3
B3LYP/6-31G(d,p)LANL2DZ
         Item               Value     Threshold  Converged?
 Maximum Force            0.000102     0.000450     YES
 RMS     Force            0.000075     0.000300     YES
 Maximum Displacement     0.000667     0.001800     YES
 RMS     Displacement     0.000490     0.001200     YES


 Low frequencies ---  -12.3847  -12.3783   -5.6131   -0.0040    0.0194    0.0711
 Low frequencies ---  100.9307  100.9314  147.2333
Frequency analysis log file: Media: ZIHANG_NI3_FRE.LOG
optimised NI3 molecule |
The optimised N-I bond length is 2.184 Å.
Good implementation of the pseudopotential, in general, your structures and structure information is good, the only improvement would be that the frequency summary tables were wanted (confirm minima) and not the optimisation ones. Well presented first section though. Smf115 (talk) 09:54, 30 May 2019 (BST)
Mini Project: Ionic Liquids: Designer Solvents
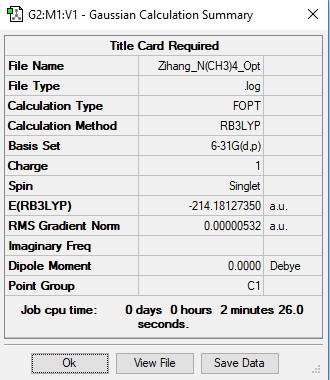
[N(CH3)4]+
B3LYP/6-31G level (d,p)
         Item               Value     Threshold  Converged?
 Maximum Force            0.000012     0.000450     YES
 RMS     Force            0.000004     0.000300     YES
 Maximum Displacement     0.001078     0.001800     YES
 RMS     Displacement     0.000298     0.001200     YES


 Low frequencies ---   -9.6080   -7.4402   -2.9397    0.0006    0.0009    0.0010
 Low frequencies ---  182.2031  288.2799  288.4042
Frequency analysis log file: Media: ZIHANG_N(CH3)4_FRE.LOG
optimised [N(CH3)4]+ molecule |
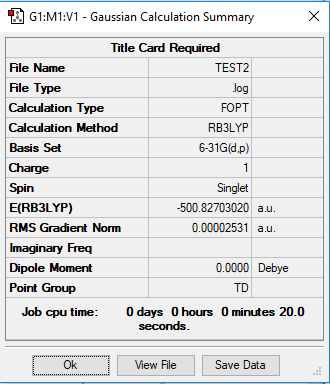
[P(CH3)4]+
B3LYP/6-31G(d,p)LANL2DZ
         Item               Value     Threshold  Converged?
 Maximum Force            0.000133     0.000450     YES
 RMS     Force            0.000033     0.000300     YES
 Maximum Displacement     0.000720     0.001800     YES
 RMS     Displacement     0.000300     0.001200     YES


 Low frequencies ---    0.0030    0.0034    0.0035   26.4145   26.4145   26.4145
 Low frequencies ---  161.2036  195.6575  195.6575
Frequency analysis log file: Media: TEST4.LOG
optimised [P(CH3)4]+ molecule |
Electron Distributions
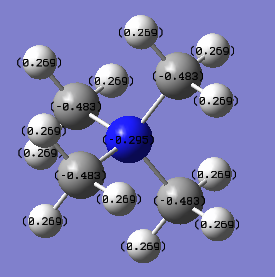
In [N(CH3)4]+, the charge on nitrogen is -0.295; the charge on each carbon is -0.483; the charge on each hydrogen is 0.269. The total charge of the ion is +1.
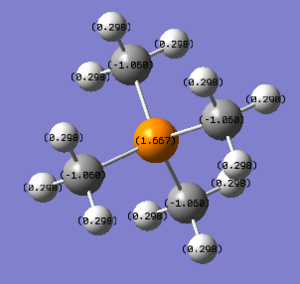
In [P(CH3)4]+, the charge on phosphorus is 1.667; the charge on each carbon is -1.060; the charge on each hydrogen is 0.298. The total charge of the ion is +1.
Comparing the electron distributions of the two ions, we can see that nitrogen takes much more electron charges than phosphorus. This can be explained by the electronegativity of the atoms. The electronegativity for nitrogen is 3.0, for carbon is 2.5, for hydrogen is 2.1, and for phosphorus is 2.2. In [N(CH3)4]+, nitrogen is the most electronegative element so that it would take negative electron charges. The reason carbon has a more negative charge than nitrogen is that carbon is connected to hydrogen, which is relatively electron positive in the molecule, so that hydrogen would donate electrons to carbon. Nitrogen is connected to carbon, so the charges are delocalised more broadly.
In [P(CH3)4]+, carbon is the most electronegative element so that carbon takes most electron charges, and thus, phosphorus has a positive charge. [3]
Correct NBO charges calculated and nice use of referenced electronegativities to justify the charge distribution in [N(CH3)4]+. However, you could have discussed the charges on the other atoms in [P(CH3)4]+ and considered other effects, such as symmetry. The charge distribution should have also been highlighted by a colour range across both ILs. Smf115 (talk) 17:27, 30 May 2019 (BST)
The "formal" positive charge on the nitrogen in the traditional picture represents that the total molecule has a positive charge, rather than the nitrogen has +1 charge itself. The specific charge distribution in a molecule is determined by the electronegativity of the R groups (i.e. if they are EWG or EDG). Usually, the charge is delocalised in the molecule so that the molecule could be relatively stable. The positive charge would locate on the atom/functional group that has a low electronegativity or electron-donating.
Nice mention that in the real picture electronegativity plays a role, however, you needed to explain why the N has a +1 formal charge in the traditional picture (consider formal electron counting) and you also don't identify where the positive charge actually lies instead. Smf115 (talk) 17:27, 30 May 2019 (BST)
Molecular Orbitals
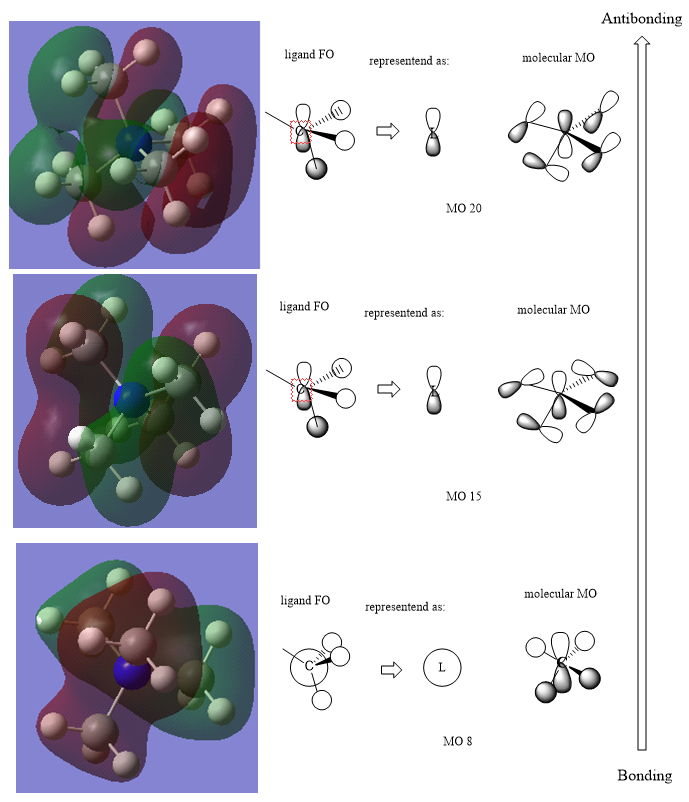
The simple LCAO MO diagram above shows the molecular orbitals of the molecule, from bonding to antibonding.
Generally, you have the correct FOs and LCAOs. However, in MO 15 the N is also not contributing (resulting in a more non-bonding MO) and the LCAOs could have been drawn a bit clearer/more consistently. Nice comparison of the MO character across them, although it isn't quite right. Annotating some of the main interactions would have improved the answer and might have helped you in evaluating the character. Smf115 (talk) 17:45, 30 May 2019 (BST)
Overall, a good report and well presented throughout with attention to details such as the basis set and method for each molecule. Smf115 (talk) 17:45, 30 May 2019 (BST)
References
[1] From Course: Molecular Orbitals in Inorganic Chemistry (Dr P. Hunt), tutorial sheet.
[2] Bond energies obtained from the website: https://www.kentchemistry.com/links/Kinetics/BondEnergy.htm
[3] Electronegativity obtained from the website:http://www.chem.ucla.edu/~harding/IGOC/E/electronegativity.html

