MRD:zx616
Exercise 1: H+H2 system
What value do the different components of the gradient of the potential energy surface have at a minimum and at a transition structure? Briefly explain how minima and transition structures can be distinguished using the curvature of the potential energy surface.
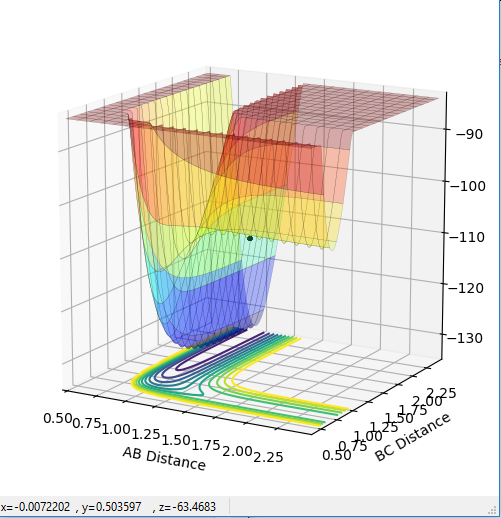
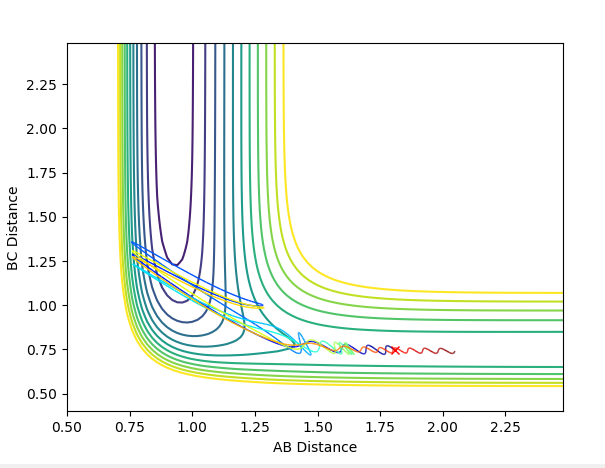
The transition state can be determined by looking at the surface plot. The saddle point is believed to be the place where Transition state is located at (0.40,0.40, -97). Are you sure? --Sw2711 (talk) 20:56, 18 May 2018 (BST)This is considered to be the transition state because the partial derivative of both AB and BC distances give a minimum I think you mean the diagnosis of AB/BC--Sw2711 (talk) 20:56, 18 May 2018 (BST), and the partial derivative of reaction coordinate and energy give a maximum. And I think the partial derivative doesn't really give a maximum or minimum. You need both first and second partial derivative from both components to check what point it is--Sw2711 (talk) 20:56, 18 May 2018 (BST)This is confirmed by checking whether the place is inside the reaction coordinate. Since r1=r2, this place is believed to be the transition state. Do you mean as long as r1=r2, it is the TS?--Sw2711 (talk) 20:56, 18 May 2018 (BST)
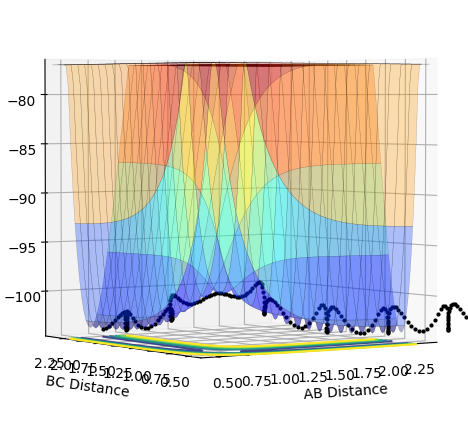
Report your best estimate of the transition state position (rts) and explain your reasoning illustrating it with a “Internuclear Distances vs Time” plot for a relevant trajectory.
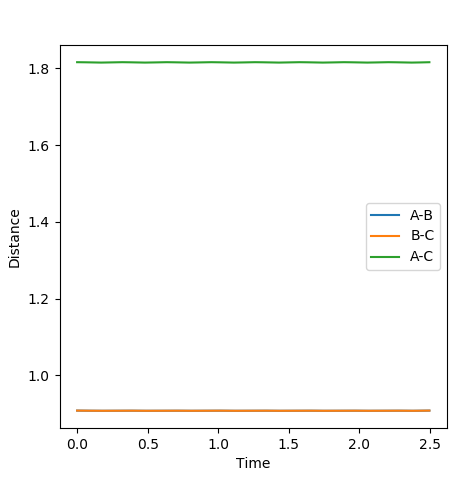
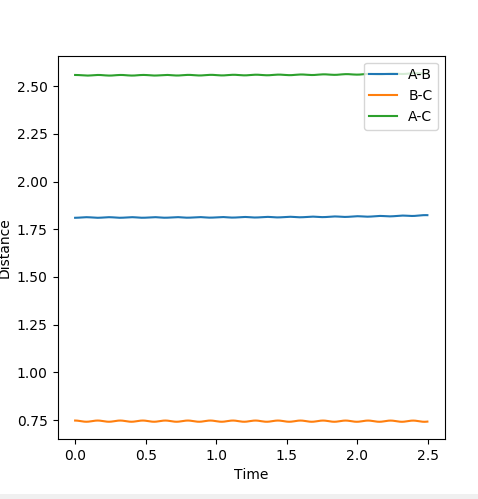
When r1=r2, with p1=p2=0 (since the gradient is 0), this is where TS is located. By adjusting proper values, r=0.908. I thought you just mentioned that the TS is located at (0.40,0.40, -97)? --Sw2711 (talk) 20:56, 18 May 2018 (BST)This is backed up by looking at the internuclear distance vs time graph where BC and AC distance does not change over time, only atomic vibration occurs I can't really see any oscillation from the graph you attached?--Sw2711 (talk) 20:56, 18 May 2018 (BST). When there is no oscillation within molecules and between atoms, TS is achieved.
Comment on how the mep and the trajectory you just calculated differ.
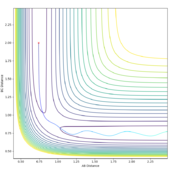
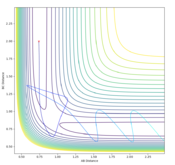
When MEP calculation is done, one will see that the line becomes smoother than Dynamic in surface plot, in which molecules are believed to oscillate. Therefore one can conclude that MEP is suitable for providing a macro picture of a reaction whereas the Dynamic provides a detailed behaviors of atoms in a reaction.
Try the very first example, compare Dynamics and MEP. See what you get. Would you still agree with your statement here? --Sw2711 (talk) 20:58, 18 May 2018 (BST)
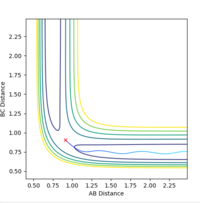
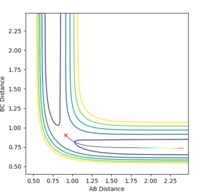
Intermolecular momenta vs time: for MEP the line becomes a flat line compare to Dynamic where lines are oscillating;
Intermolecular distance vs time: for MEP the graph becomes a curved line compare to dynamic where they are straight lines with positive gradients.
Complete the table by adding a column with the total energy, and another column reporting if the trajectory is reactive or unreactive. For each set of initial conditions, provide a plot of the trajectory and a small description for what happens along the trajectory.
This part is good.--Sw2711 (talk) 21:01, 18 May 2018 (BST)
State what are the main assumptions of Transition State Theory. Given the results you have obtained, how will Transition State Theory predictions for reaction rate values compare with experimental values?
Assumptions:
Firstly, Transition State Theory (TST) assumes that the reactants are in equilibrium with the transition state, but in reality, due to both kinetic and thermodynamic reasons. Some reactions proceed via an intermediate, which does not fit in Hammond's postulate.
Secondly, TST assumes that all molecules in TS are long-lived enough to reach Boltzmann's distribution before forming the product, this is very limited. When molecules of such have a short half life, the TST predicted products are not necessarily correct in its selectivities.
Last but not least, TST assumes that ΔH0=Ea, whereas a more reliable consideration is ΔH0=ΔU0 + RT. The assumption fails to take into account how TS will behave under the change in temperature but the modified version takes that into account and makes the model more reliable.
So how does the TST compare to your five tests above? Does TST predict them well? Furthermore, I think the term ‘equilibrium’ is not very applicable here. ‘equilibrium’ is mainly used in statistical thermodynamics. So like…thinking about a reaction A+B<=>C. Statistically speaking there is 80% molecules in this system reacts from the left to the right and 20% the other way around. (about obviously you should think about more like a Boltzmann distribution ). This reaction has reached an equilibrium. But in terms of your system, there are only 3 atoms. So, it is either one way or the other. --Sw2711 (talk) 21:01, 18 May 2018 (BST)
Exercise 2
Good and good reference. But I'd like to see a PES plot and some explanation about how you can read from a PES plot to know whether it is endothermic or exothermic--Sw2711 (talk) 21:03, 18 May 2018 (BST) Classify the F + H2 and H + HF reactions according to their energetics (endothermic or exothermic). How does this relate to the bond strength of the chemical species involved?
F+H2 is exothermic. As seen from the PES plot, from B-C to A-B involves a release of energy from ca. -130 to ca. -110.
H-H bond strength is less than that of F-H, the formation of a F-H bond compensates the breaking of one H-H bond. Therefore it is exothermic.
H+HF is endothermic because of the similar reasons. From B-C to A-B involves a absorption of energy from ca. -110 to ca. -130.
the breaking of a strong H-F bond cannot be compensated by the formation of a relatively weaker H-H bond, so it is endothermic.
comparison of bond strength: H-H: 432 kJ/mol; H-F: 565 kJ/mol, matches the observations from the plots.
ref:http://www.wiredchemist.com/chemistry/data/bond_energies_lengths.html
Locate the approximate position of the transition state.
The position of TS is located to be r(F-H)=1.810 and r(H-H)=0.745 for F + H2 and r(H-H)=1.810 and r(F-H)=0.745 for H + FH. This is confirmed by viewing the Internuclear distances vs time plot being three horizontal lines and the surface plot with one single dot on the saddle "line".
Comments: The first plot identifies the saddle point at given initial conditions, confirming those conditions represent the transition state. The second graph illustrated no vibrations between three molecules, meaning they are at the furthest they can be without losing interactions, confirms again that these conditions fulfill a transition state. Similar approaches were used to determine the transition state for the second reaction. In order to achieve satisfactory initial conditions, trail and errors were carried out in accordance with the relevant knowledge from bond strengths.
This part is good--Sw2711 (talk) 21:24, 18 May 2018 (BST)
Report the activation energy for both reactions.
To determine the activation energy, the energy of transition state was used to minus the energy of the reactants to give activation energy. A MEP plot was done to determine the energy of transition state precisely. And by slightly increasing and decreasing the distance of F-H in the transition state, the energy of the reactants can be determined too.
For F+H2, the activation energy is reported to be 0.20 kCal/mol and for that of H+FH it is reported to be 30.2 kCal/mol
I'd like to see some evidence. How did you find these numbers using MEP plots?--Sw2711 (talk) 21:24, 18 May 2018 (BST)
In light of the fact that energy is conserved, discuss the mechanism of release of the reaction energy. How could this be confirmed experimentally?
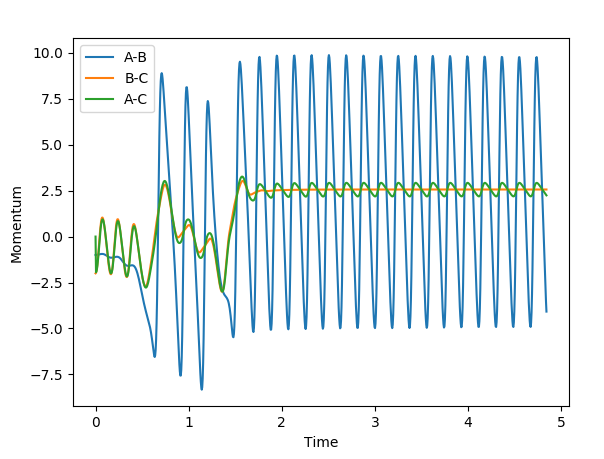
A set of reactive initial condition for F + H2 is r(F-H)=1.810, r(H-H)=0.745, p(FH)=-1 and p(HH)=-2. It can be clearly see that in the beginning of the reaction, i.e. 0-0.5s, the energy was stored in H-H bond, conversly F-H bond shows no momentum. However, as the reaction goes through, at around 1s sees the exchange of the energy between two bonds. 1.25 seconds shows a converge trend of F-H and H-H momenta, marked the successful transfer of energy. In the end, the amplitude of F-H bond momentum increases as a result of the decrease of H-H bond. Overall, the potential energy was converted to vibrational energy, because of the momenta of B-C and A-C are positive, means that the molecules and the hydrogen atom are moving away from each other. A calorimeter can be used to monitor the energy changes during the reaction. See below a graph of momenta vs time graph for confirmation.
I am not very sure here about your explanation. First of all, why did you choose a momentum plot over an energy plot? Secondly, I can't really see how the energy is conserved by reading your momentum plot. By comparing the magnitude of your momentum before and after the reaction, I can't really see how this is conserved. --Sw2711 (talk) 21:24, 18 May 2018 (BST)
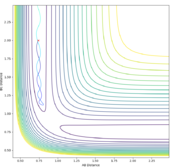
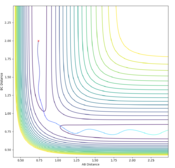
When exploring the variation of p(HH) from -3 to 3. The reaction becomes successful when the momentum of H-H is around -1, and becomes unsuccessful above 1. This suggests that momentum is a vector, and it does not matter whether the sign is positive or negative, simply just a direction. The magnitude however, suggests that only a small momentum of H-H should be use so that it does not surplus the threshold of around |2|. If p(H-H) is greater than that of F-H, hydrogen molecules will tend to stay together rather than forming a new bond with Fluorine atom. Some examples of successful and unsuccessful reactions are shown below.
A successful reaction with p(H-H)=0.5
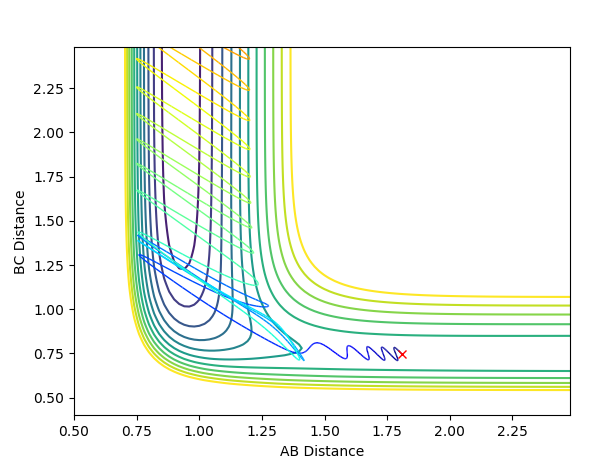
A successful reaction with p(H-H)=-1 I am not sure this one is successful. It bounced back to reactant channel eventually.--Sw2711 (talk) 21:24, 18 May 2018 (BST)
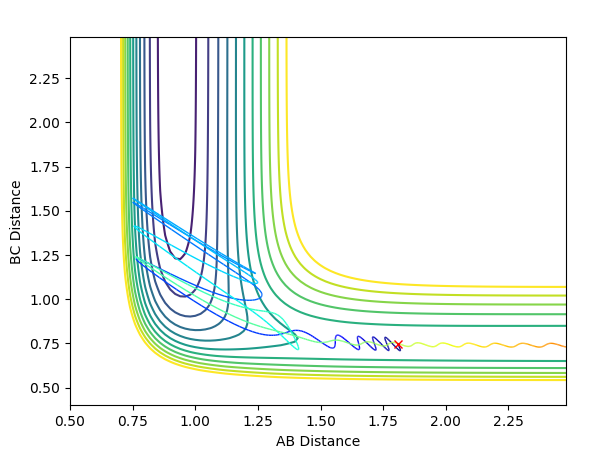
An unsuccessful reaction with p(H-H)=-2.5
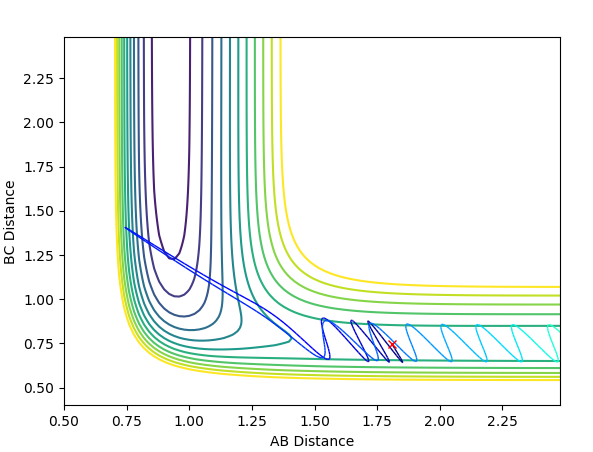
When energy is reduced considerably and the momentum of F-H is increased slightly, there is a dilemma that the activation energy for the product to form is not enough because the single hydrogen atom does not have enough kinetic energy to move away from the complex, i.e.this situation may happen in the very beginning of the transition state. The reaction is still feasible. I can't see how this reaction is still considered feasible--Sw2711 (talk) 21:24, 18 May 2018 (BST)
Discuss how the distribution of energy between different modes (translation and vibration) affect the efficiency of the reaction, and how this is influenced by the position of the transition state.
The quantity of momenta were kept at 10. According to Polanyi's rule, for a late TS reaction, vibrational is more effective to overcome the barrier than kinetic energy. Therefore, for this reaction, it's endothermic so a late TS state, therefore, increase in p(H-F) facilitates the reaction.
If you say increase p(H-F) facilitates the reaction, I need some evidence. Your previous examples are all changing p(H-H). --Sw2711 (talk) 21:24, 18 May 2018 (BST)
ref:http://brouard.chem.ox.ac.uk/teaching/dynlectures4to6.pdf

