MRD:zw4415
Introduction
In this computational lab, reaction dynamics of triatomic systems was investigated using MATLAB R2016a. Varies of reaction conditions was experimented by changing the parameters within the program. Transition states of triatomic system (HHH) and (HHF) are determined. Trajectories of reaction together with the intermolecular momentum vs time graph was used to determine whether the system is reactive or unreactive. The same method could also be applied to other triatomic systems to determine their transition state and reaction trajectory.
Exercise 1: H + H2 potential energy surface
Determination of the Transition State geometry
At transition structure, the gradient ∂V (r1)/∂r1=0 and ∂V (r2) /∂r2=0.
At minimum 1 (reactants), the gradient ∂V (r1)/∂r1=0 but ∂V (r2) /∂r2 is less than 0.
At minimum 2 (products), the gradient ∂V (r1)/∂r1=0 but ∂V (r2) /∂r2 is less than 0.

rts= 0.90775, tried out a range of distances. When r1 and r2 are both 0.90775 and p1=p2=0 the internuclear distance doesn’t change with time, which means it is at the transition state.
If one starts a trajectory exactly at transition state, with no initial momentum, it will remain there forever.
Trajectories from Transition State
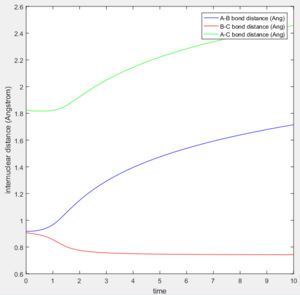
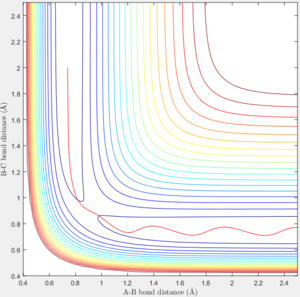
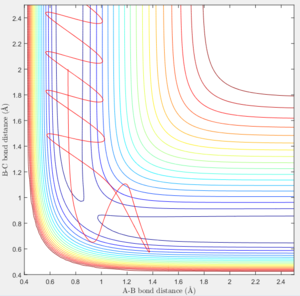
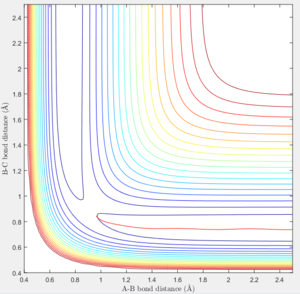
Distance of A-B increase over time while B-C distance decrease over time and eventually B-C bonded.
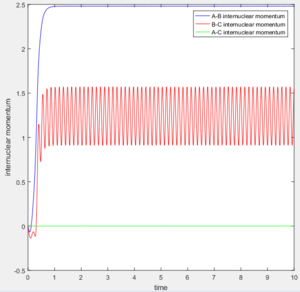
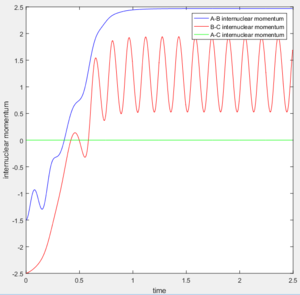
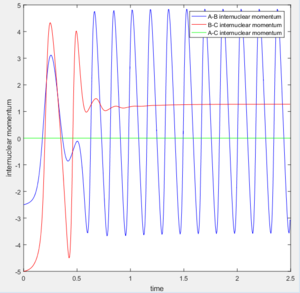
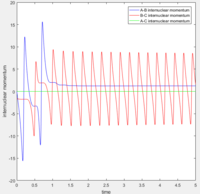
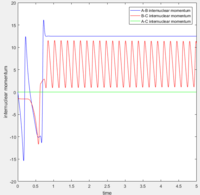
According to the internuclear momentum vs time graph calculated by Dynamics method, we can tell that after formation of bond B-C, the translational energy converts to vibrational energy, and hence bond B-C oscillates.
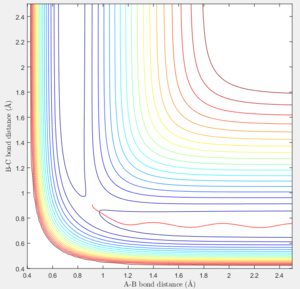
However in MEP calculation, there is no intermolecular momentum. From the contour plot, the B-C will not vibrate over time.
In dynamics method at large t ( t = 50s ):
The average internuclear momentum between B and C is 1.241.
The average internuclear momentum between A and B is 2.481.
The average internuclear momentum between A and C is 0.
The average internuclear distance between B and C is 0.7432.
The average internuclear distance between A and B is 186.5.
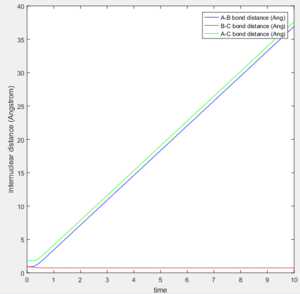
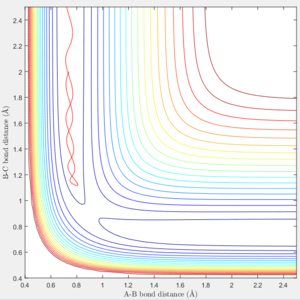
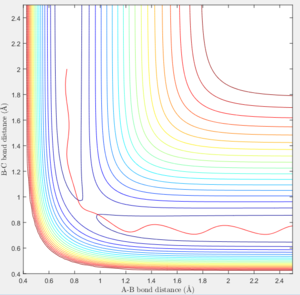
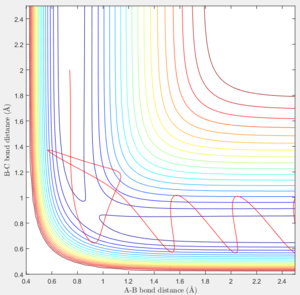
If we start from the the initial positions correspond to the final positions of the trajectory we just calculated, with the same momenta values as the final momenta before but with signs reversed.
We could obtain a following trajectory. It is very similar to the trajectory with the initial value r1=0.90775, r2=0.91775, p1=p2=0.
Reactive and unreactive trajectories
According to transition state theory, when the system reaches a transition state configuration, it automatically assume that the system proceed to the product system. It might be due to the fact that the transition state is formed from the initial reactant state, so when it reach transition state, it have a inertia to having a momentum in positive direction. This assumption theory is true in most of the cases. However in the last 2 systems, both system have sufficient energy to overcome the activation energy barrier. However B-C bond only forms in the last system. It can not be used to predict the reaction rate as it does not take into account the rate where the transition state reverse back to reactants.
EXERCISE 2: F - H - H system
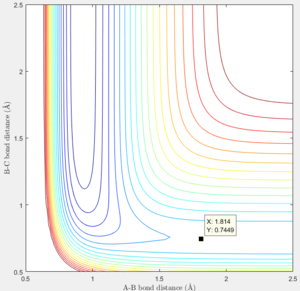
PES inspection
Reaction from F + H2 to H + HF is exothermic.
This is related to the bond strength between H-F is stronger than H-H. Therefore energy released when the reaction taken place.
 |
 |
|---|
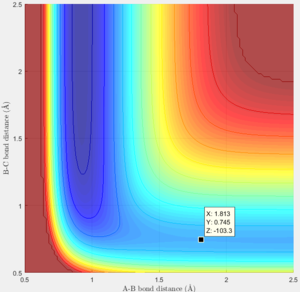
The transition state was estimated to be at r1=1.8107 and r2=0.745 with initial momenta equals to 0.
Activation energy is the energy barrier between the minimum point on the trajectory and the transition state.
 |
 |
|---|
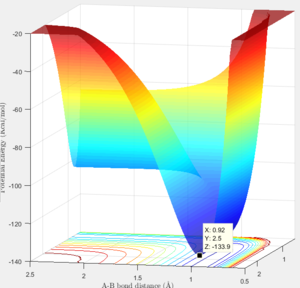
For energy barrier between the H-H bond and transition state:
Thus the Ea could be calculated as Ea=-103.3-(-103.9)= 0.6 Kcal/mol
For energy barrier between the transition state and the H-F bond:
Thus the Ea could be calculated as Ea=-103.3-(-133.9)= 30.6 Kcal/mol
Reaction dynamics
 |
 |
|---|
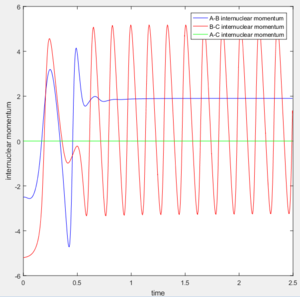
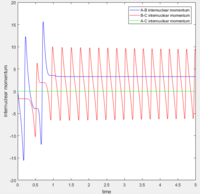
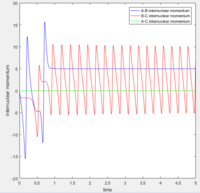
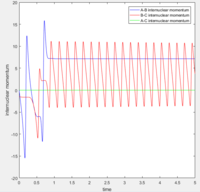
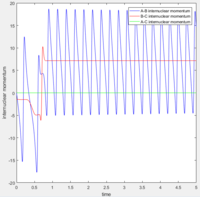
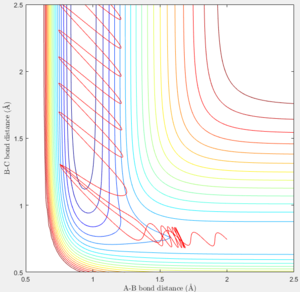
Initially the B-C bond which corresponding to H-H is vibrating. Then when F atom approaches, the H-F bond forms and the excess energy was transferred to the vibration energy between H and F atom. Thus at large time t, the inter molecular momentum between B-C flattened and A-B momentum is vigorously oscillating.
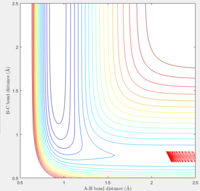
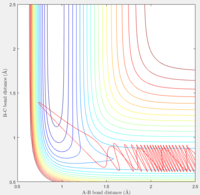
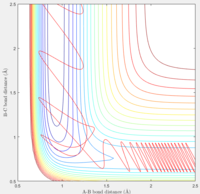
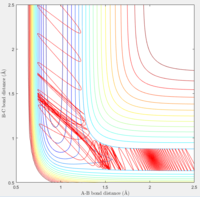
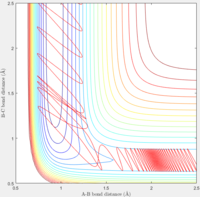
From the F + H2 side where rHH = 0.74 and rFH =2,5 , momentum pFH was set to -0.5 .
Several values of pHH in the range from -3 to 3 was tried out in this system.
 |
 |
 |
 |
 |
 |
 |
 |
 |
 |
Observation: When pHH was taken from -2.74 to 2.76, it shows a unreactive trajectory. Higher or below that, the trajectory becomes reactive.
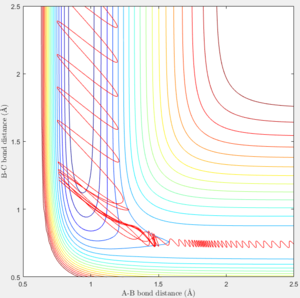
If the momentum of FH was set slightly higher at -0.8, and pHH was reduced to 0.1 which is very small. We can tell from the trajectory that the system is still reactive.
For system starting form H + HF, the entry point should be (r1=1.8107, r2=2.5)

The initial conditions was set at p1=0 and p2=5. It can be seen from the contour plot that the H-F bond was initially broke by the high momentum between H and H. However after H-F bond breaks, F could back attack the H-H molecule and reforms the H-F. Thus the total system is in oscillation.
A reactive trajectory was obtained by setting the momentum H-H to -0.5 and gradually increasing momentum H - F.
It can be observed that when pHF goes below 1.45, the system becomes unreactive.
Conclusion
In this case the pHF corresponds to the vibration energy and pHH corresponds to the transition energy. From the above analysis, when transitional energy increases, the system is likely to become reactive.
When the transition state is closer to the reactant , the momentum thus energy needed for both species are lower. When the transition state is closer to the product, higher transitional energy is required to overcome the energy barrier.


