MRD:zp2518
Molecular Reaction Dynamics: Applications to Triatomic systems
Overall, your report was perfect from start to end. You have clearly explained how each step was conducted and provided full discussions. It is obvious you have understood the concepts throughout. Your presentation should also be praised. I would advise you begin adding in references to your report and any piece of course work it would definitely help you! Mys18 (talk) 23:00, 24 June 2020 (BST)
H + H2 system
Introduction
In this wiki, the potential energy surface is applied to study the a triatomic system.

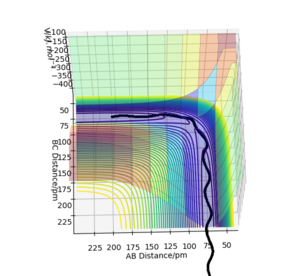
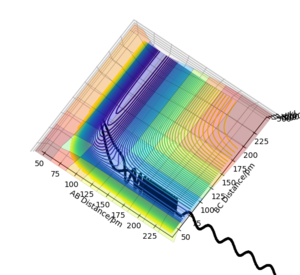
In this triatomic system, an H atom A collide with the H2 molecule BC. Their separations and momentums are represented by r1, r2, p1 and p2. The the example shown in the figure 1 have the following initial condition.
| r1 / pm | r2 / pm | p1 / g.mol-1.pm.fs-1 | p2 / g.mol-1.pm.fs-1 |
|---|---|---|---|
| 74 | 230 | 0 | -5.2 |
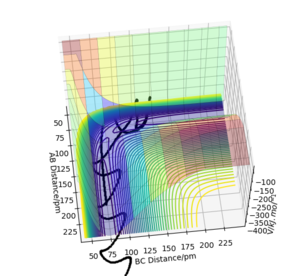
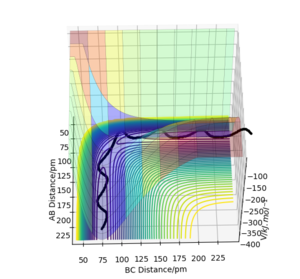
The trajectory of this example system was calculated on the potential energy surface diagram with following setting.(Fig.2)
| Calculation type | Step number | Step size / fs |
|---|---|---|
| Dynamic | 500 | 0.1 |
Great introduction Mys18 (talk) 22:45, 24 June 2020 (BST)
locating the transition state

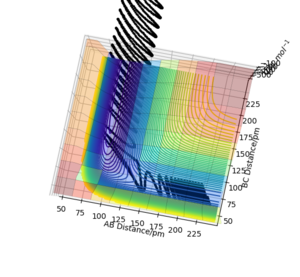
In a potential energy surface diagram, the transition state is defined as the maximum along the minimum energy path that links the reactant and the product.(Fig.3) Therefore, it is also a saddle point on the potential energy surface diagram.
The transition state and a local minimum both have zero gradient of potential on an energy surface diagram (∂V(ri)/∂ri=0). However, saddle points could be distinguished from a local minimum by calculating the hessian matrix and second partial derivative of potential. A saddle point has indefinite hessian matrix with the eigenvalues being one positive and one negative, while a local minimum have Hessian that is positive definite with all eigenvalues positive being positive an a second partial derivative that is positive.
Excellent! But some more details are needed. the second derivative will not automatically churn our one positive and one negative value, that is wrt. the direction in matter. If one is positive in a direction the orthogonal direction will be negative. Whereas for the local minimum it is positive in all directions.Mys18 (talk) 22:48, 24 June 2020 (BST)
Because the the transition state is a local maximum in the reaction path, the gradient of potential energy surface and therefore the rate of change in momentum are both equal zero (∂pi/∂t=∂V(ri)/∂ri=0). Due to the rate of change in momentum is zero, the force along the vector direction of r1 and r2 should also be zero, in other word, the r1 and r2 should be fixed in time.
The transition state of the system H+H2 have the geometry that r1=r2 because system is symetric. The geometry of the transition state that r1=r2=r is found by trying different initial values of r with zero initial momentum to find the value of r that results stationary trajectory.
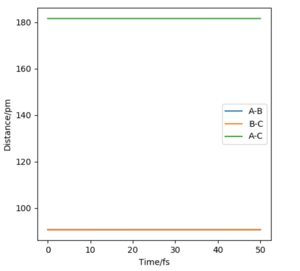
The estimated position of the transition state is at r1=r2=90.77 pm. This is the position of the TS that result stationary trajectory as we predicted above. Which is proven by the Internuclear Distances vs Time plot (Fig.4). This plot clear shows that the rAB(r2) and rBC(r1) is fixed in time.
Nicely shown!Mys18 (talk) 22:48, 24 June 2020 (BST)
Calculating the reaction path
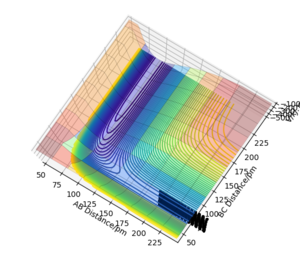
The reaction path (Fig.5) was calculated with following initial conditions and calculation setting.
| Calculation type | Step number | step size / fs | r1 / pm | r2 / pm | p1 / gmol-1pmfs-1 | p2 / gmol-1pmfs-1 |
|---|---|---|---|---|---|---|
| MEP | 1500 | 0.15 | 91.77 | 90.77 | 0.0 | 0.0 |

Trajectories from r1 = rts+δ, r2 = rts
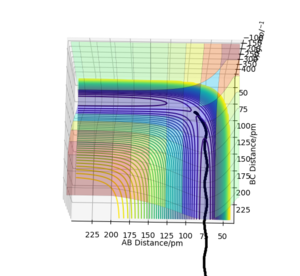
The trajectories (Fig.6) were calculated with following initial conditions and calculation setting.
| Calculation type | Step number | step size / fs | r1 / pm | r2 / pm | p1 / gmol-1pmfs-1 | p2 / gmol-1pmfs-1 |
|---|---|---|---|---|---|---|
| Dynamics | 500 | 0.1 | 91.77 | 90.77 | 0.0 | 0.0 |
(r1 = rts+1pm, r2 = rts)
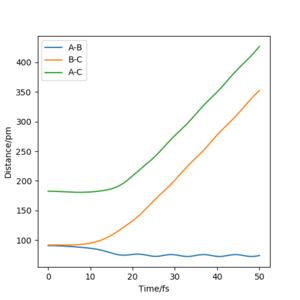
By comparing the reaction path calculated from the MEP (Fig.5) and the trajectories calculated from the dynamics (Fig.6). We found that the reaction path do not take the vibration of bond in a molecule in to account because it reset the moment to the initial condition in each time step. It represent the path of the reaction from the reactant to the product, but not the motion of the atoms. The elimination of the momentum also make it takes longer to the obtain a complete trajectory (225 fs for the calculation in MEP and 50 fs for the calculation in dynamics). While the trajectories calculated with the dynamics is shown as a sinuous curve on the potential energy surface. Which indicate that the dynamic calculation takes the motion of atoms or the vibration of the molecule bond into account.
Perfect and that makes dynamic more realistic!Mys18 (talk) 22:49, 24 June 2020 (BST)
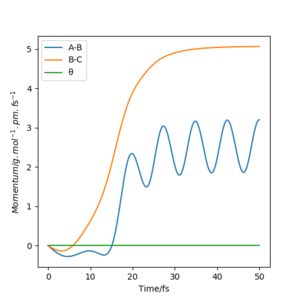
The plots of “Internuclear Distances vs Time” and “Momenta vs Time” are shown in Fig.7 and Fig.8.
(r1 = rts+1pm, r2 = rts)
(r1 = rts+1pm, r2 = rts)
The final values of the positions and momentums are shown below
| r1 / pm | r2 / pm | p1 / gmol-1pmfs-1 | p2 / gmol-1pmfs-1 |
|---|---|---|---|
| 352.2080 | 73.8902 | 5.05855 | 3.21350 |
Trajectories from r1 = rts, r2 = rts+δ
The trajectories (Fig.9) were calculated with following initial conditions and calculation setting.
| Calculation type | Step number | step size / fs | r1 / pm | r2 / pm | p1 / gmol-1pmfs-1 | p2 / gmol-1pmfs-1 |
|---|---|---|---|---|---|---|
| Dynamics | 500 | 0.1 | 90.77 | 91.77 | 0.0 | 0.0 |
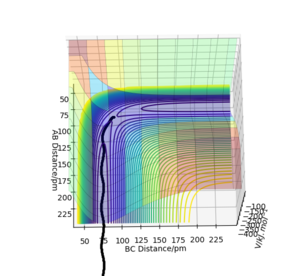
(r1 = rts, r2 = rts+1pm)
The plots of “Internuclear Distances vs Time” and “Momenta vs Time” are shown in Fig.10 and Fig.11.

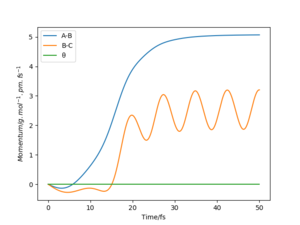
By comparing the "Internuclear Distances vs Time" plots with two different initial condition(fig.8 and fig.10), we found that with the initial geometry that r1 = rts+1pm and r2 = rts. The value of r1 (or rbc) increase to infinity as times pass and the value of r2 (or rab) decrease first and then fluctuate around a constant. Which indicate that the HA-HB-HC system decompose to an atom HC that leave with constant velocity and a molecule H2(AB) staying and vibrating with a momentum.
While the trend reversed with value of r2 increase to infinity as times pass and the value of r1 decrease first and be a constant if we use the initial geometry that r1 = rts+1pm and r2 = rts. Which indicate that HA-HB-HC system decompose to an atom HA and a molecule H2(BC).
The "Momenta vs Time" plots with two different initial condition(fig.9 and fig.11) support our statement above. Fig.9 indicates that the HC leaves with constant velocity and the H2(AB) vibrating with a constant momentum. Fig.11 indicates that the HC leaves with constant velocity and the H2(AB) vibrating with a constant momentum.
The reverse of the Trajectories from r1 = rts+δ, r2 = rts
The trajectories (Fig.12) were calculated with following initial conditions and calculation setting.
| Calculation type | Step number | step size / fs | r1 / pm | r2 / pm | p1 / gmol-1pmfs-1 | p2 / gmol-1pmfs-1 |
|---|---|---|---|---|---|---|
| Dynamics | 1000 | 0.1 | 352.2080 | 73.8902 | -5.05855 | -3.21350 |
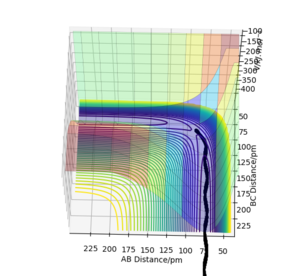
The reveres of (r1 = rts+1pm, r2 = rts)
The plots of “Internuclear Distances vs Time” and “Momenta vs Time” for this calculation are shown in Fig.13 and Fig.14.
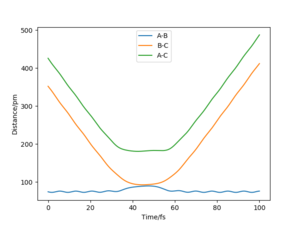
The reserve of (r1 = rts+1pm, r2 = rts)

the reverse of (r1 = rts+1pm, r2 = rts)
As we seem from these plots of the trajectories which starting from the finial condition at time 50 fs of the trajectories with the initial condition of r1 = rts+1pm, r2 = rts and p1 = p2 = 0. The internuclear distance between HB and HC constantly decrease to the distance of 91.77 pm first, then this value increase after a plateau period and the The internuclear distance between HA and HB slightly increased when HC approach but drop back to its original state later. The momentum shows that the the two momentum values is unchanged in value but the sign was reversed. These plots indicate that HC atom approaches the H2(AB) molecule first to form a system near to the transition state that HA-HB-HC, but the HC atom do no have enough initial kinetic energy to form the molecule H2(BC), so, the HC atom then leave with a opposite momentum that have same numeric value as its initial momentum. The molecule H2(AB) remain in their original position after this collision and vibrate with a momentum of an opposite sign.
Reactive and unreactive trajectories
For the initial position r1 = 74 pm and r2 = 200 pm, five trajectories with the following momenta combinations were calculated
The tables shows us that for trajactories to be reactive, a high kinetic energy that can overcome the activation barrier is not enough. The kinetic energy should be distributed in the right translational and vibrational mode, otherwise the reaction path for may recross the energy barrier and reactant will be reformed, even if the system have a high initial energy.
Excellent! Mys18 (talk) 22:50, 24 June 2020 (BST)
Transition State Theory
There will be a large derivation from the experimental value, it assumes that all trajectories with kinetic energy larger than the activation energy will be reactive but it did not take account the possibility that the trajectories with high initial kinetic energy may also go back to the reactant if it recross the barrier (see example in fig.18), so the rate will be underestimated using this this theory. This theory also fails to take account the effect of quantum tunnelling that enable the reactant to go directly to the product without having energy excessing the activation energy. This theory also assume that only reactant are in equilibrium with the transition state while it is not realistic in many case (equilibrium reaction in thermodynamic condition). Furthermore, not all the kinetic energy will follow the Boltzmann distribution.
Great job, remember TST vs. experimental so I think that's what you meant. TST overestimates the rate of reaction. You could go aead and reference all those assumptions. Even name a few more in your answer. Mys18 (talk) 22:52, 24 June 2020 (BST)
F-H-H system
PES inspection
By inspecting the valley floor in a potential energy floor of a F-H-H (Fig.20) system, we find potential of the part that correspond with the a HF molecule and a separate H atom is lower than the potential of the part that correspond with a H2 molecule and a separate F atom. Therefore, we classify that the H2+F reaction is exothermic while H+HF reaction is endothermic.
This could be explained by the fact that the H-F bond is much stronger than a H-H bond due to the large electronegativity difference between H and F. H-F is a strong ionic bond while H-H is only a weak covalent bond. As a result, the reaction from F + H2 to H + HF involved with low energy taken to break a weak H-H bond and high energy released in forming a H-F bond, hence exothermic. The reaction from H + HF to F + H2 involved with high energy taken to break a strong F-H bond and low energy released in forming a H-H bond, hence endothermic

Fantastic discussion! You could even justify your answer one step further by searching literature for the bond energies of H2 and HF to experimentally prove indeed HF has a greater value than H2. Mys18 (talk) 22:54, 24 June 2020 (BST)
Transition state.
The transition state geometry is determined by trying various value to find the the value of rHF and rHH that results a stationary trajectory when the initial momentums are set to zero. The Hammond's postulate is used to find the position of the transition. As the reaction from F + H2 to H + HF is exothermic reaction and a early TS one, the transition state structure will resemble the structure of the reactant, so rHH will be smaller than rHF.
The predict position of the the transition state (fig.21) is rHF = 181.1pm and rHH =74.5 pm, which is proven by the internuclear distance vs time plot in this geometry with zero initial momentum (fig.22). Potential energy in the transition state was found to be -433.980 kJ/mol.


Values look as expected. Good unit inclusion. Mys18 (talk) 22:55, 24 June 2020 (BST)
Activating energy
The activation energy is shown in the table below.
| Reaction | The TS energy / kJ.mol-1 | The reactants energy / kJ.mol-1 | The activation energy energy / kJ.mol-1 |
|---|---|---|---|
| F+H2 | -433.980 | -435.851 | +1.870 |
| H+HF | -433.980 | -560.172 | +126.192 |
The activation energy is the energy difference between the reactant and the TS state. The energy of the reactant was estimated by plotting the reaction path on a potential energy surface.
Reactive trajectory for the F + H2,
The trajectories (Fig.23) were calculated with following initial conditions and calculation setting.
| Calculation type | Step number | step size / fs | rFH / pm | rH2 / pm | pFH / gmol-1pmfs-1 | pH2 / gmol-1pmfs-1 |
|---|---|---|---|---|---|---|
| Dynamics | 3000 | 0.1 | 170 | 74 | -1.6 | 0.2 |
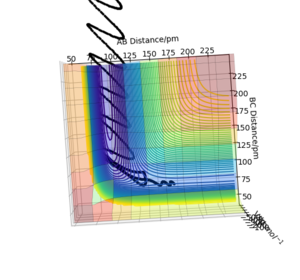
The energy vs time plot for this reaction is shown below.(Fig.24)
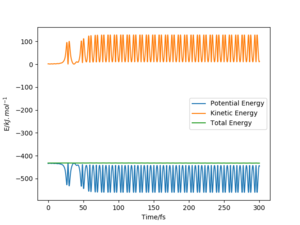
In this reaction we could clearly see from the energy vs time plot that the potential energy was first converted to the kinetic energy of the vibration of the bonds in the transition state. This vibrational energy was periodically covert back to the potential energy in which is indicated by the the fluctuating line in the (Fig.24).After the time pass 37 fs. Some part of this vibrational energy was converted to the translational energy of the leaving atom. Dnd the potential energy permanently drops. Which indicate that the potential energy release in this reaction is converted to vibration energy and then the vibration energy is converted the transitional energy.
To confirm this conclusion, we could use IR spectroscopy to determine the intensity of the overtone peaks and the the main peak. The potential energy that converted to the vibrational energy will cause the higher level vibrational modes to be excited, and therefore in overtone peak intensity in the IR spectrum will increase and the main peak will decrease. Then, due to the vibrational energy is converted to the thermal energy, the overtone peak will decrease in intensity and main peak will then increase in intensity.
How would you measure thermal changes experimentally? You can even check out 'chemiluminescence' which may be useful in monitoring the emission of infrared radiation from the sample. Mys18 (talk) 22:56, 24 June 2020 (BST)
illustration of Polanyi's empirical rules
The Polanyi's rule suggest that the reactant vibrational energy is more effective than the transitional energy to overcome the barrier of a later transition state reaction and the transitional energy is more effective than the vibrational energy to overcome the barrier of a early transition state reaction.
For the initial position rHH = 74 pm, rFH = 230 pm and pFH = -1.0 g.mol-1.pm.fs-1, several trajectories with the following momenta were calculated.
We could clearly see that these trajectories have high initial kinetic energy, and most of the kinetic energy is distributed in the vibration mode. A high kinetic energy distributed in this way is need for the trajectory to be reactive. But, if we distribute more initial kinetic energy in the translational mode instead of the vibrational mode, a lower total kinetic energy is needed for the reaction to take place(see below ).
| rFH / pm | rHH / pm | pFH / gmol-1pmfs-1 | pHH / gmol-1pmfs-1 | Etot / kJ.mol-1 | reactive | illustration |
|---|---|---|---|---|---|---|
| 230 | 74 | -5.05855 | -3.21350 | -432.833 | Reactive | 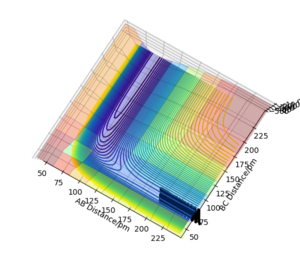 |
These trajectories represent the reaction from F + H2 to HF + H, which is a exothermic reaction, and the position of the transition state is in the early part of the reaction profile. These cases agree with the Polanyi's empirical rule that the transitional energy is more effective than the vibrational energy to overcome the barrier of a early transition state reaction.
Other trajectories that represent the reaction from HF + H to F + H2 were calculated below with rHH = 230 pm, rFH = 74 pm,step numebr = 3000 and step size = 0.1 fs.
| pFH / gmol-1pmfs-1 | pHH / gmol-1pmfs-1 | Etot / kJ.mol-1 | reactive | illustration |
|---|---|---|---|---|
| -0.1 | -5 | -392.600 | Unreactive |  |
| -0.1 | -8 | -353.900 | Unreactive | 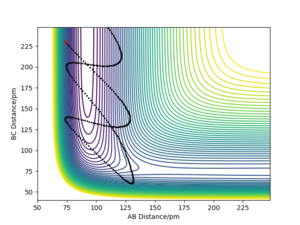 |
| -0.1 | -10 | -318.100 | Reactive |  |
| -3 | -1 | -414.369 | Reactive | 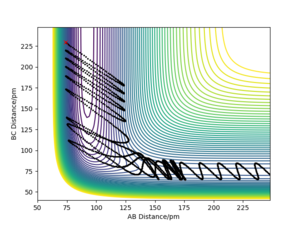 |
These trajectories represent the reaction from HF + H to F + H2, which is a endothermic reaction, and the position of the transition state is in the late part of the reaction profile. As we seem from the first three trajectories with high initial kinetic energy with most of the kinetic energy distributed in the in the translational mode, a high total initial kinetic energy is needed for the trajectories to be reactive. But if we distribute more of initial kinetic energy in the vibration mode (higher PFH), a lower total kinetic energy is needed for the trajectories to be reactive. These cases agree with the Polanyi's empirical rule that the vibrational energy is more effective than the translational energy to overcome the barrier of a later transition state reaction.
This is a perfect discussion with obvious understanding of Polanyi's rule! Mys18 (talk) 22:58, 24 June 2020 (BST)


