MRD:zl4817
H + H2 System
Ng611 (talk) 18:43, 30 May 2019 (BST) Overall a good report! No major mistakes although one or two of your answers could have been more detailed. Try to think of how you could extend your work beyond what is required in the lab script (suggestions for future work, additional experiments, etc.)
Basics of Transition State
On a potential energy surface (PES) diagram, the transition state refers to the 'saddle point', which is the point of maximum on a lowest energy pathway linking the reactant(s) and product(s). [1]
- A saddle point is defined as a point on the surface of the graph of a function where the slopes (derivatives) in orthogonal directions all equal to zero. It is not a local minimum of the function.
- Mathematically, when the first partial derivatives Vr1 and Vr2 both equal to zero at a certain point, and the value of (Vr1r1Vr2r2 - V2r1r2) < 0 at that same
point, then it is a saddle point.
- Additionally, for a saddle point, one of the second partial derivatives (Vr1r1 and Vr2r2) will be a positive value, while the other one will be a negative value.
When (Vr1r1Vr2r2 - V2r1r2) > 0, and Vr1r1 > 0, the point is a local minimum. [2]
Ng611 (talk) 18:35, 30 May 2019 (BST) Good!
Locating Transition State
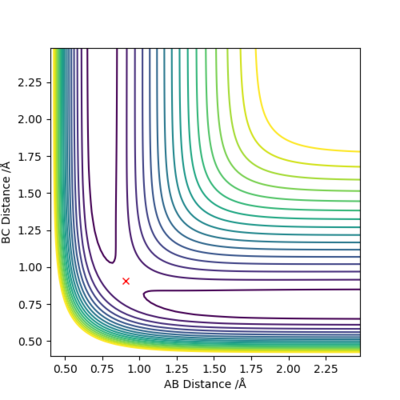
When we set the values for r1=r2=0.907 Å and p1=p2=0.0, using 'Dynamics' calculation type:
The point of minimum potential energy is estimated to be r=0.9078 Å.
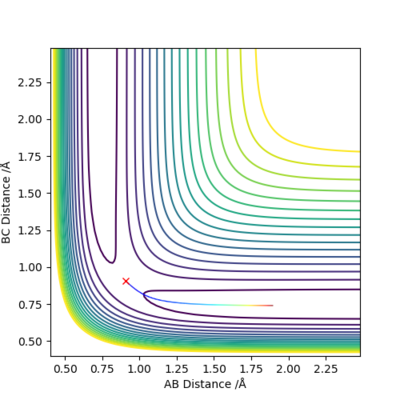
When we allow r1=r2=0.9078 Å, checking the 'contour' plot (Figure 1): the gradient of r2 against r1, V(r1, r2)=0.
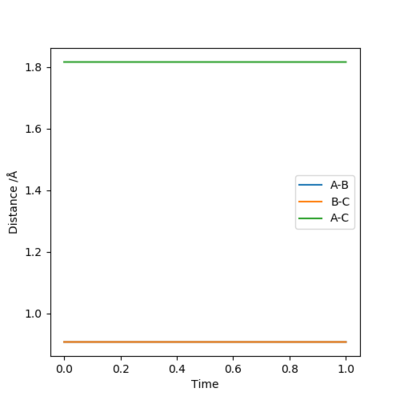
Checking the 'internuclear distances vs time' plot (Figure 2): the internuclear distance remains constant as time changes.
Therefore r=0.9078 Å is a good estimation of the 'saddle point' of potential energy surface diagram, which represents the location of transition state.
rts=0.9078 Å.
 |
 |
|---|
Differences between MEP and Calculated Trajectory
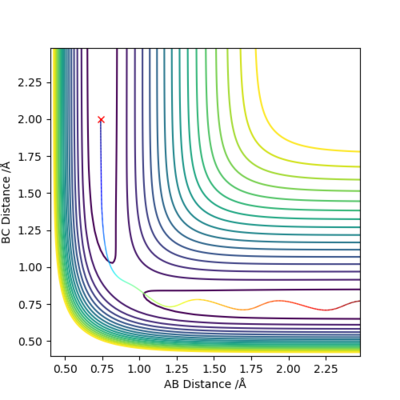
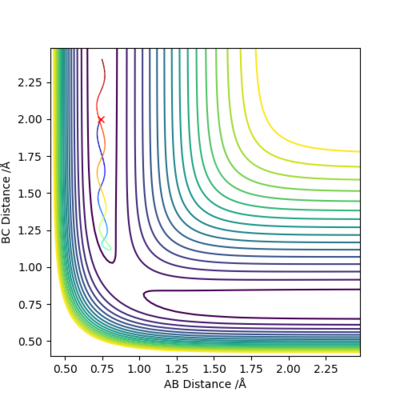
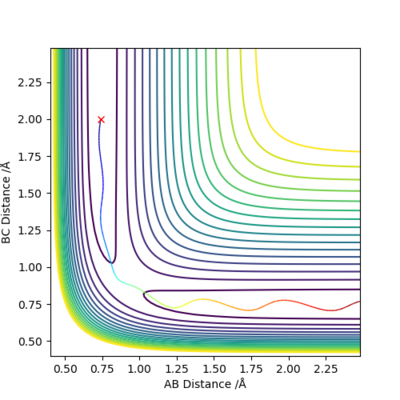
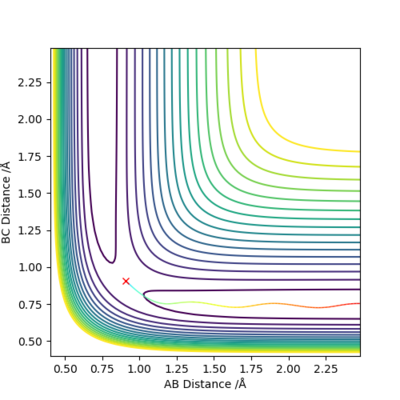
When we set r1=0.9088 Å, r2=0.9078 Å, p1=p2=0.0 for the new calculation, the two calculation methods give rise to different plots:
 |
 |
|---|
 |
 |
|---|
The Dynamics calculation method accounts for conversion of kinetic energy to vibrational energy, as shown by the oscillating momentum (Figure 3.2), and oscillation in the new bond formed (Figure 3.1).
The MEP calculation method does not account for bond vibrations, hence the momentum of the newly formed molecule is a straight line (Figure 4.2), and there is no oscillation in the new bond (Figure 4.1).
Analysing Reactivity of Trajectories
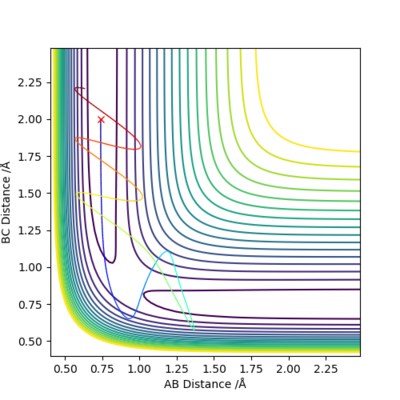
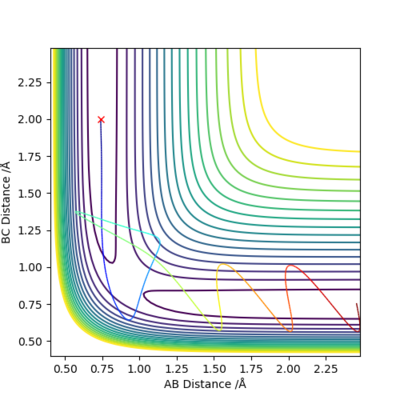
For the initial positions r1 = 0.74 and r2 = 2.0, run trajectories with the following momenta combination and complete the table.
Conclusions:
Reactant starts at the same position with same amount of potential energy but different amount of kinetic energy each time.
- An increase in the kinetic energy of initial reactant will allow the reaction to occur if the energy and the momentum are sufficient to overcome the energy barrier at transition state.
- If the kinetic energy is not sufficient to overcome the energy barrier at transition state, no reaction could occur.
- If the kinetic energy is too high, it may cause the product to reverse back to the reactant, even if it could successfully overcome the energy barrier at the transition state.
Comparisons between Transition State Theory and Experimental Values
The transition state theory [3]has assumed that:
- A molecular system that has crossed the transition state to form product(s) cannot reverse back and reform the reactant(s) i.e. the transition state will not collapse back to the state of reactant(s).
- Motion along the reaction coordinate in the transition state may be separated from other motions and treated classically as a translational motion.
- Even in the absence of equilibrium between reactant and product species, the transition states that are becoming products are distributed among their states according to the Maxwell-Boltzmann laws.
- According to Born-Oppenheimer approximation, [4] motions of atomic nuclei and electrons can be separated due to the large difference in their masses. Hence, the nuclei are assumed to be stationary with respect to the electrons.
From the simulated experimental result of Reaction 4 (p1=-1.5 and p2=-2.5), it is shown that the product will reverse back to the reactant. This is contradictory with the first assumption. Which means the rate of the reaction decreases due to the reforming of the reactant.
Due to insufficient experimental data obtained, we could not further verify the other assumptions.
Ng611 (talk) 18:37, 30 May 2019 (BST) Do you have any suggestions for verifying the other assumptions?
F - H - H System
Inspection of PES
| Reaction | Type of Reaction | Bond Strength [5] Comparison | Transition State Location |
|---|---|---|---|
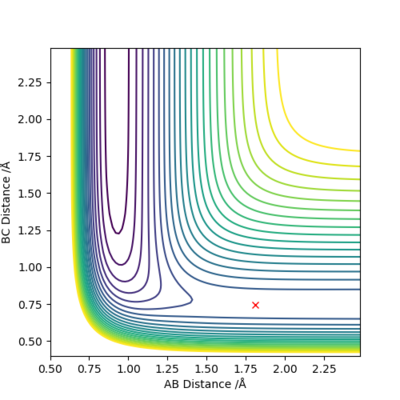
| F + H2 → HF + H | Exothermic | Formation of H-F Bond (-565 kJ/mol) and breaking of H-H Bond (+436 kJ/mol) | r1=1.813 Å, r2=0.745 Å |
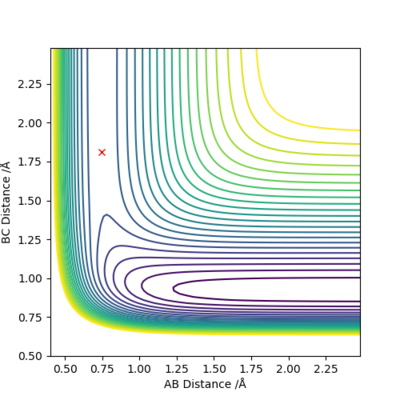
| H + HF → F + H2 | Endothermic | Formation of H-H Bond (-436 kJ/mol) and breaking of H-F Bond (+565 kJ/mol) | r1=0.745 Å, r2=1.813 Å |
Analysis of Data
Set the initial momenta p1=p2=0.0:
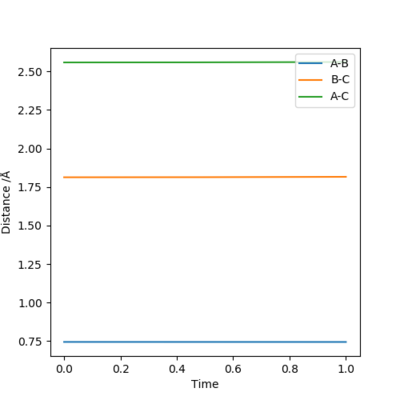
The point of transition state is still found at the location where gradient V(r1, r2)=0 on a contour plot, and where the internuclear distance remains constant as time changes on a internuclear distances vs time plot.
Formation of a bond involves release of energy (represented as negative value) while breaking of a bond involves absorption of energy (represented as positive value).
In the first reaction, F + H2 → HF + H, the overall energy change would be -129 kJ/mol, which shows that it is an exothermic reaction i.e. overall releasing energy.
By Hammond's Postulate, [6] in an exothermic reaction, the energy of transition state will be closer to the reactant(s) i.e. an early TS; transition state will also resemble the reactant(s).
In the second reaction, H + HF → F + H2, the overall energy change would be +129 kJ/mol, which shows that it is an endothermic reaction i.e. overall absorbing energy.
By Hammond's Postulate, in an endothermic reaction, the energy of transition state will be closer to the product(s) i.e. a late TS; transition state will also resemble the product(s).
 |
 |
|---|
 |
 |
|---|
Activation Energies of Reactions
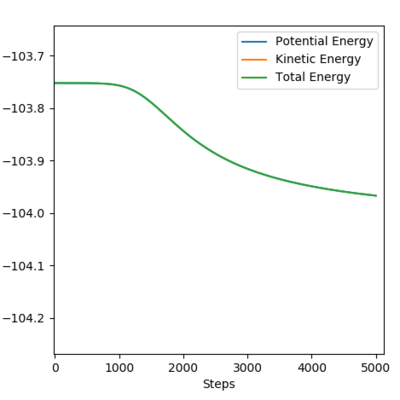
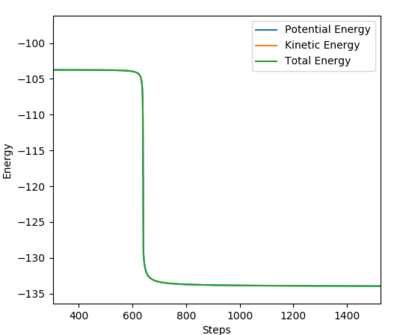
Performing a calculation with MEP methods, number of steps = 5000; plotting Energy vs Time:
 |
 |
|---|
| Reaction | Activation Energy |
|---|---|
| F + H2 → HF + H | 0.210 kcal/mol |
| H + HF → F + H2 | 28.405 kcal/mol |
The activation energy of F + H2 → HF + H is determined as -103.752 - (-103.962) = 0.210 kcal/mol.
The activation energy is low as the energy of TS is very close to that of the reactants i.e. an early TS.
The activation energy of H + HF is determined as -104.852 - (-133.257) = 28.405 kcal/mol
The activation energy is higher as the energy of TS is closer to that of the products i.e. a late TS.
Mechanism of Reaction Energy Release
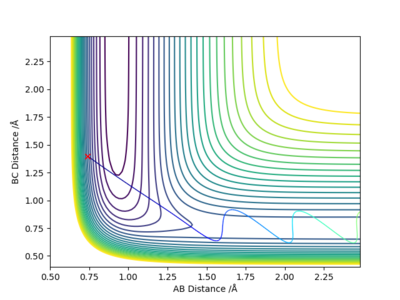
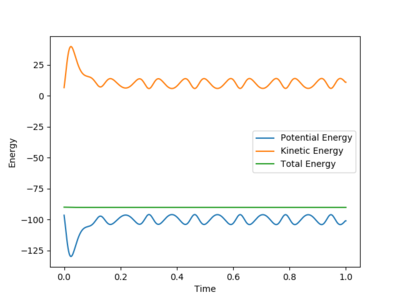
To generate a successfully occurred reaction, we choose r1= 0.740 Å, r2= 1.800 Å; p1= 3.0, p2= -0.5, using dynamic calculation method:
After the reaction takes place, from the energy vs time plot (Figure 17), we can see that potential energy decreases while kinetic energy increases. This could prove that the reaction is an exothermic one; a reasonable experimental observation would be an increase in the temperature sensor reading after reaction starts.
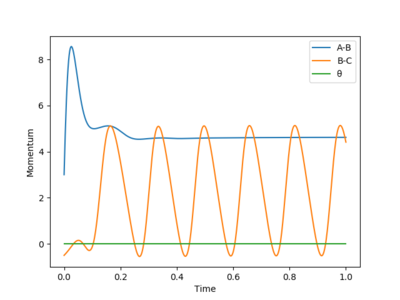
From the momenta vs time plot (Figure 18), we can see that the vibration of bond A-B gradually decreases and vanishes.This shows that bond A-B corresponds to the H-H bond broken. Therefore, bond B-C would be the new H-F bond formed. The H-F bond continues its vibration motion and eventually becomes the only source of momentum. This means that excess kinetic energy possessed by the F atom was converted to vibrational energy after the reaction has occurred.
The extent and modes of the H-F bond vibration can be measured by Raman spectroscopy. [7]
Ng611 (talk) 18:39, 30 May 2019 (BST) More detail is needed here. What exactly would you expect to see?
 |
 |
 |
|---|
Energy Distribution, Reaction Efficiency and Transition State Position
For the reaction H + HF → F + H2, it is assumed that there is little vibration in H-F bond (i.e. pHF = 0.2), meanwhile the H atom approaches with high kinetic energy (pHH = 5).
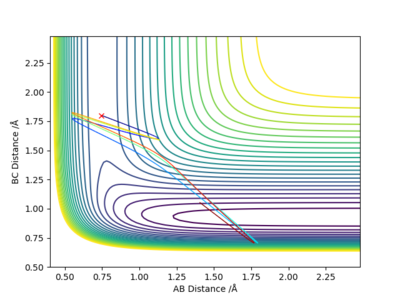
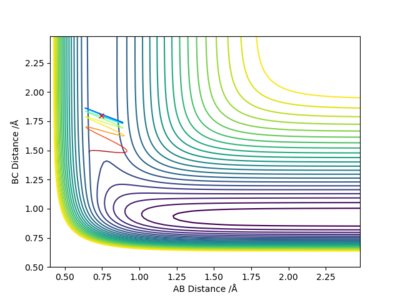
When r1= 0.740 Å, r2= 1.800 Å, from the contour plot (Figure 19), we can see that high kinetic energy possessed by the H atom allows it to break the H-F bond and the system proceeds towards the product side; however, HF is reformed, and the entire process is repeated. This is an oscillating reaction.
By decreasing pHH to 2.6 and increasing pHF to 0.3, we can now obtain a reactive trajectory (Figure 20). The reaction proceeds towards the product side.
 |
 |
|---|
The exothermic reaction (H + HF → F + H2) has a late transition state which resembles the products. Hence, vibration energy possessed by reactants will be more effective than kinetic energy for crossing the energy barrier.
The endothermic reaction (F + H2 → HF + H) has an early transition state which resembles the reactants. Hence, kinetic energy possessed by reactants will be more effective than vibration energy for crossing the energy barrier.
Therefore, higher kinetic energy is favoured by an early transition state, and higher vibrational energy is favoured by a late transition state.
References
- ↑ Peter Atkins and Julio de Paula, Physical Chemistry (8th ed., W.H. Freeman 2006), p.809 ISBN 0-7167-8759-8
- ↑ Widder, D. V. (1989), Advanced calculus, New York: Dover Publications, p. 128, ISBN 0-486-66103-2
- ↑ Steinfeld, J. I., Francisco, J. S., & Hase, W. L. (1999). Chemical kinetics and dynamics. Upper Saddle River, N.J: Prentice Hall.ISBN 0-137-37123-3
- ↑ Max Born; J. Robert Oppenheimer (1927). "Zur Quantentheorie der Molekeln" [On the Quantum Theory of Molecules]. Annalen der Physik (in German). 389 (20): 457–484. Bibcode:1927AnP...389..457B. doi:10.1002/andp.19273892002
- ↑ E.R. Cohen, T. Cvitas, J.G. Frey, B. Holmström, K. Kuchitsu, R. Marquardt, I. Mills, F. Pavese, M. Quack, J. Stohner, H.L. Strauss, M. Takami, and A.J. Thor, Quantities, Units and Symbols in Physical Chemistry, IUPAC Green Book, Third Edition, Second Printing, IUPAC & RSC Publishing, Cambridge (2008)
- ↑ Hammond, G. S. (1955). "A Correlation of Reaction Rates". J. Am. Chem. Soc. 77 (2): 334–338. doi:10.1021/ja01607a027.
- ↑ Gardiner, D.J. (1989). Practical Raman spectroscopy. Springer-Verlag. ISBN 978-0-387-50254-0.

