MRD:yy11518
Molecular Reaction Dynamics: Applications to Triatomic systems
EXERCISE 1: H + H2 system
Q1: On a potential energy surface diagram, how is the transition state mathematically defined? How can the transition state be identified, and how can it be distinguished from a local minimum of the potential energy surface?
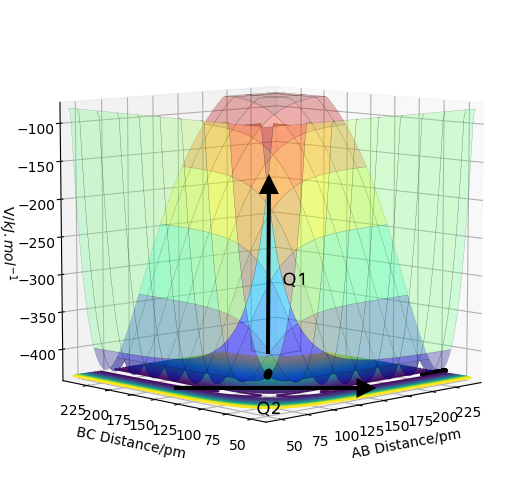
This diagram shows the two newly set coordinates Q1 and Q2, where
with
Where do you have these equations from? I cannot validate them without reference. Of course it is ok if you devise them yourself, but then you must provide me with the intermediate steps and clean definitions so I can see how you arrived there. To name an example: beta seems to be an angle, at first I thought it would be the angle between the atoms. However, you define it via the masses, which are constant and all the same - thus, based on your last equation, "beta" is a constant and equals 60°. Fdp18 (talk) 12:02, 24 May 2020 (BST)
Q1 describes the simultaneous motion of atom A and C with respect to atom B and Q2 is the reaction coordinate where atom C approaching B as atom A moving apart from B.
To find out the transition state, the derivative and the second derivative of Q1 and Q2 are calculated respectively. It is the case when
- ∂V(q1)/∂q1=0 and ∂V(q2)/∂q2=0
- ∂V2(q1)/∂q12 > 0 and ∂V2(q2)/∂q22 < 0
Transition state is a first-order saddle point while local minimum is extrema point (smallest).
I recommend you revise curve sketching and look into "stationary points" and extrema in general - a saddle point is a local extremum as well.Fdp18 (talk) 12:04, 24 May 2020 (BST)
To distinguish between them, we can use the Hessian matrix : If the Hessian is positive-definite at x, then f attains an isolated local minimum at x. If the Hessian has both positive and negative eigenvalues, then x is a saddle point for f.
This last criterion (definiteness) gives you any saddle point, not just the TS. Fdp18 (talk) 12:04, 24 May 2020 (BST)
Q2: Report your best estimate of the transition state position (rts) and explain your reasoning illustrating it with a “Internuclear Distances vs Time” plot for a relevant trajectory.
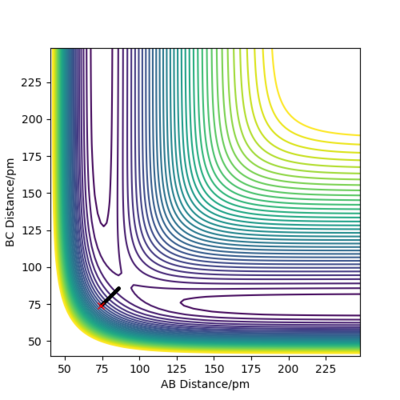
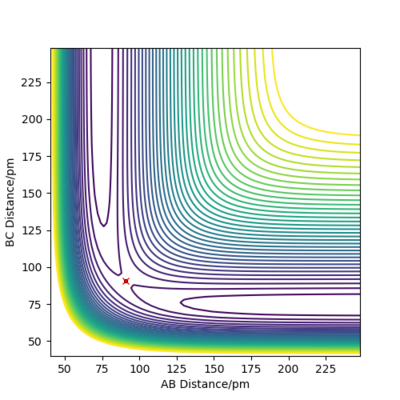
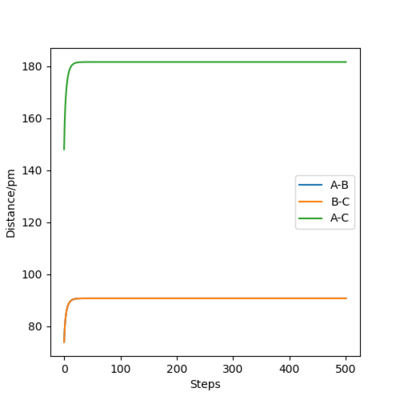
The following plot illustrates the surface plots and distance vs time plots at two initial distances. First, the initial distance is set to be rAB=rBC=74 pm. On the contour plot, the red cross describes the initial distances and the black line is the motion of the atoms without external forces. The end of that line on top right is where the atoms becomes stable which is the transition state of the system. The same situation is shown in the distance vs time plot. At the beginning, there is a significant increase in the distance, corresponding to the black line in the contour graph and meaning the molecules are reaching the transition state. After a while, the curve stays in plateaus at 90.8 pm which is the distance between atoms at the transition state. There is no A-B curve on the figure because it overlaps with the B-C curve.
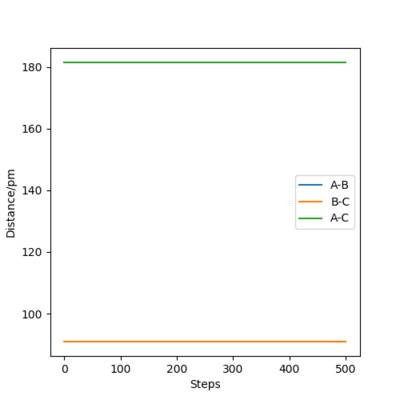
To proof that 90.8 pm is the rts, same plots are run at the initial distance equals to 90.8 pm. It shows that there is no motion of the atoms (the black line) on contour plot and a straight horizontal line in distance vs time graph, proving that rAB = 90.8 pm.
Good approach and good explanation. I take it that you did a MEP in the first run and dynamics in the second ("proof" run) - this could be expressed clearer.Fdp18 (talk) 12:07, 24 May 2020 (BST)
| Initial distance between atom A & B and B & C /pm | |
|---|---|
| 74 | 90.8 |
| Contour plot | |
|
|
| Distance vs Time plot | |
|
|
Q3: Comment on how the mep and the trajectory you just calculated differ.
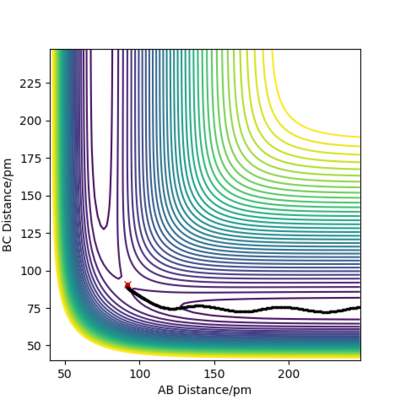
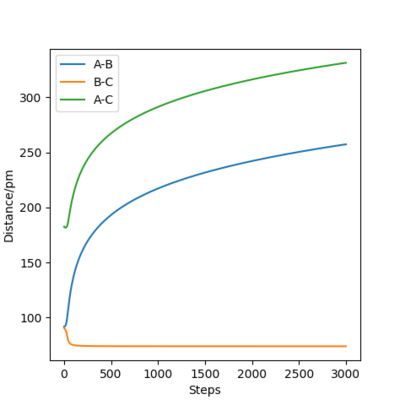
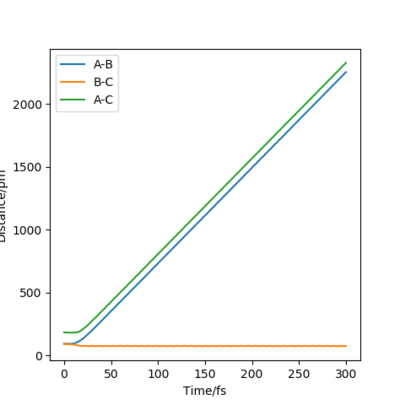
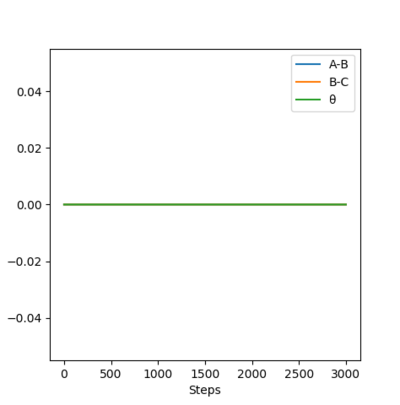
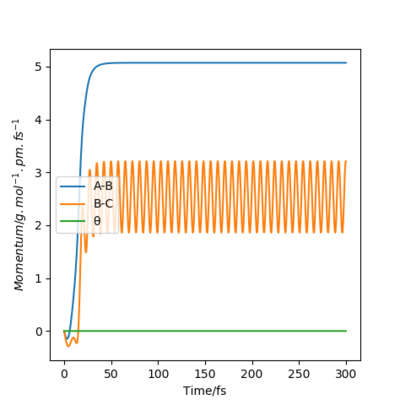
The initial distance between atoms are set to be r1=rts=90.8 pm and r2=91.8 pm, with step number 3000 and step size 0.1 fs. Also, the initial momenta p1 and p2 are zero. Due to the small deviation in r2 from rts , the atoms move to reach transition state. The following figures describe the changes of intermolecular distances and momenta in the reaction path, where two calculation methods are used: MEP and Dynamics.
| MEP calculation | Dynamics calculation |
|---|---|
| Contour plot | |

|
|
| Intermolecular distances vs Time plot | |
|
|
| Momenta vs Time plot | |
|
|
Dynamics shows the realistic motion of the atoms, while MEP is a characterized calculation for the atomic motions, where the momenta between atoms is ignored in the whole process. This is clearly illustrated in the dynamic momenta vs time figures, with significant interactions between atom B and C causing momentum. On the other hand, none of the atoms have momenta in MEP calculation. In the dynamic contour plot and internuclear distance vs time plot, the atoms seem to vibrate in the motion, while for MEP ones, there is no bond vibrations between atoms. In addition, it is noticed that due to the vibration, atom A run away from B and C with a faster velocity. Is the higher velocity really a result of the vibration? Think of the distribution of energy amongst vibration and translation, and the conservation of energy. What is the relation between velocity and momentum? What are the assumptions of MEP and dynamics, i.e. what is conserved where? Fdp18 (talk) 12:10, 24 May 2020 (BST)
This is show in the distance vs time plots. After same time, in dynamics one, the distance is over 2000 pm and it is only around 300 in the MEP plot.
Q4: Complete the table above by adding the total energy, whether the trajectory is reactive or unreactive, and provide a plot of the trajectory and a small description for what happens along the trajectory. What can you conclude from the table?
For all the trails, the initial distance is kept to be same (rAB=74 pm and rBC=200 pm), while the initial momenta are set to be the following pairs.
I think you confused your definitions between table and figures - the table matches with the above definition, but the figures do not. Fdp18 (talk) 12:12, 24 May 2020 (BST)
| p1/ g.mol-1.pm.fs-1 | p2/ g.mol-1.pm.fs-1 | Etot | Reactive? | Description of the dynamics | Illustration of the trajectory |
|---|---|---|---|---|---|
| -2.56 | -5.1 | -414.280 | Y | Atom C approaches molecule AB and react with B. After that, atom A get away from the product BC. Thus, a reactive trajectories. In the whole process, the vibration in bonds are mild. | 
|
| -3.1 | -4.1 | -420.077 | N | The atom C does not have enough energy to collide successfully with the molecule. Without reaching the transition state, it then move back to where it comes from. Here it seems to match... Fdp18 (talk) 12:13, 24 May 2020 (BST) | 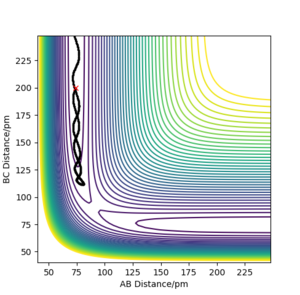
|
| -3.1 | -5.1 | -413.977 | Y | Atom C approaches molecule AB and react with B. After that, atom A get away from the product BC. Thus, a reactive trajectories. In the whole process, the vibration in bonds are mild. | 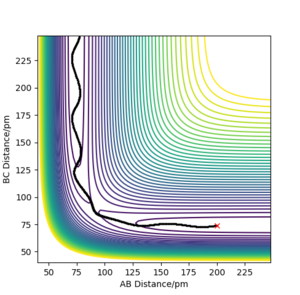
|
| -5.1 | -10.1 | -357.277 | N | The atom C has enough energy to reach the transition state and react with atom B, but after this reaction, the atom A also have excess energy to react with atom B and kick out the atom C. Due to large amount of energy, the atoms vibrates vigorously in the motion. | 
|
| -5.1 | -10.6 | -349.477 | Y | Atom C approaches molecule AB and react with B. After that, atom A get away from the product BC. Thus, a reactive trajectories. Also, high energy allows atoms to vibrate vigorously. | 
|
From the cases above, it can be concluded that the total energy of the system should be in a specific range which is -414<Etot<-349 kJ.mol-1( the specific extreme values need to be tested for more trails). If the energy is not enough, there is no reaction happening because the approaching atom cannot reach the transition state. However, if the energy is in excess, the products will reach again and reform the reactants, leading to a failed reaction.
Q5: Given the results you have obtained, how will Transition State Theory predictions for reaction rate values compare with experimental values?
Transition State Theory assumes a special type of chemical equilibrium (quasi-equilibrium) between reactants and activated transition state complexes. [1] One of the assumptions is that if the molecular system crossed the transition state and formed the products, it cannot be reversed and turned back to reactants. [2] However, the result of the second to last example shows that, although the products are formed, it is still possible to reform the reactants. Because the finite amount of energy is applied for products to tunnel across the barrier. Thus, it is concluded that the Transition State Theory overestimates the rate of the reaction as it fail to state that the formed product may reform reactants in reality.
Correct. For light particles like hydrogen (which is the case here), quantum tunneling through barriers also plays a role. How would the latter affect the rate constant? Fdp18 (talk) 12:15, 24 May 2020 (BST)
EXERCISE 2: F - H - H system
Q6: By inspecting the potential energy surfaces, classify the F + H2 and H + HF reactions according to their energetics (endothermic or exothermic). How does this relate to the bond strength of the chemical species involved?
Above file doesn't existFdp18 (talk) 12:15, 24 May 2020 (BST)
The initial distances are set to be rAB=74 pm and rBC=100 pm, where atom A is fluorine atom and B & C are hydrogen atoms. From the surface plot, it is clearly seen that with the decrease in AB distance, the energy increases, representing the H + HF reaction which is endothermic as the energy is absorbed. While for F + H2 reaction, the fall in the distance of BC causes the energy to decrease. This is the phenomenon of a exothermic reaction, with a net outflow of the energy from the molecular system to the environment. As a result, it can be concluded that the breakage of the HF bond requires more energy than the breakage of HH bond. In other words, the bond energy of HF is greater than the bond energy of HH.
Q7: Locate the approximate position of the transition state.
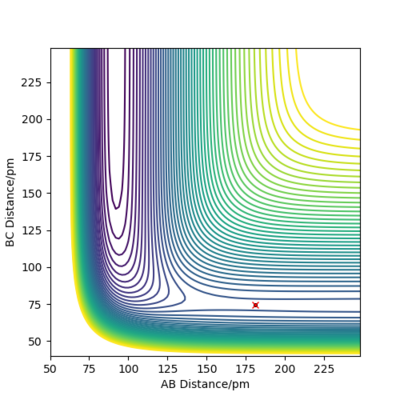
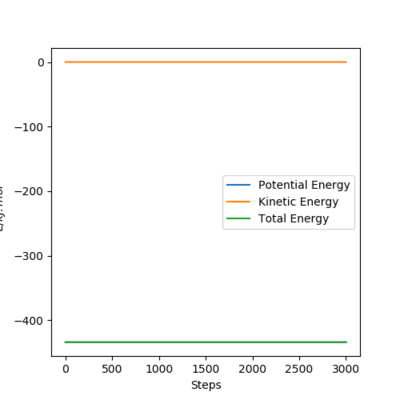
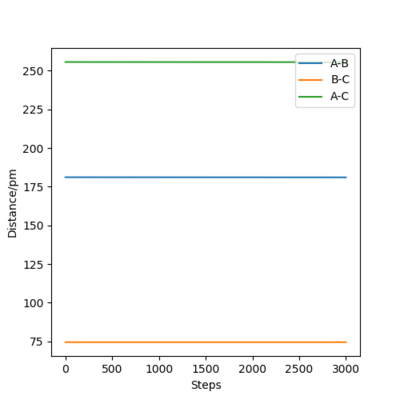
The position of the transition state of this F-H-H system is at rHH=74.5 pm and rFH=181.1 pm. At the transition state, all the three atoms are stationary, and the total energy is constant and equals to the potential energy. This is proved in the energy vs time plot. Additionally, the distances between the atoms are the same, illustrating in the surface plot and the distance vs time plots.
This is correct. However, I cannot see that you did it yourself - how did you arrive at this result? what steps did you take? Fdp18 (talk) 12:19, 24 May 2020 (BST)
Q8: Report the activation energy for both reactions.
The activation energy of a reaction is the energy difference between the reactants and the products. Please read this sentence again - I'm sure you can spot the mistake, since below you have used the correct definition. Fdp18 (talk) 12:22, 24 May 2020 (BST)
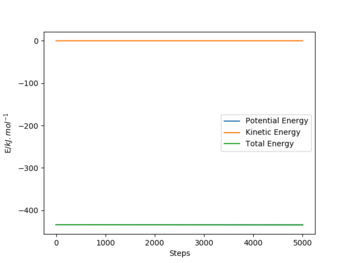
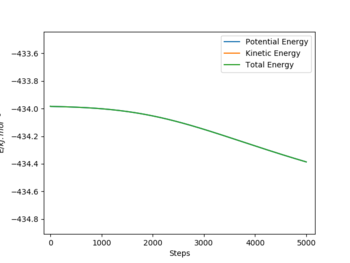
To reach a F+HH system, the rFH is set to be a little bit larger than the distance at the transition state, which is 183.5 pm, with the rHH same as the one at transition state. And the step number is 5000 with a size of 0.1 fs. After plotting the energy vs time graph, it is zoomed in to find that the initial energy is -434.0 kJ.mol-1 and the final energy is -434.38 kJ.mol-1. Thus the activation energy for F + HH reaction is 0.38 kJ.mol-1.
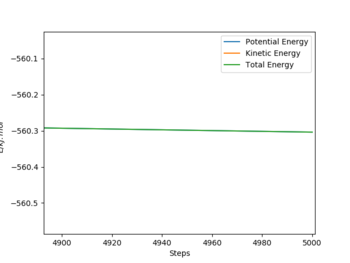
On the other hand, the H+FH system is reached by decreasing the rFH to 179.5 pm from the transition state distance. The distance between H&H and the size & number of the step are kept same. This time, the activation energy is larger, producing a sudden jump in the energy vs time plot, where the energy before and after the reaction is -434.0 kJ.mol-1 and -560.3 kJ.mol-1 respectively. As a result, the activation energy of the H + FH system is 126.3 kJ.mol-1.
The values are qualitatively correct, but as you can see from the "zoomed in" graph, the energies have not yet converged properly. You would need to continue the simulation further. Fdp18 (talk) 12:23, 24 May 2020 (BST)
| System type | Information table | Energy vs Time plot | Energy vs Time plot (zoom in) |
|---|---|---|---|
| F+HH | 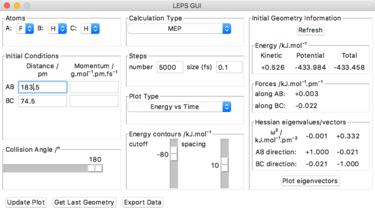 |
 |
|
| H+FH | 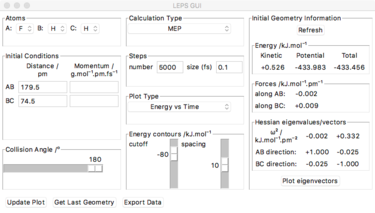 |
 |
|
Q9: In light of the fact that energy is conserved, discuss the mechanism of release of the reaction energy. Explain how this could be confirmed experimentally.
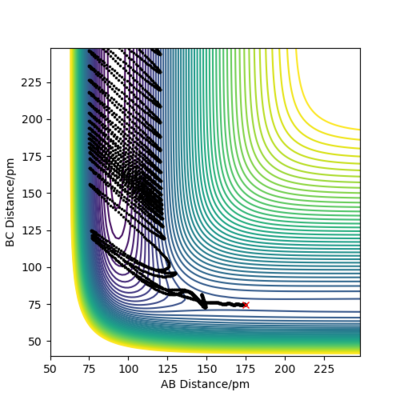
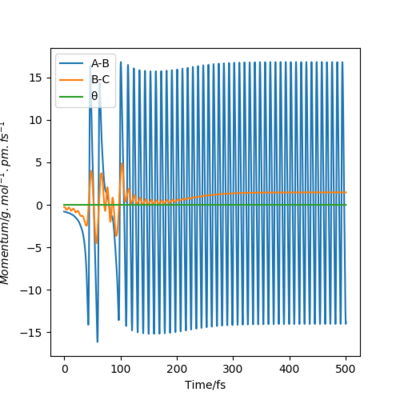
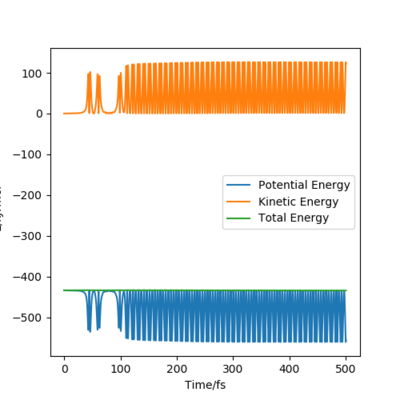
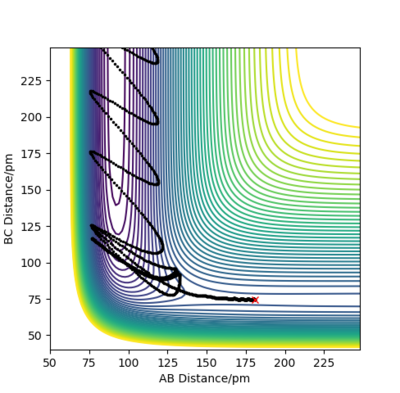
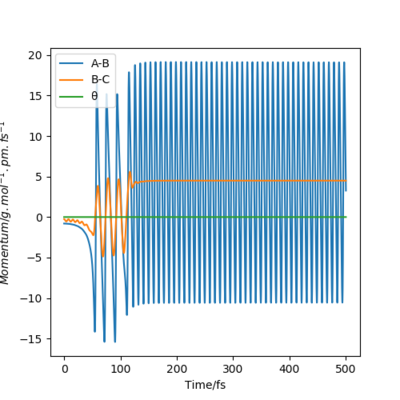
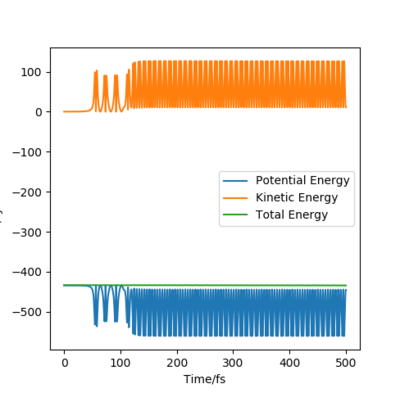
Compare with the transition state initial conditions, there are two ways to push the system F + H to the product side. The first one is to decrease the distance between F and H from 181.1 pm at transition state to 175.1 pm. Another is applying a initial momentum pFH , which equals to -0.8 g.mol-1.pm.fs-1. The contour plots, momenta vs time and energy vs time graphs are run to study the mechanism of release of the reaction energy. And both trails give similar results.
At the beginning, there is small vibration in H2 and F atom and the kinetic energy in both trails are almost zero. As hydrogen molecule and fluorine atom getting closer, they tend to interact with each other, breaking the H-H bond and forming the F-H bond. This process starts at around 50 fs, with some vibration and momenta present. After forming the products, the momenta vs time plot shows that there is much more momenta in the HF molecule than that in the H atom. For the blue line representing HF interaction, the rapid inversion in the sign of the momenta shows that the bond vibration is significant inside the molecule. As time passes, the potential energy increases with fluctuation, and the potential energy decreases. Because energy is conserved, the total energy in the system is same before and after the reaction. Thus the whole process is a conversion among kinetic energy, potential energy and vibrational energy. Experimentally, the release of energy can be monitored by temperature and the vibration energy can be detected by IR.
| Contour plot | Momenta vs Time plot | Energy vs Time plot |
|---|---|---|
 |
 |
|
 |
 |
|
Q10: Discuss how the distribution of energy between different modes (translation and vibration) affect the efficiency of the reaction, and how this is influenced by the position of the transition state.
Polanyi's empirical rules states a relationship between early & late transition state and the mode that the molecule choose to store energy.[3] For the transition state resemble reactants, the translation energy is more efficient, while for the early transition state, vibrational mode is favoured read this sentence and the next one again, and think about how early and late transition states relate to the geometry resembling reactants or products. Fdp18 (talk) 12:27, 24 May 2020 (BST) . According to the Hammond's postulation, early transition state resemble reactants and it is reverse for the late one. Thus, for the H + HF system, which is an endothermic reaction, its transition state resemble to the product which is closer to the transition state. This means that molecule with energy in vibration mode is more efficient for the reaction than that in translation.
This part is a bit too brief, and partly confusing. You could have shown some simulations with early and late transition states, and how vibrational or translational energy affect the outcome. Fdp18 (talk) 12:29, 24 May 2020 (BST)
References
- ↑ IUPAC, Compendium of Chemical Terminology, 2nd ed. (the "Gold Book") (1997). Online corrected version: (2006–) "transition state theory". doi:10.1351/goldbook.T06470
- ↑ Eyring, H. (1935). "The Activated Complex in Chemical Reactions". J. Chem. Phys. 3 (2): 107–115. Bibcode:1935JChPh...3..107E. doi:10.1063/1.1749604.
- ↑ Acc. Chem. Res. 1972, 5, 5, 161–168

