MRD:yw7216
Exercise 1
Q1 : What value do the different components of the gradient of the potential energy surface have at a minimum and at a transition structure? Briefly explain how minima and transition structures can be distinguished using the curvature of the potential energy surface.
r1 is the initial distance of HA and HB and r2 is the initial distance of HB and HC. And the gradient of the potential energy surface for r1 is ∂V(rr1,rr2)/∂r1. And that for r2 is ∂V(rr1,rr2)/∂r2. The graph is in 3D structure, therefore the transition structure (saddle point) and the minimum point both are 0 in gradient (the first derivative). Gradient can't tell whether this is saddle point or minimum point, then the curvature and its determinant could be used. The curvature is the approximation of the second derivative (which are fr1r1(r1,r2) and fr2r2 (r1,r2)), and its determinant is fr1r1(r1,r2)fr2r2 (r1,r2)) -(fr1r2 (r1,r2))2. At the minimum point, both the curvature and the determinant will be greater than 0. But at the saddle point, the determinant of the curvature will be less than 0.
Q2 : Report your best estimate of the transition state position (rts) and explain your reasoning illustrating it with a “Internuclear Distances vs Time” plot for a relevant trajectory.
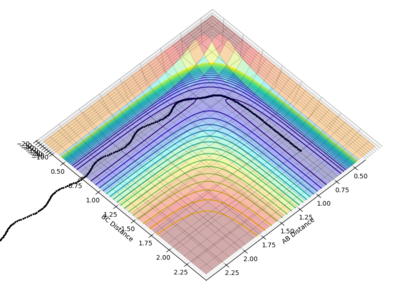
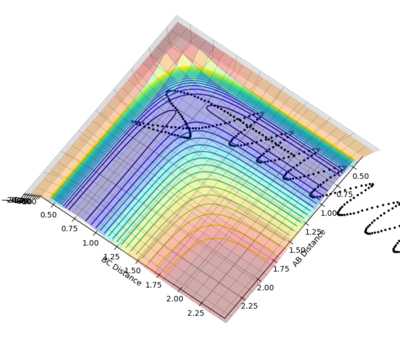
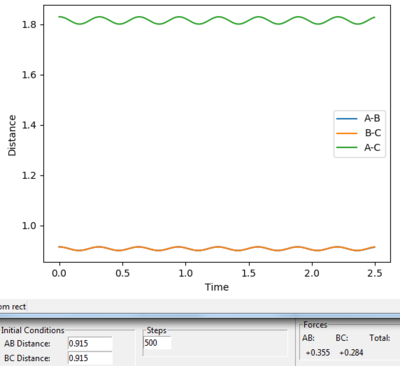
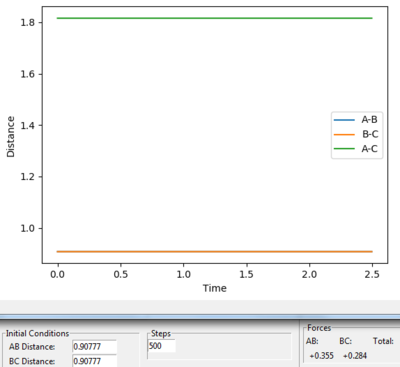
From the plot of distance vs time with the initial settings, the transition state position is at about 0.915 Å (by looking at figure 1 and figure 2)
 |
 |
Because if HA and HB start at the transition position and HA, HB and HC with no initial momenta, they will remain at the transition position forever and therefore no oscillatory behavior will be observed on the Distance vs. time plotting. Therefore set both momenta as 0, and try different values which are close to 0.915 of r1 and r2 until two lines are straight.
 |
 |
Q3 : Comment on how the mep and the trajectory you just calculated differ.
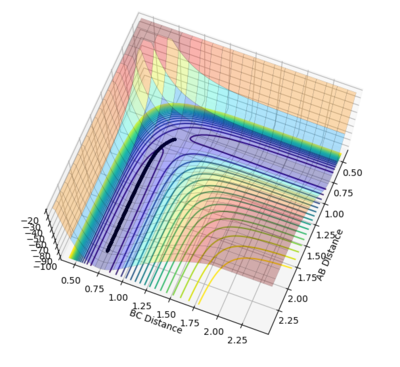 |
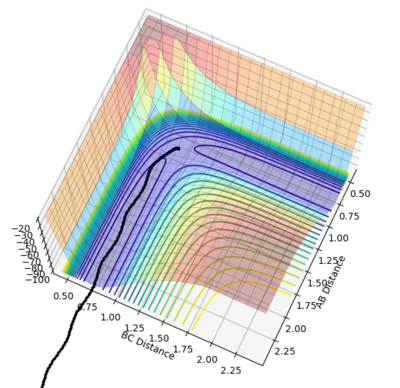 |
r1 was set as 0.91777 and r2 was set as 0.90777, and both calculations were in 10000 steps.
It is obvious that mep provided a lowest energy path which is very smooth but dynamics provided a path with oscillations. The mep method doesn't account for the real motion of the atoms while the dynamic method includes the diatomic vibrations. And mep has a shorter path than dynamics
Jas213 (talk) 01:46, 29 May 2018 (BST) What does MEP mean? It does not allow real motion, because it sets the momentum to zero at each step.
Q4: Complete the table by adding a column with the total energy, and another column reporting if the trajectory is reactive or unreactive. For each set of initial conditions, provide a plot of the trajectory and a small description for what happens along the trajectory.
Jas213 (talk) 01:48, 29 May 2018 (BST) State the initial conditions of your experiment before the table and give an overall concluding comment of what you learned from this experiment. The penultimate and ultimate case are examples of barrier recrossing.
Q5: State what are the main assumptions of Transition State Theory. Given the results you have obtained, how will Transition State Theory predictions for reaction rate values compare with experimental values?
Main assumption [1]
Transition state is in equilibrium with products and reactants
Quantum-tunneling effects are negligible and the Born-Oppenheimer approximation is invoked.
The reactant states atoms are in Boltzmann distributed.
Once the system attains the transition state, with a velocity towards the product configuration, it will not go back to the initial state region again.
Comparison
The assumption stated that the route won't fall back to initial states once it has already reached the transition states, but the 4th set of the analysis, the path fell back to the initial states after reaching the transition state position. Therefore the actual rate of the reaction might be lower than theoretical rate.
The rate of reaction will increase by the tunneling effect [2]
Exercise 2
Q6 : Classify the F + H2 and H + HF reactions according to their energetics (endothermic or exothermic). How does this relate to the bond strength of the chemical species involved?
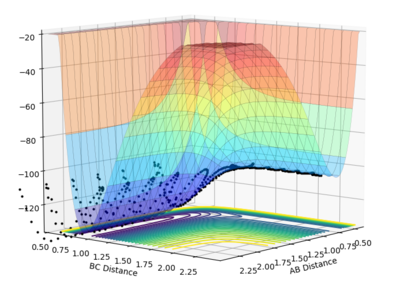 |
 |
(AB is the reactant side and BC is the product side)
For the F + H-H reaction, the reactant side is higher in energy than the product side, therefore this is an exothermic reaction.
For the H + H-F reaction, the product side is higher in energy than the reactant side, therefore this is an endothermic reaction.
The enthalpy change of the reaction is equal to (the total energy of bond broken in reactants) - (the total energy of bond made in products).
The first reaction has a negative enthalpy change, which means the total energy of bond broken (H-H) in reactants is less than that in products (H-F). This indicates H-H has a weaker bond strength than H-F.
The second reaction has a positive enthalpy change, which means total energy of bond broken (H-F) in reactants is more than in products (H-H). This indicates H-F has a stronger bond strength than H-H.
By looking up the literature values, H-H has a bond energy 432 kj/mol and H-F is 565 kj/mol proving that H-F is a stronger bond than H-H.
Q7 : Locate the approximate position of the transition state.
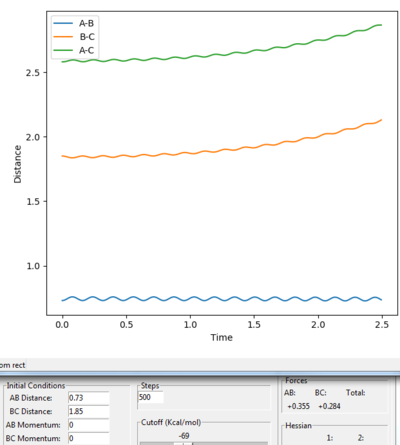 |
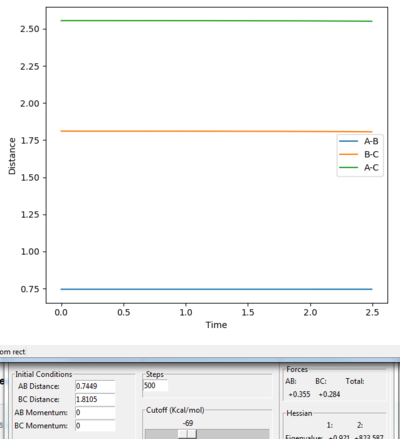 |
According to the hammond's postulate, the structure of the transition state for a exothermic reaction might be much closer to the reactant, by looking at the surface plot for the reaction, A-B =0.73 Å and B-C = 1.85 Å was chosen for the estimation of the transition position. Both momenta were set to 0. We can still see that the distance of A-C and B-C are gradually increasing and there is still oscillation occurs. Jas213 (talk) 01:57, 29 May 2018 (BST) A distance of 0.73 lower than the bond distance of 0.74 A will always oscillate/repel each other.
Then try on different values between 0.73-0.75 Å of A-B and 1.80-1.85 Å of B-C. The best results were found, which the A-B distance (H-H) is 0.7449 Å and the B-C distance (H-F) is 1.8105 Å .
 |
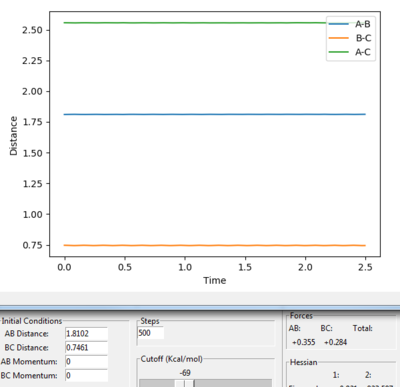 |
The Hammond's postulate also states that the structure of transition state in a endothermic reaction has a closer structure to the product. By looking at the surface plot for the reaction, A-B = 1.86 Å, BC= 0.74 Å was a ideal estimating position of the transition position. Both momenta were set to 0. The oscillation is still visible and the distance of A-B, A-C are still increasing.
Then try on different values, A-B (H-F) = 1.8102 Å and B-C (H-H) = 0.7461 Å is the best estimation results for the transition position.
Jas213 (talk) 01:59, 29 May 2018 (BST) You were only meant to find one TS. It is the same saddle point no matter which way round you look at the reaction.
Q8: Report the activation energy for both reactions.
 |
 |
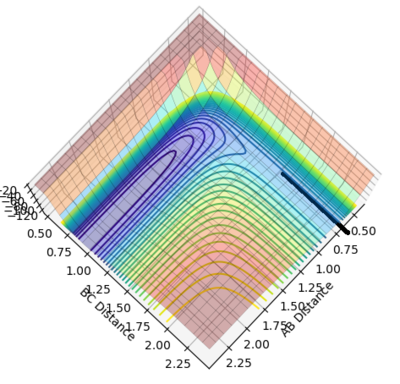 |
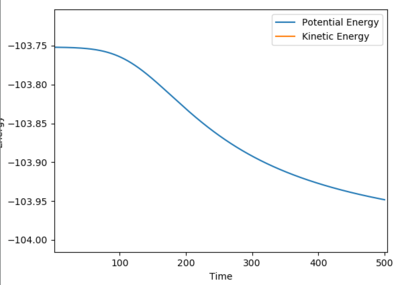
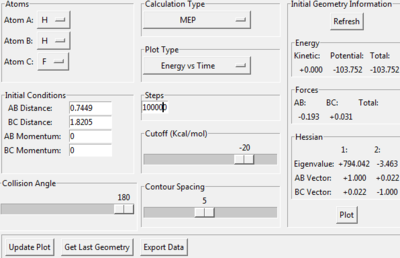
Change the calculation method into mep, slightly increase the distance for BC in 0.01, the path will drop back to reactants ground states (AB reaction sides), then the activation energy could be found.
The activation energy = -103.751 - (-103.947) = + 0.236 kj/mol
Jas213 (talk) 01:59, 29 May 2018 (BST) Units of the software are kcal/mol Nice illustration of your working.
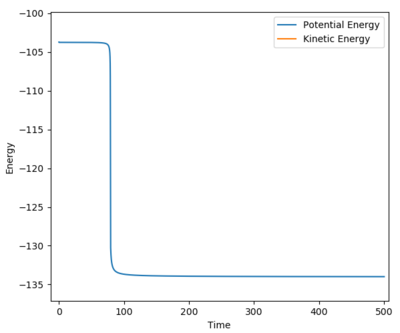 |
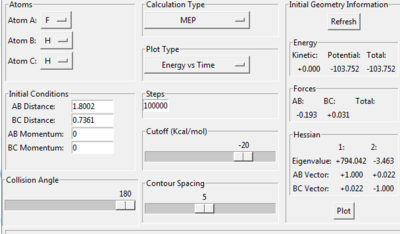 |
 |
For this reaction, decrease the AB distance in 0.01, by looking at the surface plot, the path also falls back to reaction side (AB side).
The activation energy = -103.807 - (-133.844) = +30.037 kj/mol
Jas213 (talk) 02:00, 29 May 2018 (BST) Do the values agree with what you would expect?
Q9: In light of the fact that energy is conserved, discuss the mechanism of release of the reaction energy. How could this be confirmed experimentally?
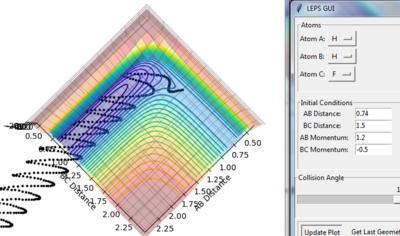 |
 |
When the momentum of H-H becomes 1.2, the reaction is reactive. The path starts at the AB reactant side and ends at the BC product sides.
As the momenta vs. time graph (figure 24) shows, the reaction energy is released as vibrational energy (it oscillated intensively). After H-F (B-C) produced, it vibrated strongly. Before the product forms, most of it is still translational energy
Q10: Discuss how the distribution of energy between different modes (translation and vibration) affect the efficiency of the reaction, and how this is influenced by the position of the transition state.
According to the Polanyi rules, the vibrational energy is more efficient to activate the the late activation barrier than the translational energy, and translational energy is more efficient for the early transition state barrier.[3]
For F + H2 , it is an exothermic reaction which has an early transition state. Therefore the translational energy is the main part of energy to support the activation.
The H + HF reaction is an endothermic reaction that has a late transition state. Therefore the vibrational energy is the main part to support the activation.
Jas213 (talk) 02:02, 29 May 2018 (BST) Correct, but a very lazy reply. Where is your discussion of the validity of polanyi's rules? Where are some sample trajectories varying between -3 and +3 etc.
Reference
[1] T. Bligaard and J. Nørskov, Chemical Bonding at Surfaces and Interfaces, 2008, 255–321.
[2] J. Kästner, Wiley Interdisciplinary Reviews: Computational Molecular Science, 2013, 4, 158–168
[3] G. Czako and J. M. Bowman, Science, 2011, 334, 343–346.

