MRD:yw14815
Introduction
This Wiki page outlines the study of the molecular reaction dynamics of two simple triatomic systems: H + H2 and F + H2. The atoms are 180° to each other, with a 1D space symplification. The atoms are labelled A, B and C, with vectors r1 and r2 representing vectors BA and BC in pm respectively. Momentum are also measured in p1 and p2 in g mol-1 pm fs-1. Below is the systematic diagram of the triatomic system model, which will be referred to throughout the whole wiki. [1]

EXERCISE 1: H + H2 system
Potential Energy Surfaces
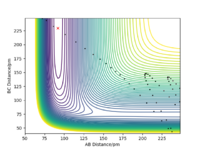
A potential energy surface is a visual representation that describes the potential energy of a system, such as a collective of atoms, in terms of parameters, which normally is the relative positions of the reactants and the products. A reaction path is shown to be the gradient line on a PES diagram, and represents both potential energy and internuclear distances between atoms in the system as a function of the reaction coordinate, thereby modelling their changes through the progress of the reaction.
The PES diagram for Figure 1 above was calculated for the reaction system H + H2 using the parameters given:
| Calculations | Steps | r1 / pm | r2 / pm | p1 / gmol-1pmfs-1 | p2 / gmol-1pmfs-1 |
|---|---|---|---|---|---|
| Dynamics | 500 | 74 | 230 | 0.0 | -5.2 |

The reaction path, which passes through each potential energy minimum, including the transition state, which is a first order saddle point at which the potential energy is at its maximum (highest energy minimum) and where its gradient is 0, hence ∂V(r)/∂r =0 and the second differential at the TS is less than 0.Furthermore, the determinant of the Hessian Matrix is smaller than 0, with the eigenvalues of the Hessian Matrix being one positive and one negative
Local minimum, on the other hand,while also have the first derivative ∂V(r)/∂r =0, its second differential at the minimum is greater than 0, with the eigenvalues of the Hessian Matrix both being positive and the determinant of the Hessian Matrix greater than 0.
Literally speaking, the main difference between transition state and a local minimum is that the transition state is in fact a local energy maximum. Initially, with 0 initial momentum, both transition state and local minimum will remain there forever. However, with a very small momentum added towards the reactants direction, the transition state will be passed and will roll over towards the reactants, and vice versa for products. Testing the trajectories near the transition state is a method used to identify the presence of the transition state. On the other hand, a slightly perturbation from the local minimum will only result in rolling back towards the local minimum, because only a sufficient energy is needed to overcome the energy barrier to escape the "well" of the local minimum. In the PES diagram, a local minimum represents an intermediate, which can be represented in a 2D diagram below.[2]
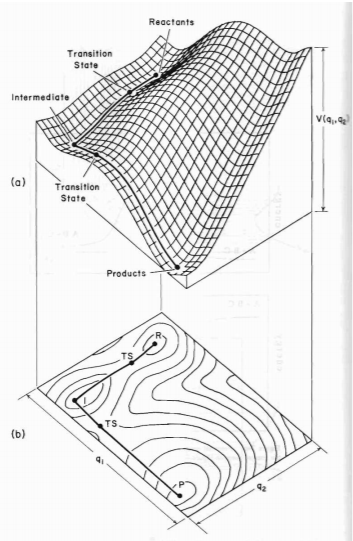
Another interesting observation is that the gradient along the reaction pathway is least steep close to both sides of the transition state, suggesting the point at which bonds are in the process of breaking and forming, hence lower degree of association and less vibrational oscillations. Great. Well done. Mak214 (talk) 09:50, 7 July 2020 (BST)
Locating the Transition State
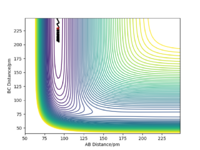
The best estimate of the transition state position (rts) is 90.77 pm. The transition state should be symmetric as it represents the state of the reaction where old bonds and new bonds are in the middle of being broken and formed. As such, given the initial conditions of both momentum p1=0 and p2=0, the two internuclear distances r1 and r2 must be equal at the transitions state. The constant internuclear distances can be understood and found with a "Internuclear Distances vs Time plot" shown in Figure 4 below, where the straight horizontal line suggests constant potential energy with the absence of any vibrational oscillations. Yes. Good job. Mak214 (talk) 09:53, 7 July 2020 (BST)

Calculation of Reaction Path
| Calculations | Steps | r1 / pm | r2 / pm | p1 / gmol-1pmfs-1 | p2 / gmol-1pmfs-1 |
|---|---|---|---|---|---|
| MEP | 50000 | 91.77 | 90.77 | 0 | 0 |
The Potential Energy Surface for MEP Calculation is shown in Figure 5 below.
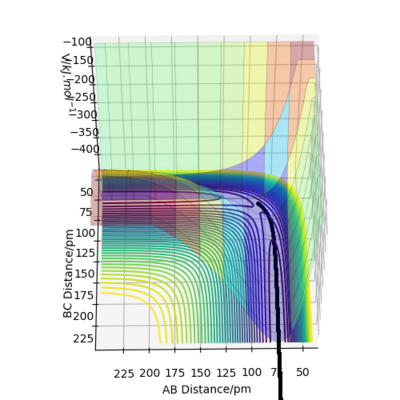
| Calculations | Steps | r1 / pm | r2 / pm | p1 / gmol-1pmfs-1 | p2 / gmol-1pmfs-1 |
|---|---|---|---|---|---|
| Dynamics | 500 | 91.77 | 90.77 | 0 | 0 |
Similarly, the Potential Energy Surface for Dynamics Calculation is shown in Figure 6 below.
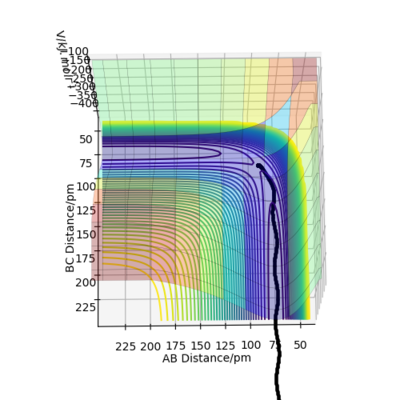
Comparing the Dynamics (Figure 6) and the MEP (Figure 5), it can be seen that the MEP does not take into account of vibrational oscillations within the atoms, but just passing through all the potential minimum. yes. the MEP seeks the nearest local minimum. Mak214 (talk) 09:54, 7 July 2020 (BST)
On the other hand, the trajectory just calculated takes into account of the momentum changes during the reaction by oscillating about the minimum potential energy. In addition, during the calculations, 50000 steps were required to complete the minimum energy path in MEP, while 500 steps were required in Dynamics.
The "Internuclear Distances vs Time" and "Momenta vs Time" graphs for Dynamics calculations are respectively plotted in Figure 7 and 8 below.
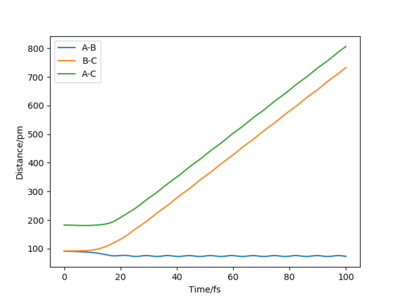

Figure 7 and 8 can help to describe the reaction. Distance r1 (B-C) and r2 (A-C) are seen seen to increase as A moves further away from B-C after the transition state. After an extended period of time, it can be seen that A-C and B-C distances increases linearly, suggesting that the distance A-B is constant and that B-C is moving further away from A. Also,initially, A-B decreases slightly before plateauing/oscillating, suggesting that the bond between A-B has formed and that they are vibrating up and down from equilibrium. The vibration is further suggested by the oscillation of A-B in the Momenta vs. Time graph in Figure 8.
The "Internuclear Distances vs Time" and "Momenta vs Time" graphs for MEP calculations are respectively plotted in Figure 9 and 10 below.

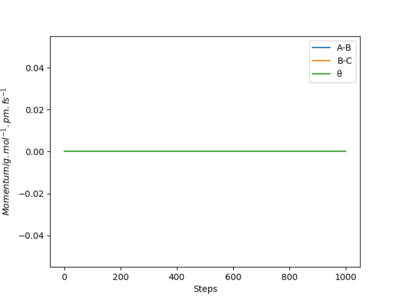
With reference to Figure 9 and 10, the internuclear distance r2 (A-B) decreases rapidly before converging to a limit and plateauing, while r1 (B-C), hence A-C increases rapidly. The whole system has 0 momentum because the momenta/velocities are always reset to zero in each time step.
Also, the final values of the positions r1(t), r2(t), p1(t) and p2(t) for the trajectory for large enough t, at t=100fs are calculated in the table below.
| r1 / pm | r2 / pm | p1 / gmol-1pmfs-1 | p2 / gmol-1pmfs-1 |
|---|---|---|---|
| 735.414 | 75.4847 | 5.08082 | 2.02769 |
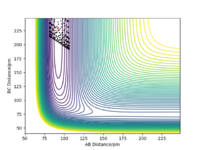
If the initial conditions were r1 = rts and r2 = rts + 1 pm instead, the reaction path will move in the opposite direction, exiting from the opposite direction in the potential energy surface (Figure 11) whereby distance r2 (A-B) increases while the distance r1 (B-C) stays constant with only vibrations of the bond similar to the previous conditions (Figure 12 and 13). Hence, in the first case the transition state moves towards AB + C, while the reverse will be in this case favoring the formation of products A + BC, as A start off further to B than that of C to B.


The distorted transition state, where the values of r1=rts and r2=rts + 1 pm would be inverted for as the previous calculations, with the graphs for internuclear distance and momenta also inverted, such that graph of B-C appears as the original A-B.
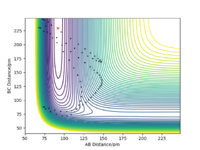
Finally,a calculation was setup where the initial positions correspond to the final positions of the trajectory calculative, above, the same final momenta values but with their signs reversed.
| r1 / pm | r2 / pm | p1 / gmol-1pmfs-1 | p2 / gmol-1pmfs-1 |
|---|---|---|---|
| 735.414 | 75.4847 | -5.08082 | -2.02769 |
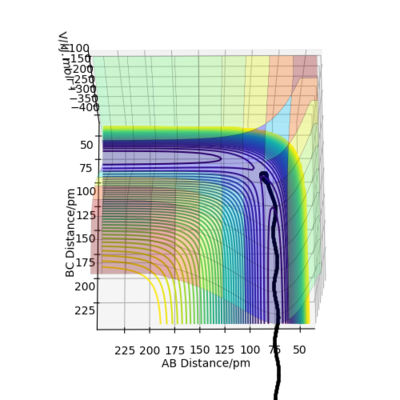


This situation is the reverse of the original situation in which now, the species start off as reactants with just the right starting positions and momenta to reach the slightly distorted transition state. Technically, the three graphs in this situation should be the mirror image of the three graphs in the original situation. However, a perfect symmetrical relationship is not observed due to random errors in estimating through rounding off or sampling errors of the final positions and momenta from the Internuclear Distances vs Time graph and Momenta vs Time graph respectively.For example, in Figure 15, the distance between B-C should be constant after the transition state, but was not the case due to a errors in the initial input data.
Fantastic. Really good use of figures here, clear discussion. Mak214 (talk) 09:57, 7 July 2020 (BST)
Reactive and Unreactive Trajectories
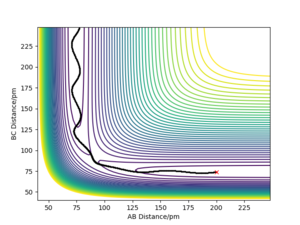
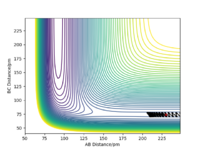
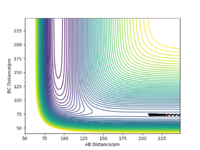
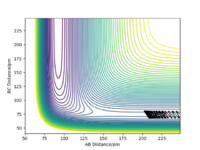
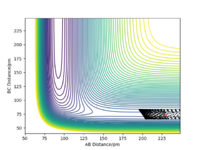
For the initial positions r1 = 74 pm and r2 = 200 pm, various trajectories were ran with different momentum values and combinations as tabulated below.
From the table, it can be seen that while a minimum initial momentum of the species are needed to cross the activation barrier and over the TS to form the products, a much initial momentum does not guarantee product formation as can be seen in the second last scenario. As such, the conditions required for enough momentum given the initial preconditions as listed are: -3.1 < p1/ g.mol-1.pm.fs-1 < -1.6 and p2 = -5.1 g.mol-1.pm.fs-1. Great. Did you check the bounds for P2 momentum also? Your last trajectory falls outside of these bounds...
Transition State Theory
The deviations from the experimental values and the values describes in the Transition State Theory (TST) arises because of the assumptions within the theory itself. First of all, the TST adheres to the Born-Oppenheimer approximation, where the nuclear and electronic motions are decoupled. The Transition State Theory assumes that only the reactants are in constant equilibrium with the transition state structure, and that the energy of the particles follow a Boltzmann distribution. In addition, once the reactants have trajectories with a kinetic energy along the reaction coordinate greater than the activation energy, it will be reactive, and that the products will definitely form, ignoring the possibility that the transition state structure will collapse back to the reactants. However, experimentally, it has been seen in the few scenarios above where the initial momentum (p1=-5.1, p2=-10.1), hence kinetic energy is high enough to result in multiple crossing of the activation energy barrier through multiple forward and backward directions. Theoretically, the theory suggests only a single crossing of the activation energy barrier in the forward direction is possible. Also, note that in the transition state, the motion along the reaction coordinate can be treated classically. [3]
Finally, the theory fails for some reactions at elevated temperatures due to more complex molecule motions or low temperatures due to quantum tunneling, whereby the transition state need not be reached to form products.[4] Yes. Great response. Thank you for including references Mak214 (talk) 10:02, 7 July 2020 (BST)
EXERCISE 2: F - H - H system
PES Inspection
The energetics of both F + H2 and the reverse H + HF were investigated and the findings are summarized in the table below. The method to extract these data are explained further in this section.
| Reaction | Transition State Energy / kJ/mol | Reactants Energy / kJ/mol | Activation Energy / kJ/mol | Type of Reaction |
|---|---|---|---|---|
| F + H2 | -433.980 | -435.100 | +1.120 | Exothermic |
| H + HF | -433.980 | -560.700 | +126.720 | Endothermic |
The reaction between F and H2 is an exothermic reaction owing to the stronger H-F bond relative to the H-H bond. Since enthalpy of reaction is calculated from energy of bond breaking - energy of bond making, the stronger negative value arising from breaking the stronger H-F bond resulted in an exothermic reaction. The stronger H-F bond can be explained due to the larger electronegativity difference between H and F, for which F= 4.0 and H = 2.1. [5] As a result of the electronegativity difference, the F atom pulls electron density closer to itself, resulting in a highly polarized H-F bond, adding on an extra contribution to the bond strength. H-H bond, on the other hand, is a simple covalent bond. Literature value suggests that the bond dissociation energies of H-H and H-F are 432 kJ/mol and 565 kJ/mol respectively, further suggesting that the enthalpy released from breaking H-F bond is much higher than that of H-H bonds. Therefore, the reaction between F and H2 to form HF and H is energetically favorable, with an overall exothermic reaction.
The reverse reaction, H + HF is therefore endothermic, thereby requiring external energy in order to break the H-F bond, whereby the formation of the H-H bond does not compensate for.
The Hammond's postulate states that the transition state of a reaction resembles either the reactants or the products depending on which it is closer in energy. Hence, in an exothermic reaction, the transition state is closer to the reactants in energy. In an endothermic reaction, the transition state is closer to the products in energy.[6]
Referring to the table above, for the forward reaction between F and H2, since the reactants energy is much closer to the transition state energy as compared to the reactions energy and the transition state energy in H + HF backward reaction, the forward reaction is the exothermic reaction, and the backward reaction is the endothermic reaction. This can also be determined graphically. With reference to the PES diagram and Energy vs Time plot below for the reaction between F and H2, it shows that the transition state has been attained, with no net change in potential energy. Furthermore, the PES suggests that the reactants are higher in energy than the products, indicating an exothermic reaction.


Similarly, Figure 29 below shows the transition state from the reverse reaction H + HF. Comparatively, it can be seen that the transition state closely resembles the products, which are now higher in energy than the reactants, thereby deeming it an endothermic reaction.

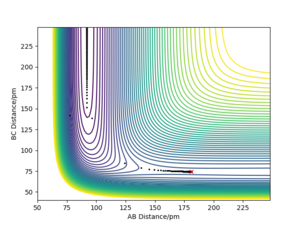
The approximate position of the transition state, is found to be r1 = BC = 181.1 pm and r2 = AB = 74.5 pm .The potential energy at the TS is then found to be -433.980 kJ/mol.
The activation energy of the reaction was found by slightly perturbing it from the TS and finding the energy difference of the products to the transition state energy as shown in the tables and Figures 30-33 below.
| Calculation | Steps | Time/fs | rFH / pm | rHH / pm | pFH/gmol-1pmfs-1 | pHH/gmol-1pmfs-1 |
|---|---|---|---|---|---|---|
| MEP | 2000 | 0.1 | 181.1 | 74.5 | 0 | 0 |

| Calculation | Steps | Time/fs | rFH / pm | rHH / pm | pFH/gmol-1pmfs-1 | pHH/gmol-1pmfs-1 |
|---|---|---|---|---|---|---|
| MEP | 2000 | 0.1 | 182.1 | 74.5 | 0 | 0 |


By finding the trajectory down the MEP with the initial conditions, then inserting the last geometry as the initial condition. After which, replace one of the bond distance of the reactants to an extremely huge number, while keeping the bond distance of the product the same, the potential energy of the reactants and the products can be found. Though, it must be noted that this is just an approximation, as the exact potential energy is when the potential energy curve stabilizes. Ultimately, the potential energy of the reactants are found, can be used to find the activation energies, as summarized in the first table above.
Brilliant. Well documented method with references and figures to show where your arguments can be drawn from. Well done. Mak214 (talk) 10:05, 7 July 2020 (BST)
Reaction Dynamics
The following reaction condition resulted in the reaction from H2 + F -> HF + H
| Calculation | Steps | Time/fs | rFH / pm | rHH / pm | pFH/gmol-1pmfs-1 | pHH/gmol-1pmfs-1 |
|---|---|---|---|---|---|---|
| Dynamics | 1400 | 0.5 | 220 | 71 | -1.5 | -0.3 |
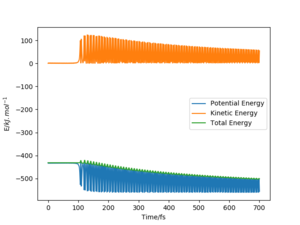
The conservation of energy suggests that total energy is constant through the course of reaction. Hence, in the exothermic reaction between H2 and F to form HF + H, the loss in potential energy from the breaking of bonds is replaced by the increase in kinetic energy as seen in the Energy Vs Time graph below. The kinetic energy can be of three forms: translational, rotational or vibrational. Rotational motion is ignored here as according to the animation, it is currently working on a 1D system.
A bomb calorimeter can be used to measure the overall gain in kinetic energy, both translational and kinetic by measuring the transfer of these energy from the products to the walls of the calorimeter in the form of heat. The heat transferred can then be measured in the form of change in temperature with a thermal sensor. [5]
However, in order to differentiate the respective contributions of translational and vibrational energy, further experimental is required. To determine the vibrational energy, IR spectroscopy can be utilized. Before the reactants collide, most of the bonds occupy lowest energy vibrational levels. However, during a collision, higher level vibrational modes are excited as potential energy is convereted into vibrational kinetic energy. In IR spectroscopy, the higher level modes are characterized as overtones signals where energy levels move from initially 0 to 1, to 0 to 2 or 0 to 3, or even higher. These overtones can be detected and seen with higher wavenumbers as compared to the normal 0 to 1 transition. [5] Yes. Good. Mak214 (talk) 10:06, 7 July 2020 (BST)


The Polanyi Rules
The Polanyi rules state that for reactants with a given momentum along the direction of the reaction path, the translational energy, as opposed to the vibrational energy, is preferred in overcoming the early transition state in an exothermic reaction. The opposite will be true for endothermic reactions, where vibrational energy takes priority over translational energy to successfully form stable products.[7]
Reaction trajectories were calculated for the exothermic reaction of F + H2 with 1000 steps, but by varying the momentum of r1, the momentum of H-H bond, with all other conditions kept constant such that only the vibration energy of the H2 is varied. This is to investigate an early TS, since it is exothermic.
However, keeping the same initial positions and everything else constant, except that the momentum pHF is increased to -1.5 while the momentum of pHH is reduced to 0 and is shown in the figure below. It resulted in a reactive trajectory, which suggested that the increase in translational energy of the system has greater effect in allowing the transition state to be overcome to form stable products.

Next, the endothermic reaction of HF + H to F + H2, which is a late TS is investigated. Similarly, everything is kept constant, apart from pHF before keeping it constant and increasing pHH. The bond distance of HF is kept at 92 nm according to literature.
Hence, it has shown that by increasing the vibrational energy of the H-F bond for the endothermic reaction while keep translational energy fixed at a low vaue resulted in the formation of products.
As such, Polanyi's empirical rules have been shown for both exothermic reactions (early TS) and endothermic reactions (late TS). However, it should be noted that such rules might not work for all cases due to imbalance distribution of translational and vibrational energies or errors in calculating energies, be it bond energies or trajectory calculations.
Great report, really thorough and well presented with references throughout. 5/5 Mak214 (talk) 10:07, 7 July 2020 (BST)
References
- ↑ Imperial College London, https://wiki.ch.ic.ac.uk/wiki/index.php?title=CP3MD, (accessed May 2018).
- ↑ C.D., Sherrill, http://vergil.chemistry.gatech.edu/courses/chem6485/pdf/pes-lecture.pdf, (accessed May 2018).
- ↑ R. D. Levine, Molecular Reaction Dynamics, Cambridge University Press, Cambridge, 2005, pp. 202-203.
- ↑ G. D. Billing and K. V. Mikkelsen, Introduction to Molecular Dynamics and Chemical Kinetics, John Wiley & Sons, New York, 1996, p. 31.
- ↑ 5.0 5.1 5.2 P. Atkins and J. de Paula, Atkins' Physical Chemistry, Oxford University Press, Oxford, 10th edn., 2014, pp. 65, 71 and 986.
- ↑ J. Clayden, N. Greeves and S. Warren, Organic Chemistry, Oxford University Press, Oxford, 2nd edn., 2012, pp. 989.
- ↑ C. Daniel et al., J. Phys. Chem., 1993, 97, 12485-12490.


