MRD:yr2comptb1217
Overall - 5/5. An absolutely exemplary report, well done!
EXERCISE 1: H + H2 system
Dynamics from the transition state region
On a potential energy surface diagram, how is the transition state mathematically defined? How can the transition state be identified, and how can it be distinguished from a local minimum of the potential energy surface?
The reaction path is the minimum energy pathway that links the minima between the reactants and products. The transition state is the first order saddle point in the potential energy surface (PES), the maximum on the minimum energy path that links the reactants and products. At this point, there is a maximum potential, and the potential for the coordinate orthogonal to the reaction has a minimum. Mathematically, the transition state can be found at the point where the gradient of the potential is equal to zero; ∂V(ri)/∂ri=0. From this point, the energy goes down most steeply along the minimum energy path that links the reactants and products.
To identify the transition state, begin trajectories near to the point, with no initial momentum, and observe whether the trajectory follows towards the reactants or products. If the trajectory is started at the transition state exactly without any momentum it will remain there forever as the gradient of the potential is zero and the trajectory cannot 'roll' towards anywhere unless there is a change in structure.
For a saddle point, the function at the point must also obey the following rule; ∂V2(ri)/∂ri2> 0 for all coordinates bar the reaction coordinate. Along the reaction coordinate, ∂V2(ri)/∂ri2< 0. This is because the transition state point is a maximum along only one direction, along the reaction coordinate, and is a minimum along all other coordinates. For a local minima; ∂V2(ri)/∂ri2> 0 for all coordinates, including that of the reaction coordinate.
Good description of the PES!
Trajectories from r1 = r2: locating the transition state
Report your best estimate of the transition state position (rts) and explain your reasoning illustrating it with a “Internuclear Distances vs Time” plot for a relevant trajectory.
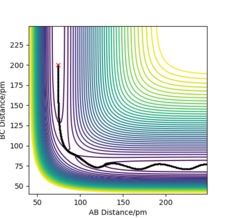
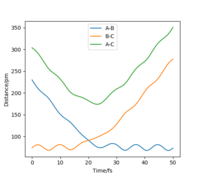
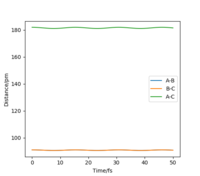
The position of the transition state, rts,is found to be when r1=r2 as the potential energy surface is symmetric. Similarly, it is found that the reaction is concerted, so the value of rts will be greater than the bond distance of 74pm. Looking at the plot of Internuclear Distances vs Time using the initial conditions from before, Figure 1, the transition state can be seen to occur when the r1 and r2 < 100pm. The best estimate for rts was found to be at 91pm. As seen in the contour plot below, Figure 2, the trajectory follows neither towards the reactants or products, but remains at this potential. This further supports that this is the transition state position. In the plot of Internuclear Distances vs Time, Figure 3, there is also minimal oscillation due to being a transition state and no change in the bond distances.
 |
 |
 |
Your estimate for the PES is correct and well justified, well done.
Trajectories from r1 = rts+δ, r2 = rts
Comment on how the mep and the trajectory you just calculated differ
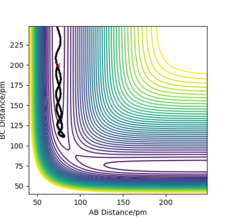
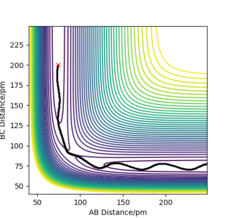
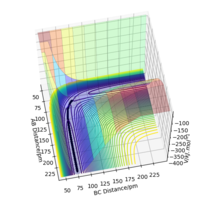
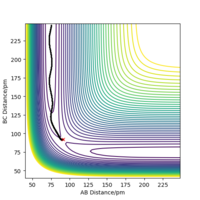
For the mep, Figure 4, the trajectory follows the valley floor to form H1 and H2-H3, whereas using dynamics, Figure 5, the trajectory does not follow the valley floor in a straight line, but follows a wavy line along the valley floor. This is because in the dynamics calculation, the velocity of the species are not reset to zero, hence have kinetic energy and vibrate. The vibrations of the H2-H3 is what is depicted as the wavy line that the trajectory follows in Figure 5. In the mep, the species has no kinetic energy as the velocity is being reset to 0, hence the bond does not vibrate and the trajectory simply follows the valley floor.
Good!
 |
 |
Look at the “Internuclear Distances vs Time” and “Momenta vs Time”. What would change if we used the initial conditions r1 = rts and r2 = rts+1 pm instead?
Take note of the final values of the positions r1(t) r2(t) and p1(t) p2(t) for your trajectory for large enough t.
- Setup a calculation where the initial positions correspond to the final positions of the trajectory you calculated above, the same final momenta values but with their signs reversed.
What do you observe?
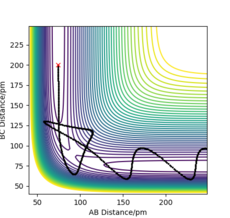
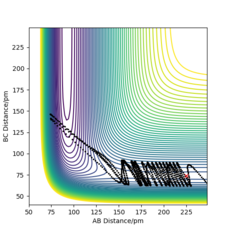
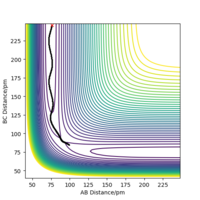
When using the final positions, 74pm and 240pm, and final momenta values reversed, -3.2 gmol-1pmfs-1 and -5 gmol-1pmfs-1, the trajectory began at the reactants phase, and then followed the reverse trajectory from before, Figure 6 and Figure 7. When the conditions are set to r1 = rts and r2 = rts+1 pm, the trajectory followed to form the reactants, this is because when the structure is changed even slightly from the transition state structure, the trajectory follows the minima path towards either the reactants or products, depending on which is closer in energy to. The initial conditions set with r1 = rts and r2 = rts+1 pm cause the trajectory to follow a path towards the reactants as the conditions are set near to the transition state and are closer to the reactant's structure than the product's. When using the final positions and reverse of the final momenta, the trajectory begins where the previous trajectory ended and is only able to nearly reach the transition state, but not overcome it to form the products, hence falls back to form the reactants.
Good!
 |
 |
Reactive and unreactive trajectories
For the initial positions r1 = 74 pm and r2 = 200 pm, run trajectories with the following momenta combination and complete the table
What can you conclude from the table?
Some of the above trajectories have a greater energy than a successful trajectory, but the reaction still does not occur. This is because the total energy of the system cannot always determine whether the reaction occurs or not. The trajectory that the reaction follows needs to be determined and calculated in order to determine whether a reaction occurs or not.
Transition State Theory
Given the results you have obtained, how will Transition State Theory (TST) predictions for reaction rate values compare with experimental values?

In TST, it is assumed that there is an equilibrium between the activated complex and the reactants. TST also assumes that once the energy barrier has been crossed, the reaction will be successful; once the transition state region, and activation energy, is passed- the trajectory will follow to the products and cannot go back to the reactants [1]. However, as shown in the table above, this is not always the case.
For example, in Figure 8, barrier recrossing is observed. These barrier recrossings are not observed by TST due to the above assumption, and leads to the reaction rate constant being overestimated. This is because, in TST, these reactions would have been classified as reaching completion, but due to barrier recrossing, they do not. This leads to an overestimation in the reaction rate constant.
TST is based on the assumption that atomic nuclei behave according to classical mechanics and also ignores phenoma such as quantum tunnelling through the energetic barrier[2]. In quantum tunnelling, particles are able to pass through barriers even when their energy is less than the energy needed to go over the barrier. This leads to an underestimation of the reaction rate constant. However, the effect from ignoring quantum tunnelling is much smaller than the effect from ignoring barrier recrossing. The rate of quantum tunnelling also decreases as the size of the species increases, so as the atom size gets larger; the effect of quantum tunnelling diminishes.
Overall, TST leads to an overestimation in the reaction rate constant compared with experimental values.
An exemplary answer-- absolutely correct, well done!
EXERCISE 2: F - H - H system
PES inspection
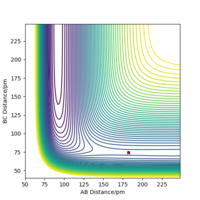
By inspecting the potential energy surfaces, classify the F + H2 and H + HF reactions according to their energetics (endothermic or exothermic). How does this relate to the bond strength of the chemical species involved? Locate the approximate position of the transition state. Report the activation energy for both reactions.
| A | B | C |
|---|---|---|
| F | H | H |
Reaction 1: F + H2
The rts was found to be at r1= 182pm and r2= 74pm. The transition state is early and close to the reactants, and according to Hammond's postulate, this indicates that the reaction is exothermic. This is because the bond strength of the bonds made, H-F, is greater than the bond strength of the bonds broken, H-H. The activation energy is 1.5 kjmol-1.
Reaction 2: H + HF
The rts was found to be the same, at r1= 182pm and r2= 74pm. The transition state for this reaction is late, indicating the reaction is endothermic. This is because the energy needed to break the bond, H-F, is greater than the energy released from the bond made, H-H. The activation energy is 126.5 kjmol-1.
Sensible estimates for Ea in both directions. Well done.
Reaction dynamics
- In light of the fact that energy is conserved, discuss the mechanism of release of the reaction energy. Explain how this could be confirmed experimentally.
In the reaction, total energy must be conserved. This reaction is exothermic, as the bond energy of the bond made is greater than the bond energy of the bond broken. This means there is a release of energy. In this reaction, this energy is released as both translational and vibrational energy, and this release of energy can be measured experimentally in two ways. The first method is using calorimetry. This method will record the temperature changes caused due to the release of translational and vibrational energy combined.
The energy released that is deposited into the vibrational energy of the new bond formed can also be observed individually. This can be observed using Infrared Chemiluminescence (IRCL) [3]. This methods allows us to record the release of vibrational energy separately from the release of translational energy. Once vibrationally excited products form, they emit infrared photons due to the vibrational relaxation that occurs. This method records intensities of the infrared emission lines from the vibrationally excited molecules and measure the populations of the vibrational states in the product, confirming that reaction energy is released into vibrational energy of the bond [4].
Excellent answer, well done!
- Setup a calculation starting on the side of the reactants of F + H2, at the bottom of the well rHH = 74 pm, with a momentum pFH = -1.0 g.mol-1.pm.fs-1, and explore several values of pHH in the range -6.1 to 6.1 g.mol-1.pm.fs-1 (explore values also close to these limits). What do you observe? Note that we are putting a significant amount of energy (much more than the activation energy) into the system on the H - H vibration.
The reaction varies between proceeding and not proceeding towards the products when the values are changed for pHH in the range -6.1 to 6.1 g.mol-1.pm.fs-1. The varying results have been displayed below, with descriptions as to what is happening in each trajectory. This data and trajectories show how the exothermic reaction varies with a range of vibrational energy inputs.
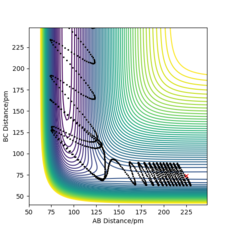
From the above data, the same concept applies where the total energy does not determine whether or not a trajectory is reactive. Overall, the reaction would have been seen to proceed according to Transition State Theory as an energy greater than the activation energy was put in, however due to barrier recrossing and inefficient energy input (vibrational), not all of the reactions did proceed to form products. The reactions were also observed to not proceed at first, but for some trajectories, once the time the reaction was observed for was increased; the reaction does proceed. This is because lots of barrier recrossing occurs where the species change between products, reactants and the transition state positions when given lots of vibrational energy.
- For the same initial position, increase slightly the momentum pFH = -1.6 g.mol-1.pm.fs-1, and considerably reduce the overall energy of the system by reducing the momentum pHH = 0.2 g.mol-1.pm.fs-1. What do you observe now?
This is a reactive trajectory, following through from the entry channel with the reactants towards the exit channel and forming the products, Figure 10. The trajectory is smooth unlike the ones from above and there is no recrossing of the transition state barrier or reforming of the reactants. In this trajectory, there is overall less energy in the system yet the reaction proceeds as there is greater translational energy than before. This is an effect supported by Polanyi's Empirical rules for early barrier, exothermic reactions.

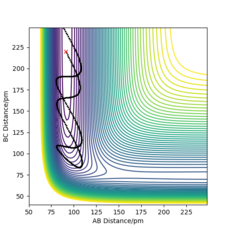
- Setup initial conditions starting at the bottom of the entry channel, with very low vibrational motion on on the H - F bond, and an arbitrarily high value of pHH above the activation energy (an H atom colliding with a high kinetic energy).
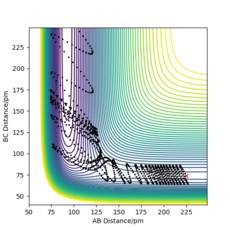
The initial conditions were set as below to give a contour plot shown in Figure 11. This reaction trajectory is not reactive as there is lots of translational energy but low vibrational energy. This is also an observation from Polanyi's Empirical rules, as this is a late barrier, endothermic reaction, it is not efficient to input translational energy, and are more likely to obtain a successful trajectory by inputting more vibrational energy.
| Distance (pm) | Momentum(g.mol-1.pm.fs-1) |
|---|---|
| 91 | -0.2 |
| 220 | -10 |
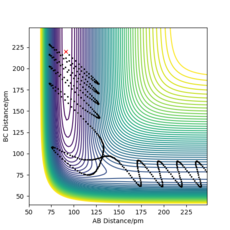
- Try to obtain a reactive trajectory by decreasing the momentum of the incoming H atom and increasing the energy of the H - F vibration.
A reactive trajectory was found using the conditions below.
| Distance (pm) | Momentum (g.mol-1.pm.fs-1) |
|---|---|
| 91 | 17 |
| 220 | -1 |
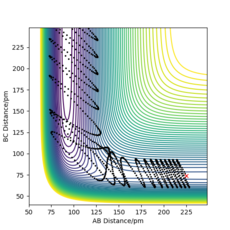
This produced the following contour plot, Figure 13. In this trajectory, there is greater vibrational energy and hence the reaction is successful, following Polanyi's Empirical rules.
Polanyi's empirical rules and Hammond's Postulate
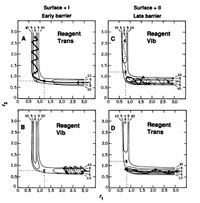
Hammond's Postulate is as follows, the structure of the transition state for an exothermic reaction is reached relatively early in the reaction, and so it resembles the reactants. The transition state structure for an endothermic reaction is reached relatively late and resembles the products more than the reactants[6].
Polanyi's Emperical rules, Figure 13, shows that vibrational energy is more efficient for a late barrier reaction to proceed than translational energy, and translational energy is more efficient for a early barrier reaction to proceed successfully.
Exothermic and early barrier reaction: H2 + F
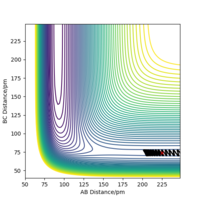
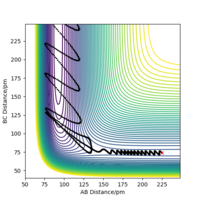
Following Polanyi's Emperical rules, this reaction is more likely to proceed with translational energy than vibrational energy as it is exothermic, hence translational energy is more efficient[7]. This is further supported by the trajectories of the reactions above. Even when a range of large vibrational energies were put into the reaction, the reaction still did not always proceed and resulted in barrier recrossing. Even if the reaction did proceed, the trajectory was not smooth, and the structure would convert between products, reactants, and the transition state. However, when the energy was put in as translational energy, even a small increase led to a successful trajectory; with little vibrational energy and reduced energy in the system overall compared to the range tested as seen in the table. This supports Polanyi's Empirical rules that for exothermic reactions, translational energy is an efficient energy input for a successful reaction to occur.
To further support this, the following initial conditions were set, reactions with around the same total energy but one with more vibrational energy input than translational energy, and another with more translational energy input than vibrational energy, Figure 14 and Figure 15. The reaction is successful and follows a smooth trajectory to form the products for the reaction with a greater translational energy input, supporting Polanyi's Empirical rules.
| Distance(pm) | Momentum(g.mol-1.pm.fs-1) | Distance(pm) | Momentum(g.mol-1.pm.fs-1) | |
|---|---|---|---|---|
| 225 | -1.0 | 225 | -1.6 | |
| 74 | -1.2 | 74 | 0.2 |
 |
 |
Endothermic and late barrier reaction: HF + H
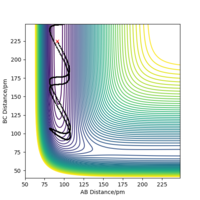
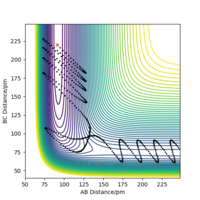
For an endothermic reaction, Polanyi's Empirical rules state that inputting vibrational energy is more efficient in getting a successful reaction than translational energy. This rule is supported by the trajectories carried out below. When more energy is input as translational energy than vibrational energy, the reaction does not proceed, Figure 16. The successful trajectory has a large amount of vibrational energy as pHF is large, and little translational energy, Figure 17.
| Distance(pm) | Momentum(g.mol-1.pm.fs-1) | Distance(pm) | Momentum(g.mol-1.pm.fs-1) | |
|---|---|---|---|---|
| 91 | 0.5 | 91 | 17 | |
| 225 | -9 | 225 | -1 |
 |
 |
Overall, the data and trajectories recorded support Polanyi's Empirical rules and Hammond's Postulate.
Absolutely correct. Excellent and detailed explanation of Polanyi's rules
References
- ↑ K.J. Laidler, Chemical Kinetics, 1987, 88-98
- ↑ D. Sholl and J. A. Steckel, Density Functional Theory: A Practical Introduction, Wiley, 2011.
- ↑ J. R. Ferraro and L. J. Basile, Fourier Transform Infrared Spectra: Applications to Chemical Systems, Elsevier Science, 2012.
- ↑ J. L. Schreiber and J. . Polanyi, Faraday Discuss. Chem. Soc, 1977, 62, 267–290
- ↑ J. C. POLANYI, Science (80-. )., 1987, 236, 680–690.
- ↑ W. Brown, C. Foote, B. Iverson and E. Anslyn, Organic Chemistry, Cengage Learning, 2008.
- ↑ J. C. Polanyi, Angew. Chemie Int. Ed. English, 1987, 26, 952–971

