MRD:yr2 01494555
Introduction
Great job on this report. Your answers were well thought out and explained fully. It is great to see a comprehensive list of references. If i must give some advice, it would be to give your work a once over to filter out any typo's. Mys18 (talk) 23:40, 22 May 2020 (BST)
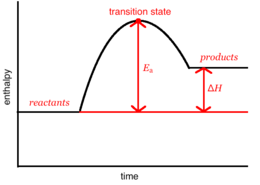
Chemical reaction can be simulated by looking at the motion of the atoms during the course of the reaction. This motion can be described using classical mechanics, even though this approximation ignores quantisation of molecular vibrations present in quantum mechanical model. How atoms interact with each other defines the movement of the atoms relative to each other. Interactions between atoms can be expressed as potential energy surface that describes the potential energy of the system as a function of the relative positions of the atoms. The 3D surface plot can be understand better by looking at the energy profiles - (one dimensional surface energy plots). On of them is presented in figure 1. On fig. 1 transition state is indicated as the max point of the graph (it would be a saddle point on the 3D surface plot). Transition state is mathematically defined as a point on the potential energy surface that has a gradient of a potential equal to zero (). By studying the plots we can characterize transition states as early or late by referring to the Hammond's postulate.
Apart from describing transition state of the reaction we can investigate whether reaction will occur when various parameters are set. The system has to not only have enough energy to overcome the activation energy barrier (Activation energy) but also make sure the reactants have the right type of energy (vibrational or translational) for a successful reaction to occur. The better understanding of this concept can be gained by looking at Polanyi's rules.
Studying H + H2 = H2 + H system

When the program is ran and the parameters of the system are such that reaction is possible, the reaction proceeds as follows: H + H2 = H2 + H
This reaction, like any other, will go through a transition state (if meets the required conditions). Transition state is mathematically defined as a point on the potential energy surface that has a gradient of a potential equal to zero (). It is a saddle point -maximum point on the minimum energy path. The potential energy surface also contains points of minima which also meet the condition a zero gradient. To distinguish between the two, a second derivative mast be taken. If the second derivative is less than zero than it belongs to the saddle point and, hence, to the transition state.
Good. What do you think a gradient of zero tells us? Transition state is at a maximum/minimum/ * neither *? Complete the comparison, second derivative >0 tells us it is a local minimum. Mys18 (talk) 23:29, 22 May 2020 (BST)

Locating the transition state
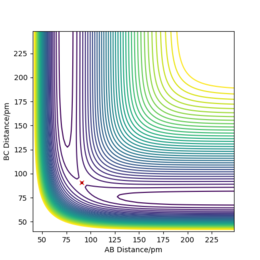
We can set the parameters of the reaction such that the system is put into transition state. The H + H2 surface is symmetric and therefore the central hydrogen atom is not biased to either of the two atoms and is positioned at an equal distance between the two atoms in the transition state. There should be no forces acting on the system and it has to remain stationary (both momentum ares et to zero). These conditions are met when the transition state position (rts) equals to 90.777 pm. Figure 3 shows that the distances between the atoms remain unchanged over time and thus the rts has been found correctly to 3 d.p. Figure 4 also shows where the transition state is located on the contour plot and confirms that the system is stationary - no trajectory is observed.
How does Hammond's postulate demonstrate this?Mys18 (talk) 23:31, 22 May 2020 (BST)
Estimating the reaction path
The trajectory of the reaction path can be calculated either using MEP(minimum energy path) or Dynamics type. This is done by moving the system slightly away from transition state (elongating one of the distances between two hydrogen atoms) The conditions are such that both momenta are zero AB=r1=rts+1 and BC=r2=rts. MEP uses an infinitely small motion tp plot the trajectory and it does not represent a realistic motion of atoms during the reaction. Dynamics, on the other hand, appreciates that atoms have masses and theirs inertial motion. It includes the vibration of atoms in its calculations. Therefore, the trajectory obtained from Dynamics type (fig 5) produce a more curvy trajectory compared to MEP (fig 6). Both curves move towards Hatom 1 + Hatom 2-Hatom 3, moving away from TS.

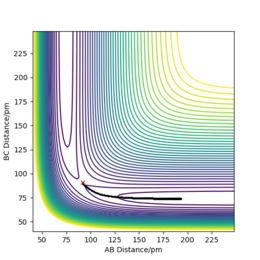
If we set r2=rts+1 and r1=rts, the trajectory will move towards Hatom 1-Hatom 2 + Hatom 3 (along BC), moving away from TS. At t=50 fs, AB=r1=74.9406 pm and p1=3.21169 g.mol-1.pm.fs-1.; BC= r2=353.263 pm and p2=5.07558 g.mol-1.pm.fs-1. If we run a simulation using this data but reverse the signs of momenta values, the system is in the state of Hatom 1-Hatom 2 + Hatom 3 and starts to move towards the TS.
Double check your figure captions (Fig.5). Otherwise good.Mys18 (talk) 23:32, 22 May 2020 (BST)
Reactive and unreactive trajectories
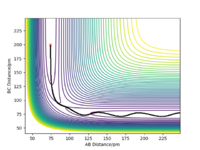
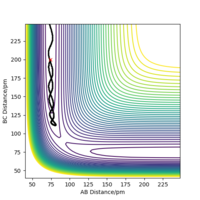
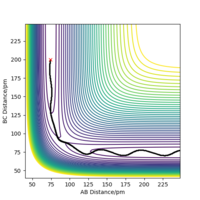
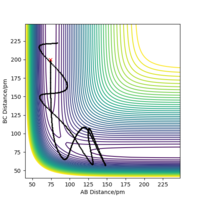
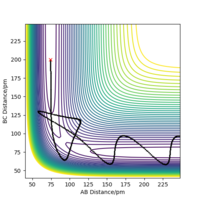
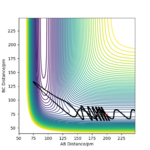
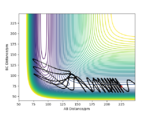
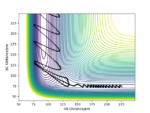
Consider the system with various kinetic energy ( various momenta). The hypothesis is that if there is enough kinetic energy to overcome the activation barrier the molecules should react. The table below shows the data collected from varying the momenta of both H2 molecule and single hydrogen atom. From the collected data we can see that this statement is invalid and there is no relationship seen between the trajectory of reaction path and the momenta (kinetic energy). We can see that in case 2 system Etot is greater than in the first case, however the trajectory of the reaction clearly shows that the products are not formed and the system returns back to products. In fact, the 5th reaction, that has lowest Etot is included into the three out of five reactions that occur.
The results presented in the table can be compared to Transition state theory. Transition state theory is used to describe how the chemical reaction occurs and is based includes the following assumptions:
1. Reactants can go through transition state and form products, however products cannot go back to transition state and reform reactants.
2. The energies of the reactant molecules are distributed in agreement with Max-Boltzman distribution.
3. Reaction is treated using classical mechanics, any quantum behavior is ignored (i.e tunneling) and there is an equilibrium between reactants and activated complexes- quasiequilibrium[1]
Assumption three of TST allows to ignore quantum tunneling that could happen and would potentially increase the rate of reaction and one can say that TST underestimates the rates of the reactions. However, tunneling has much less contribution to the rate of the reaction when compared with the energy barrier that needs to be overcome and therefore would not contribute much.
If we look at the trajectory four and five we can see that after the system has reached the transition state it moved back to forming starting material. This violates assumption number 1 of the Transition state theory and therefore the theory cannot be used to explain this dynamic behavior of the system. Because TST does not allow products going back to reactants, but both 4 and 5 show the opposite, TS overestimate the rate of reaction for these to cases. Well done on this section!Mys18 (talk) 23:34, 22 May 2020 (BST)
Studying F-H-H system
Two different reactions were set up:
| r1/ pm (AB) | r2/ pm (BC) | Momentum p1 / g mol-1 pm fs-1 | Momentum p2 / g mol-1 pm fs-1 | Atom 1 (A) | Atom 2 (B) | Atom 3 (C) |
|---|---|---|---|---|---|---|
| 230 | 74 | 0 | 0 | F | H | H |
| r1/ pm (AB) | r2/ pm (BC) | Momentum p1 / g mol-1 pm fs-1 | Momentum p2 / g mol-1 pm fs-1 | Atom 1 (A) | Atom 2 (B) | Atom 3 (C) |
|---|---|---|---|---|---|---|
| 74 | 230 | 0 | 0 | H | H | F |
Potential energy surface inspection

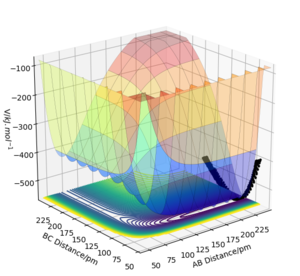
From figure 7 we can see that the channel H-H + F ( along BC axis) is higher in energy than the channel H-F + H (along AB axis). The plot, thus, suggests that the reactants are higher in energy than the products and therefore the reaction is exothermic. It can be concluded, that H-F bond is stronger than H-H bond since more energy is released when making a H-F bond than taken in to break H-H bond. This also agrees with experimental bond values - 0.741 Å[2] and 0.917 Å[3] for H-H and H-F bond respectively. Figure 8 shows the surface plot of the second system. In this case, the channel H + H-F (along BC axis) lies below the H-H + F channel (along AB axis. This suggests that the reactants are lower in energy than the product formed during the reaction. and the reaction can be classified as endothermic. As has been described above, H-F bond is stronger than H-H bond and therefore more energy has been put into breaking the bonds than has been released at the end of the reaction.
Nice work on the continued inclusive units and references.Mys18 (talk) 23:34, 22 May 2020 (BST)
Locating the approximate position of transition state
Unlike in a hydrogen system, that was completely symmetric, in a transition state the central atom will be biased to either F atom or H atom. TS can be found by referring to Hammond postulate. Hammond's postulate states the following:
If two states, as, for example, a transition state and an unstable intermediate, occur consecutively during a reaction process and have nearly the same energy content, their interconversion will involve only a small reorganization of the molecular structures.[4]

In simpler words, the transition state will resemble either products or reactants, whichever it is closer in energy to. So, for exothermic reaction, since reactants are higher in energy than products, the reaction will have an early transition state that resembles the reactants. A late transition state - where transition state resembles products - is characteristic of endothermic reaction. The reaction described in set up one is exothermic and therefore the TS should resemble the reactants. If we keep r2=74.5 pm assuming that the H-H bond has elongated and try to vary r1 from 225 pm to 180 pm, when r1=180 pm, there are no net forces acting on the system. The distances between the atoms do not change over time (fig 8) which confirms that TS has been found. For the F + H2 system the TS lies in the channel of reactants (AB axis), but for the F + H2 system it would be found on the channel of products (BC axis). The second reaction is the reverse of the first, therefore they have the same transition state.
Determination of activation energy
Activation energy is the energy that must be provided to the chemical system with reactants to result into chemical reaction and formation of products. It is the difference between the energy of the TS and the energy of reactants. For the first exothermic reaction Ea should be less than for the second endothermic reaction. The potential energy of the transition state for both systems is ETS -433.981 kJmol-1. To find the energy of the reactants for the first reaction, r1 (AB) is set to be more than 180 pm and BC is remained constant (74.5 pm). The distance should be increased until the total energy of the systems stops changing. This energy would equal to the energy of the products. Starting at 280 pm and increasing the distance by 10 pm each time, the total energy of the system stops changing when r1(AB)=480 pm. At this distance the energy is found to be -435.055 kJmol-1. For the second reaction, r1(AB)=180 pm and r2(BC) is set to 92 pm (H-F bond length) until there is no further change in energy. The change in energy stops at 420 pm and Eproducts=-560.690 kJmol-1
For exothermic reaction F + H2:
Ea=ETS-Eproducts=-433.981-(-435.055)=1.074 kJmol-1
For endothermic reaction HF + H:
Ea=ETS-Eproducts=-433.981-(-560.690)= 126.709 kJmol-1
These are good estimates! Mys18 (talk) 23:35, 22 May 2020 (BST)
Reaction Dynamics
| r1/ pm (AB) | r2/ pm (BC) | Momentum p1 / g mol-1 pm fs-1 | Momentum p2 / g mol-1 pm fs-1 | Atom 1 (A) | Atom 2 (B) | Atom 3 (C) |
|---|---|---|---|---|---|---|
| 175 | 74 | -1.6 | 0.2 | F | H | H |

For an exothermic reaction, there is a release of energy observed. The energy of the system should be conserved thus the potential energy of the system is converted into kinetic energy. This energy can be released either in the form of vibrational or translational energy. Translational l energy is released in the form of heat, however vibrational energy is released as photons. On the surface plot, if vibrational energy is released a high amplitude of oscillation will be observed; low amplitudes of oscillations or no amplitude at all correspond to the release of translational energy. Figure 9 shows That the studied exothermic reaction has released energy in the form of vibrational energy. Since H-F has a permanent dipole and H-H, does not, the system can be studied using IR-spectroscopy. When the H-F bond is formed, the molecule is observed in excited state. Most of the molecules will be found in the first excited state, however, due to Boltzmann-Distribution of energy, there is a possibility of some molecules being at the 2nd excited state (1->2 transition). Thus, IR-spectroscopy will show a high intensity signal at a fundamental frequency (0->1 fundamental transition) and low intensity signal (1->2 hot band). Since the system behaves as anharmonic oscillator, the energy gaps between the states of the system decreases as you move up from ground state to other excited states. The gap between ground state and the first excited state is larger than the gap between the first and the second excited states. Therefore, the hot band will appear at lower frequency than that of fundamental frequency.
When the system starts to relax, the molecules move undergo the following transitions: 1->0 and 2->1 transitions. There will be more of the 1->0 transitions and the hot band will decrease in intensity over time and only fundamental transition will be observed (peak should be of a higher intensity than before relaxation). If the mechanism of the energy release is via vibrational relaxation a large change of the signal of 1->2 transition over time would be observed.
According to Polanyi's rules state that the energy requirement for a successful reaction depend on the barrier location (transition state location). Early TS is a characteristic of the exothermic reaction. The products of exoothermic reactions however, will have more vibrational energy than translational energy. The products should have more translational energy as it is more effective than having a lot of vibrational energy to overcome the energy barrier. The converse is true for endothermic reactions with early transition state[5]. The data presented in the table below agrees with the Polanyi's rules. The two exothermic examples (1.1 and 1.2) have a high vibrational energy of the reactants and therefore trajectory appears to be unreactive. Trajectory 1.3 is reactive with high translational energy of the reactants and high vibrational energy for products. The same agreement can be observed and for the second system. For system 2.2 the vibrational energy is high at the reactant channel. Once it enters the product channel, vibrational energy decreases.
Great understanding of Polyani's rules. I like the table included with the added descriptions to help support your answer. Mys18 (talk) 23:39, 22 May 2020 (BST)
References
- ↑ N. E. Henriksen and F. Y. Hansen Theories of Molecular Reaction Dynamics 2nd ed., OUP, 2019
- ↑ Experimental data for Hydrogen diatomic, https://cccbdb.nist.gov/exp2x.asp?casno=1333740&charge=0, (accessed May 2020).
- ↑ Experimental data for Hydrogen fluoride,https://cccbdb.nist.gov/exp2x.asp?casno=7664393&charge=0, (accessed May 2020
- ↑ G. S. Hammond, J. Am. Chem. Soc., 1955 77(2), 334.
- ↑ 1.S. Yan, Y. Wu and K. Liu, Proceedings of the National Academy of Sciences, 2008, 105, 12667-12672.

