MRD:yingtingjiaYJ6018
Transition State
Define transition state in potential energy surface
Transition state is defined as the first order saddle point in the potential energy surface diagram where the curvature is zero. Also, it should be a maximum in energy in one direction (nuclear configuration) and minimum in its orthogonal directions. It is located in the minimum energy path linking the two minimum which are the reactants and products. If the curvature of the PES is zero at the transition state, how can it be a saddle point? The fact that the second derivatives below are >0 an< <0 indicate that the curvature is not zero. The use of "nuclear configuration" expression for a direction is also not correct, you probably mean "reaction coordinate"? João (talk) 12:14, 29 May 2020 (BST)
Conditions transition state should satisfy
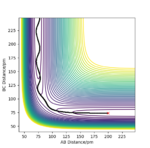
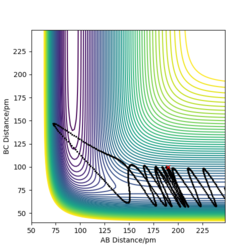
∂E/∂(rab-rbc)=0 and ∂E2/∂2(rab-rbc)<0 ( trajectory of figure 1)
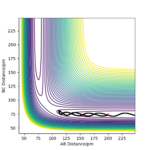
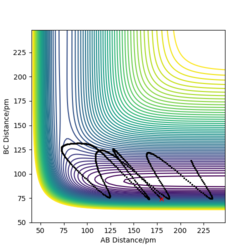
∂E/∂(rab+rbc)=0 and ∂E2/∂2(rab+rbc)>0 (trajectory of figure 2)
Defining the directions rab-rbc and rab+rbc is appropriate here, but only because it is a symmetric reaction/PES. João (talk) 12:14, 29 May 2020 (BST)
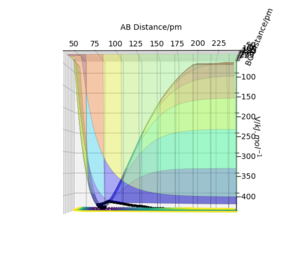
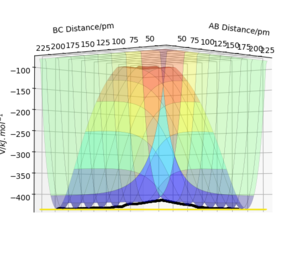
Distinguish transition state from local minimum
Local minimum on the lowest energy surface can be defined as:
∂E/∂(rab-rbc)=0 and ∂E2/∂2(rab-rbc)>0 (trajectory of figure 1)
∂E/∂(rab+rbc)=0 and ∂E2/∂2(rab+rbc)>0 (trajectory of figure 2)
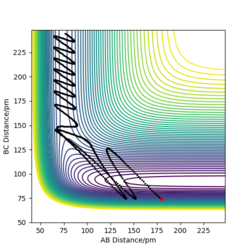
In this symmetric reaction, the transition state occurs when rab=rbc, which can be used to distinguish transition point from other turning points in trajectory shown in figure 2 as points that do not satisfy this condition are local minimum. Good. Pu12 (talk) 18:56, 21 May 2020 (BST)
Locating transition state position
The transition state in this case is at the point where rab=rbc, from which its coordinate can be located using the intercept of line rab and rbc in Intermolecular distance vs Time plot.(figure 3)
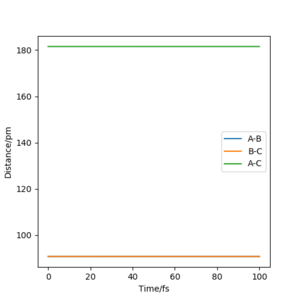
rts=90.775 pm
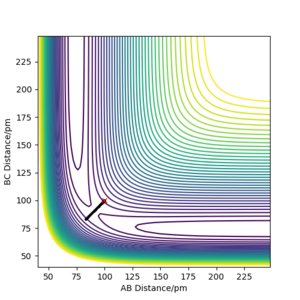
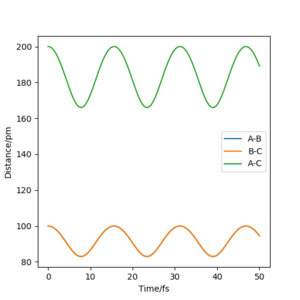
To prove this result, contour graph and Intermolecular distance vs Time graph was plotted using the following conditions:
| rab=100pm | pab=0 g.mol-1.pm.fs-1. |
| rbc=100pm | pbc=0 g.mol-1.pm.fs-1. |
The contour graph (figure 5)shows that the atoms oscillate back and forwards there is a straight black line. Also, the Internuclear distance vs Time (figure 6)graphs shows two oscillating waves. At transition state, the gradient of potential energy surface is zero, which means that the there is no force acting on the atoms and the atoms should not be oscillating. This suggests that the real rts should be much smaller than the distance used for testing and the Internuclear distance vs Time should show horizontal lines. Through reducing the length of AB and BC, the force acting on AB and BC reduces, the estimation of rts is then determined to be 90.775 pm at the point where force acting on AB and BC is zero.
Calculation of reaction path
Calculation of reaction path using MEP
| Distance and momentum of reaction | |
|---|---|
| rab=rts=90.775 pm | pab=0 g.mol-1.pm.fs-1 |
| rbc=rts+1=91.775 pm | pbc=0 g.mol-1.pm.fs-1 |
Calculation of reaction path using Dynamics
| Distance and momentum of reaction | |
|---|---|
| rab=rts=90.775 pm | pab=0 g.mol-1.pm.fs-1 |
| rbc=rts+1=91.775 pm | pbc=0 g.mol-1.pm.fs-1 |
Comparison of MEP and Dynamics
Trajectory in contour plot
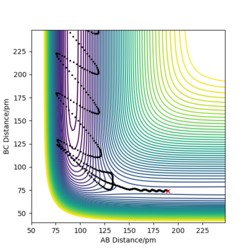
The trajectory shown by the Dynamics calculation(figure7) shows a fluctuating upward curve towards the right from the transition state whereas that in MEP(figure8) has the same trend but is smooth, so both of them are moving downhill along the reaction. The trajectory calculated by dynamics illustrates that the new H2 molecule formed by HA and HB is stretching and contracting as they move away from HC, this oscillation leads to the fluctuation in the potential energy surface. MEP does not include this feature, as it does not allow the kinetic energy to be built up from the previous time step, it just allows the atoms to move along the direction which is obtained from the acceleration generated by force calculated.


Internuclear distance vs Time plot
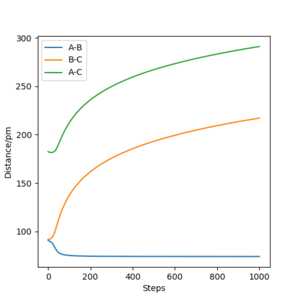
MEP(figure 9) shows a graph with line BC and AC have positive gradient overall and their gradient decreases gradually towards zero as the reaction progresses. In contrast, line BC and AC generated by Dynamics(figure 10) are flat initially, their gradient starts to increase at around 12 fs and remains constant for the rest of the time. In addition, line AB in Dynamic graph fluctuates after 20 fs whereas that in MEP is flat. The differences are mainly due to the fact that MEP does not account for the realistic motion of atoms during reaction whereas the motion of atoms are included in the Dynamics. The vibration of new H2 molecule formed by HA and HB is shown clearly by Dynamic form the continuous fluctuation of line AB which is ignored by MEP.

Momenta vs Time
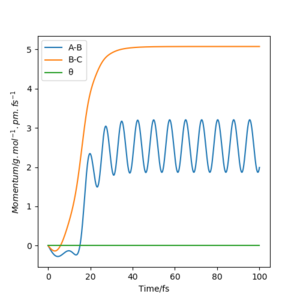
In Dynamics (figure.11), the momentum of BC increases as HB and HC move away from each other while that of AB increases after a drop at around 12fs. At around 20fs, AB starts to fluctuate which is because of the oscillation of new H2 molecule formed by HA and HB. However, in the MEP (figure.12), the momenta is just zero. This also proves that MEP does not take the motion of atoms into account. MEP has infinite friction, which prevents the subsequent kinetic energy being built up overtime.

Energy vs Time
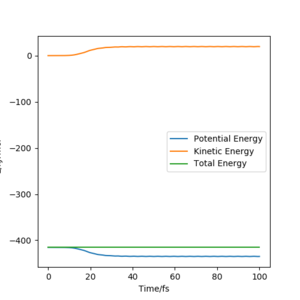
The kinetic energy shown in the MEP (figure.13) keeps at zero, so the total energy in this plot (figure7) is equal to the potential energy. However, the Dynamics plot(figure.14) shows that the kinetic energy increases which is due to the gain of the vibrational energy in AB. The total energy in this plot is constant and is slightly higher than that shown in MEP plot. This indicates that the Dynamics calculates the trajectory base on the conservation of energy, whereas MEP only considers the minimum energy pathway, it includes dispersive force, which transfers the kinetic energy into other forms of energy to overcome friction.

Good. Pu12 (talk) 18:56, 21 May 2020 (BST)
Reactive and unreactive trajectories
| pab/
g.mol-1.pm.fs-1 |
pbc/
g.mol-1.pm.fs-1 |
Etot | Reactive? | Description of the dynamics | illustration of the trajectory |
|---|---|---|---|---|---|
| -5.1 | -2.56 | -414.280 | Yes | HA approaches H2 molecule and interact with it, new HAB molecule formed, HAB molecule vibrates and both HAB and HC move away from each other | the trajectory shows a curve starting from the initial AB and BC distance and reach the transition state where rab=rbc, after that, it starts to fluctuate where the new HAB molecule is formed. |
| -4.1 | -3.1 | -420.077 | No | HA approaches H2 molecule, but bounce off and move away from it While vibrating. Pu12 (talk) 18:56, 21 May 2020 (BST) | the trajectory shows that rab decreases by moving towards the right, but the line then fluctuates backwards before reaching the transition state, indicating that the HA are moving away from vibrating HBC molecule. |
| -5.1 | -3.1 | -413.977 | Yes | HA approaches H2 molecule and interact with it, new HAB molecule formed. HAB and HC moves away from each other | the trajectory shows that the rab decrease and reaches the transition point where rab =rbc, after that, the line fluctuates and rab increases, representing new HAB molecule formed stretches and contracts and moves away from the HC. |
| -10.1 | -5.1 | 357.277 | No | HA approaches H2 molecule and collides HB several times, it then bounce off and moves away from the H2 molecule | the trajectory shows a line that is moving towards the right where rab is getting smaller, after passing the transition state, the lines oscillates significantly for several times indicating HA is colliding with HB. It then fluctuates backwards, showing that HA is moving away from HBC. |
| -10.6 | -5.1 | 349.477 | Yes | HA approaches H2 molecule and collide with HB once, this is followed by HB colliding with HC once. After that, new HAB molecule formed and HC moves away. | The trajectory shows a line approaching she shorter rab with fairly horizontal teen initially. After reaching the transition state, there is a sharp drop in rbc representing that HB collides with HC, the line then fluctuates back to position where rbc is increasing. |
Good, but no conclusion of overall results of table, this would just be a line explaining that some reactants with high energy don't react and recross even though their energy is high. Pu12 (talk) 18:56, 21 May 2020 (BST)
Prediction of rate of reaction using Transition State Theory
Transition state is based on assumptions[1] Your probably just forgot to type one word here, but note that Transition State and Transition State Theory are different things. The former is an atomic configuration where the PES has some special features, the latter is a theory to calculate reaction rates. João (talk)
- energy of atoms in the reactant state obeys Boltzmann distribution, which should be satisfied for the system with enough time to reach thermal equilibrium.
- Once the system reach the transition state with a velocity towards the product side, it will not go back to retain the initial state again.
- quantum tunneling effect is negligible.
- Born-Oppenheimer approximation is obeyed where the nuclear motion is stationary with respect to electronic motion as their mass are massive.
- If there is not an equilibrium between reactants and products, the molecules are still distributed in Boltzmann distribution.
The rate of reaction predicted by the Transition State Theory should be higher than the experimental values. As shown in the trajectory of pab=-10.1 and pbc=-5.1, the atoms have passed through the transition state, but the still recross the transition state and go back to reactant, this phenomenon does not obey the assumption 2 in Transition State Theory. Therefore, fewer molecules in reactant form products in reality than predicted by Transition State Theory. The rate of reaction is overestimated. In order to improve the rate of reaction generated using Transition State Theory, a recrossing probability should be added to the equation so that this factor can be taken into account, leading to better approximation.[2] Good. Pu12 (talk) 18:56, 21 May 2020 (BST)
F-H-H system
F+H2 energetics
reaction chemical equation:
F + H2 = HF + H
Potential Energy Surface
As shown in the surface plot(figure.15), the reactants F and H2 on the left is lower in energy than the products HF and H on the right, therefore, it can be concluded from the graph that this reaction is exothermic.

Bond strength
This reaction involves the breaking of H-H bond and the formation of H-F bond. To determine whether this reaction is exothermic or endothermic, the bond energy[3] of the two is compared. Since H-F is a stronger bond compared to H-H, energy released from forming H-F bond will be greater then energy absorbed to breaking the H-H bond, therefore, the products are lower in energy than reactant, this reaction is exothermic.[4]
| bond energy | |
|---|---|
| H-F | 565 kJmol-1 |
| H-H | 432 kJmol-1 |
HF+H energetics
reaction chemical equation:
H + H-F = H2 + F
Potential Energy Surface
As shown in the surface pot(figure 16), the reactants H and H-F are lower in energy than the products F and H2. This reaction needs to absorb energy to be completed. Therefore, it is endothermic.

Bond Strength
The reaction involves the breaking of H-F bond and formation of H-H bond. Since H-F bond is stonger than H-H bond, more reaction needs to be absorbed to break H-F bond than released from forming H-H bond, this reaction is endothermic.
| bond energy | |
|---|---|
| H-F | 565 kJmol-1 |
| H-H | 432 kJmol-1 |
Transition state
The Hammond Postulate[5] states that the structure of the transition state will resemble the structure of chemical that is closer in energy to it, Therefore, for exothermic reaction, the transition state tends to have similar structure as the reactant whereas for endothermic reaction, the transition state tends to have the structure of the products. When considering the exothermic reaction of F+H2, its transition state will resemble the structure of the reactants which is F and H2. For the endothermic reaction of H+H-F, the transition state has similar structure as the product H2 and F. When estimating the transition state, the initial conditions can be set based on the bond length of H-H[6]. Also, the surface plot can give a rough estimate of the position of transition state, which can be used to estimate the distance between H and F.
| bond length | |
|---|---|
| H-H | 74 pm |
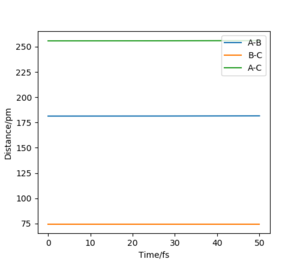
Through adjusting rab and rbc until the Internuclear distance vs Time graph (figure.19&figure.20)shows three horizontal line, the location of transition state can be estimated.
| reactions | transition state | |
|---|---|---|
| F + H2 = HF + H | rab=181.301 Units. Pu12 (talk) 18:56, 21 May 2020 (BST)
rbc=74.482 |
rab=distance between F and HB
rbc=distance between HB and HC |
| H + HF= H2 + F | rab=74.482
rbc=181.301 |
rab=distance between HA and HB
rbc=distance between HB and F |

Activation energy
F + H2 = HF +H
| distance | momentum |
|---|---|
| rab=190 pm | pab=0 |
| rbc=73 pm | pbc=0 |
(A=F,B=H,C=H)
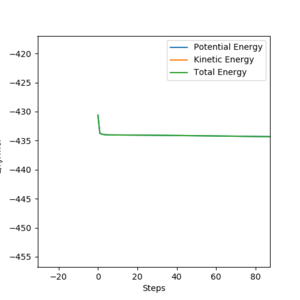
Activation energy is considered as the difference between the energy of the transition state and the starting material. To determine the minimum energy of the reactants, the initial conditions are set such that the path starts from the transition state to the reactants, a graph of Energy vs Time (figure.21) is plotted using MEP, from which the minimum energy of the reactant is determined to be -434.268 kJmol-1 by exporting the data and identify the minimum energy to give a more precise result. Since fluorine is very reactive, so the activation energy is expected to be quite low, it is expected that the reactants is fairly close the transition state. The energy of the transition state is determined from the table in the program to be -433.981 kJmol-1, giving the activation energy of 0.287 kJmol-1.
H + HF = H2 + F
| distance | momentum |
|---|---|
| rab=70 | pab=0 |
| rbc=160 | pbc=0 |
(A=H,B=H,C=F)
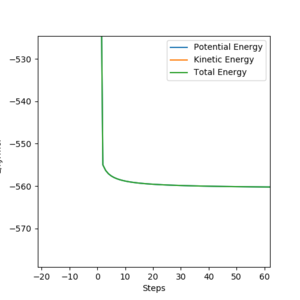
The same method (figure.22) is used for this reaction, the minimum energy of the reactants is found to be 560.677 kJmol-1, the difference between the transition state energy and the reactant energy is calculated to be 126.696 kJmol-1 .
Good. Pu12 (talk) 18:56, 21 May 2020 (BST)
Energy mechanism
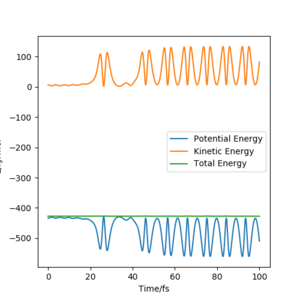
Through monitoring the Energy vs Time plot(figure.17), it is discovered that the kinetic energy shows a pattern which is a reflection of the potential energy pattern when the total energy is conserved. This indicates that as the kinetic energy increases, the potential energy decreases by the same amount. The gain in the kinetic energy is mainly from the heat energy released during the reaction.
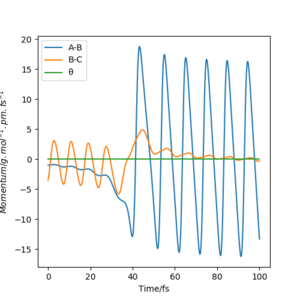
The Momenta vs Time plot(figure.18) shows the energy transfer between translational and vibrational energy. Since momenta correspond to bond stretching displacement, when HBC molecule oscillates, its momentum oscillates as well due to the fluctuation in the bond length. The magnitude of the fluctuation shows a slight decrease as the molecule moves towards F, some of the vibrational energy is converted to translational energy. AB shows a reverse pattern, its momentum increases in magnitude when the distance between HB and F decreases, once new H-F bond is formed, the new molecule oscillates, translational energy is converted to vibrational energy, vibrational energy increases.
The energy released is converted into vibrational and translational energy. Translational energy is proportional to temperature So is vibrational once the released photons interact with the calorimeter. Pu12 (talk) 18:56, 21 May 2020 (BST) , so it can be measured by calorimeter. Translational energy can heat up the calorimeter and the magnitude of translational energy can be calculated. Vibrational energy can be measured by emission Infra-red spectrum. When HF molecules are just generated, some of them would vibrate at vibrational excited state (V1) and some lies at the ground state. After the reaction, excitation from ground state to first excited state and from first excited state to second excited state (overtone) can both happen. These molecules eventually will go back to ground states, during this process, the intensity of overtone will decrease overtime , but an increase in strength of signal generated by excitation from ground state to first excited state would be observed due to energy released from going higher excitation state to ground state.
Polanyi's rules
Polanyi's rules states that the translational energy is most effective for passing early transition state whereas vibrational energy is most useful in crossing late transition state.[7]
Nice contour plots.Pu12 (talk) 18:56, 21 May 2020 (BST)
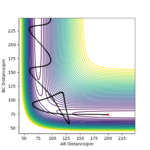
As shown in the contour plot of reaction of F+H2, when the the conditions are set such that the vibrational energy is high and translational energy is low, the line moves towards the transition state, but eventually moves backwards, indicating that this energy combination is not suitable for crossing the transition state and the reaction can not happen. The surface plot of this reaction indicated that it is exothermic, transition state resembles the structure of reactants. Therefore, for this early transition state reaction, energy distribution should be high in translational energy and low in vibrational energy to pass the transition state successfully.
The reverse reaction has a transition state that resembles the products' structure. When the conditions are set to make the system have high translational energy and low vibrational energy, the contour plot shows the trajectory approaches the transition state but moves back towards the reactant side, indicating that under this energy distribution, the late transition state reaction would not happen. Good report, only a few small notes to make. Pu12 (talk) 18:56, 21 May 2020 (BST)
Reference
- ↑ Truhlar, D. G., Garrett, B. C. & Klippenstein, S. J. Current status of transition-state theory. J. Phys. Chem.(1996). doi:10.1021/jp953748q
- ↑ Truhlar, D. G., Garrett, B. C. & Klippenstein, S. J. Current status of transition-state theory. J. Phys. Chem.(1996). doi:10.1021/jp953748q
- ↑ Darwent, B. D. Bond Dissociation Energies in Simple Molecules.National Standard Reference Data System, National Bureau of Standards(1970).
- ↑ Darwent, B. D. Bond Dissociation Energies in Simple Molecules.National Standard Reference Data System, National Bureau of Standards(1970).
- ↑ Yarnell, A. Hammond postulate. Chemical and Engineering News(2003). doi:10.1002/9783527809080.cataz07721
- ↑ Körzdörfer, T., Parrish, R. M., Sears, J. S., Sherrill, C. D. & Brédas, J. L. On the relationship between bond-length alternation and many-electron self-interaction error. J. Chem. Phys.(2012). doi:10.1063/1.4752431
- ↑ Jiang, B. & Guo, H. Relative efficacy of vibrational vs. translational excitation in promoting atom-diatom reactivity: Rigorous examination of Polanyi’s rules and proposition of sudden vector projection (SVP) model. J. Chem. Phys.(2013). doi:10.1063/1.4810007

