
MRD:yh11218
Great report with clear understanding! There are some comments for improvements, but overall well done! :)Mys18 (talk) 01:41, 23 May 2020 (BST)
EXERCISE 1: H + H2 system
Dynamics from the transition state region
On a potential energy surface diagram, how is the transition state mathematically defined? How can the transition state be identified, and how can it be distinguished from a local minimum of the potential energy surface?
On a potential energy surface diagram, the transition state is defined mathematically as ∂V(ri)/∂ri=0 i.e. the gradient of the potential is zero and it can be identified by starting a trajectory with no initial momentum. If it is at the transition state, it will remain there forever. It is a maximum along the reaction coordinate but a minimum in all other directions and is therefore known as a first-order saddle point. To distinguish a transition state from a local minimum the second derivative needs to be calculated. A transition state will have only one negative second derivative along the reaction coordinate (corresponding to the maximum) whilst a local minimum will have a positive second derivative.
Excellent! Simple and clear.Mys18 (talk) 01:07, 23 May 2020 (BST)
Trajectories from r1 = r2: locating the transition state
Report your best estimate of the transition state position (rts) and explain your reasoning illustrating it with a “Internuclear Distances vs Time” plot for a relevant trajectory.
By setting p1 = p2 = 0 g.mol-1.pm.fs-1 an estimate for the transition state position was determined to be r1 = r2 = 90.7742 pm (correct to 6 s.f.) using trial-and-error. The species is stationary when viewed in the animation mode and the horizontal lines in the internuclear distances vs time plot (Figure 1) also corroborates that this is the transition state since the internuclear distances do not change over time.
I would advise against reporting to 6 s.f. Correct values and description. Mys18 (talk) 01:23, 23 May 2020 (BST)
Trajectories from r1 = rts + δ, r2 = rts
Comment on how the mep and the trajectory you just calculated differ.
For the following plots (Figure 2 and 3), r1 = rts + 1 pm = 91.7742 pm and the number of steps for the MEP calculation was increased to 3000 (to obtain a complete MEP) whilst the other initial conditions were kept identical to the ones used to calculate the transition state in the question above. Two calculation types were used: minimum energy path (MEP) and Dynamics. In Figure 2a it can be seen that the trajectory corresponds to infinitely slow motion since the momenta are reset to zero in each time step (as highlighted in Figure 2c). On the other hand, the dynamics calculation type takes into account kinetic energy after bond formation, leading to excess vibrational energy of the molecules. This can be seen in the minor oscillation of the B-C internuclear distance in Figure 3b, whereas in Figure 2b, the B-C intermolecular distance are constant over time.
If the initial conditions were changed to r1 = rts and r2 = rts + 1 pm, then the blue and orange line will swap in Figure 2b, 3b and 3c.


Using the final positions r1(1000)r2(1000) and momenta -p1(1000)-p2(1000), the contour plot (Dynamics) in Figure 4a is identical to Figure 3a except for the absence of the red cross which indicates the starting point of the system. The internuclear distances vs time plot (Dynamics) in Figure 4b is translated to the left by 100 fs and reflected in the y-axis compared to Figure 3b and the momenta vs time plot (Dynamics) in Figure 4c is translated to the left by 100 fs and rotated 180° about the origin compared to Figure 3c.


Reactive and unreactive trajectories
| p1/ g.mol-1.pm.fs-1 | p2/
g.mol-1.pm.fs-1 |
Etot/
kj.mol-1 |
Reactive? | Description of the dynamics | Illustration of the trajectory |
|---|---|---|---|---|---|
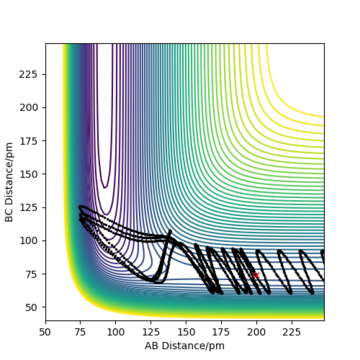
| -2.56 | -5.1 | -414.280 | Yes | The kinetic energy of the system is sufficient to overcome the activation energy and therefore the reactants proceed to the products. The products have greater vibrational energy and oscillate more than the reactants as seen by the frequency and amplitude of the trajectory after the transition state | 
|
| -3.1 | -4.1 | -420.077 | No | The activation energy is higher than the kinetic energy of the system and therefore the products are not formed i.e. the reaction is not successful. | 
|
| -3.1 | -5.1 | -413.977 | Yes | The reaction is very similar to the one in Row 1, although greater vibrational energy is seen in the reactants. | 
|
| -5.1 | -10.1 | -357.277 | No | The kinetic energy of the system is sufficient to overcome the activation barrier. However, once the products are formed, they re-form the reactants since the vibrational energy was too great and the H-H bond disassociated. | 
|
| -5.1 | -10.6 | -349.477 | Yes | This system follows a similar initial trajectory to the one in Row 4 i.e. the kinetic energy of the system is sufficient to overcome the transition state and then form the products which subsequently dissociates due to excess vibrational energy. However, in this instance, the products are re-formed as the reactant H-H bond dissociated a second time. | 
|
Complete the table above by adding the total energy, whether the trajectory is reactive or unreactive, and provide a plot of the trajectory and a small description for what happens along the trajectory. What can you conclude from the table?
To conclude, the system must have sufficient energy to overcome the transition state, otherwise a reaction will not occur e.g. the trajectory shown in Row 2. However even if the transition state is overcome, the trajectory is not necessarily reactive. This scenario of barrier re-crossing is highlighted in Row 4. The system cannot have too much excess vibrational energy as this can cause the bond in the products to dissociate and revert back to the reactants.
Very good. Mys18 (talk) 01:28, 23 May 2020 (BST)
Transition State Theory
Given the results you have obtained, how will Transition State Theory predictions for reaction rate values compare with experimental values?
One of the key assumptions of Transition State Theory is that 'molecular systems that have crossed the transition state in the direction of the products cannot turn back and reform reactants'.[1]. In the fourth and fifth row of the 'Reactive and unreactive trajectory' exercise, it is evident from the contour plots that the transition state was crossed multiple times, therefore failing the assumption above. Hence, it can be expected that the reaction rates predicted by the Transition State Theory may be higher than the experimental values, if barrier-recrossing has occurred.
Excellent, discussion. How about other TST assumptions; at least 4 more can be considered. Hint: tunneling effects can also effect the experimental rate of reaction.Mys18 (talk) 01:30, 23 May 2020 (BST)
EXERCISE 2: F-H-H system
PES inspection
By inspecting the potential energy surfaces, classify the F + H2 and H + HF reactions according to their energetics (endothermic or exothermic). How does this relate to the bond strength of the chemical species involved?
F, H and H are labelled as A, B and C in Figure 5, respectively. The surface plot shows that the H + HF system (red dotted line) is lower in energy than the F + H2 system (black dotted line). Therefore the F + H2 reaction is exothermic and the H + HF reaction is endothermic. The H-F bond is stronger than the H-H bond (565 and 463 kj.mol-1, respectively)[2] and thus the HF molecule is more stable than H2. This is explained by the large electronegative differences between H and F (resulting in a polar, ionic bond) in comparison to the non-polar, covalent bond between two H atoms.
Very good. Mys18 (talk) 01:33, 23 May 2020 (BST)

Locate the approximate position of the transition state.
Using a similar procedure to Exercise 1, the position of the transition state was determined to be rHF = 181.0790 pm and rHH = 74.4878 pm. According to Hammond's postulate,[3] the transition state will resemble the F + H2 system since it is closer in energy. The bond length in a H2 molecule is 74.138 pm[4]. This was used as an initial estimate for rHH and slowly increased as the transition state should involve a slight dissociation of the bond. On the other hand, the value of rHF was expected to be much greater than the H-F bond length of 91.680 pm[5]. A plot of intermolecular distances vs time (Figure 6) for the transition state shows linear horizontal lines, indicating a lack of oscillation and no change in the intermolecular distances.
Report the activation energy for both reactions.
The energy of the transition state is calculated as -433.981 kJ.mol-1. The initial conditions were set to rHF= rts +/- 1 pm, rHH=rts pm and pHF = pHH = 0 g.mol-1.pm.fs-1. The MEP calculation type was used with 1000 steps with size 0.1 fs and 0.3 fs for rHF= rts - 1 pm and rHF= rts + 1 pm, respectively, in order to obtain a full mep. An energy vs time plot (Figure 6a) can be used to determine the activation energy of the endothermic reaction. The energy of the H + HF system is -560.254 kJ.mol-1 and therefore the activation energy is (-560.254 kJ.mol-1) - (-433.981 kJ.mol-1) = -126.273 kJ.mol-1. The activation energy of the exothermic reaction can be determined from Figure 6b. The energy of the F + H2 system is -435.024 kJ.mol-1 and the activation energy is (-435.024kJ.mol-1) - (-433.981kJ.mol-1) = -1.133 kJ.mol-1.
Great answer with excellent estimates!Mys18 (talk) 01:35, 23 May 2020 (BST)


Reactions dynamics
In light of the fact that energy is conserved, discuss the mechanism of release of the reaction energy. Explain how this could be confirmed experimentally.
Initial conditions of rHF = rts-1 pm, rHH = rts and pHF = pHH = 0 g.mol-1.pm.s-1 with 4000 steps at 0.1 fs result in a reactive trajectory for the F + H2 reaction (Figure 7a). This was confirmed by viewing the Animation mode. The conservation of total energy is shown by the horizontal (green) line in Figure 7b. The reaction energy was released by vibrational excitation of the HF molecule. The oscillation can be seen in the blue line of the Momenta vs Time plot (Figure 7c) and also the trajectory of the product in the contour plot (Figure 7a).
The vibrationally excited product molecules can be confirmed experimentally by infrared chemiluminiscence (IRCL). If the HF molecule is formed with excess energy, it appears as excited vibrational states and will decay with emission of infrared radiation.


Discuss how the distribution of energy between different modes (translation and vibration) affect the efficiency of the reaction, and how this is influenced by the position of the transition state.
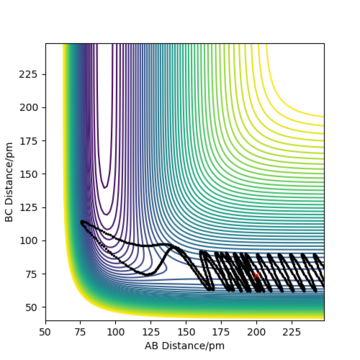
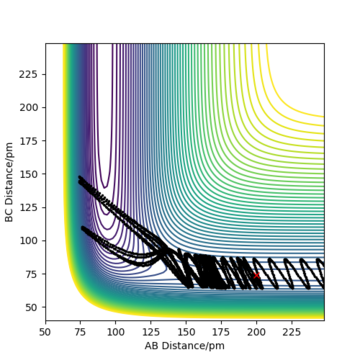
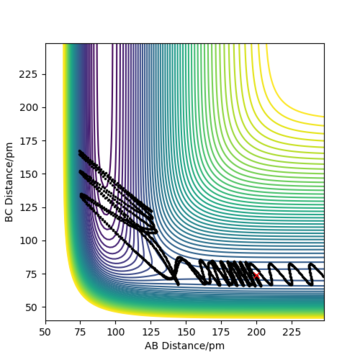
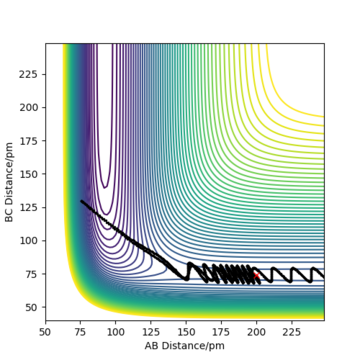
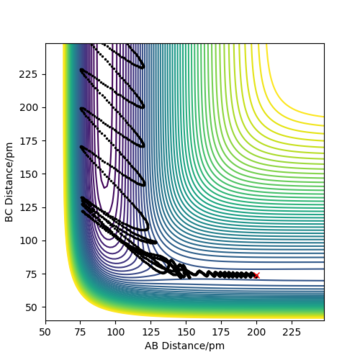
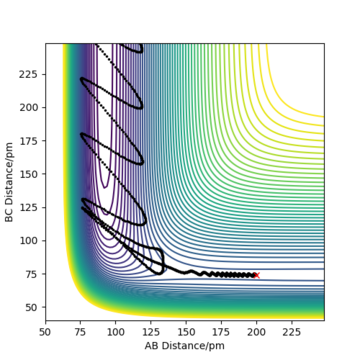
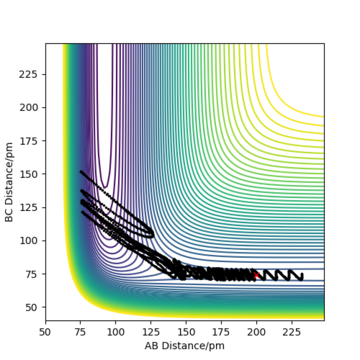
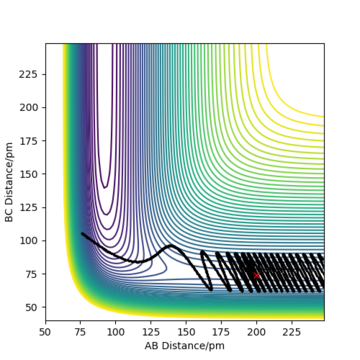
A calculation was set-up on the side of the reactants F + H2: rFH = 200 pm, rHH = 74 pm and pFH = -1.0 g.mol-1.pm.s-1. The pHH value was varied in increments of 1.0 g.mol-1.pm.s-1 between -6.1 and 6.1 g.mol-1.pm.s-1. According to Polanyi's rule, for an exothermic reaction such as F + H2 with an early-barrier (at the entrance channel where the reactants approach each other), low vibrational and high translational energy results in the most efficient reactions.[6] If the molecule has too much vibrational energy then it does not have enough energy to overcome the transition state. However, if the energy is translational along the reaction coordinate, then it can easily surmount the barrier. Therefore, if the H-H momentum is low (-2.1 to 0.1 g.mol-1.pm.s-1 in this case), the trajectory is reactive, whereas values above and below this are unreactive as shown by the contour plots in Figure 8. The exception to this rule is at pHH = 4.1 g.mol-1.pm.s-1. The reactants have sufficient energy to pass over the transition state multiple times which eventually leads to the products forming.
-
 pHH = -6.1 g.mol-1.pm.s-1
 -
 pHH = -5.1 g.mol-1.pm.s-1
 -
 pHH = -4.1 g.mol-1.pm.s-1
 -
 pHH = -3.1 g.mol-1.pm.s-1
 -
 pHH = -2.1 g.mol-1.pm.s-1
 -
 pHH = -1.1 g.mol-1.pm.s-1
 -
 pHH = -0.1 g.mol-1.pm.s-1
 -
 pHH = 1.1 g.mol-1.pm.s-1
 -
 pHH = 2.1 g.mol-1.pm.s-1
 -
 pHH = 3.1 g.mol-1.pm.s-1
 -
 pHH = 4.1 g.mol-1.pm.s-1
 -
 pHH = 5.1 g.mol-1.pm.s-1
 -
 pHH = 6.1 g.mol-1.pm.s-1


Figure 8: Contour plot of F + H2 trajectory with varying pHH
Using the inversion of momentum procedure for a trajectory starting on the transition state, a reactive trajectory for the reverse reaction H + HF starting at the bottom of the entry channel was obtained by setting-up the initial conditions to rHF = 91 pm, rHH = 200 pm, pHF = 12 g.mol-1.pm.s-1 and pHH = -4 g.mol-1.pm.s-1 with 1000 steps at 0.1 fs (Figure 9). Polanyi's rules state that vibrational energy is more efficient than translational for a late-barrier crossing at the exit channel where the products are separating i.e exothermic reaction.[7] In this case, high vibrational energy of the HF molecule is needed along with a low momentum of incoming H atom. If the HF molecule has low vibrational energy and the H atom has high translational energy, the reaction should not occur. This is because the H atom will simply bounce back off the repulsive inner wall of the potential energy surface to the entrance channel.

Clear understanding of Polyani's rules with a good discussion! It is great to see your use of references throughout. Mys18 (talk) 01:38, 23 May 2020 (BST)
References
- ↑ J. I. Steinfeld, J. S. Francisco and W. L. Hase, Experimental Chemical Dynamics, Prentice-Hall, Upper Saddle River, 1989.
- ↑ P. W. Atkins and J. De Paula, Atkins' Physical Chemistry, Oxford University Press, Oxford, 2006.
- ↑ G. S. Hammond, Journal of the American Chemical Society, 1955, 77, 334-338 (DOI:10.1021/ja01607a027).
- ↑ P. W. Atkins and J. De Paula, Atkins' Physical Chemistry, Oxford University Press, Oxford, 2006.
- ↑ P. W. Atkins and J. De Paula, Atkins' Physical Chemistry, Oxford University Press, Oxford, 2006.
- ↑ J. Yeston, Science, 2012, 338, 1397 (DOI:10.1126/science.338.6113.1397-b).
- ↑ Z. Zhang, Y. Zhou, D. H. Zhang, G. Czakó and J. M. Bowman, J. Phys. Chem. Lett., 2012, 3, 3416-3419 (DOI:10.1021/jz301649w).