MRD:yd3717
Exercise 1: H + H2 system
A simple atom-diatom collision is studied where atom A collides with molecule BC to give a new molecule AB and an atom C.
Question 1
On a potential energy surface diagram, how is the transition state mathematically defined? How can the transition state be identified, and how can it be distinguished from a local minimum of the potential energy surface?
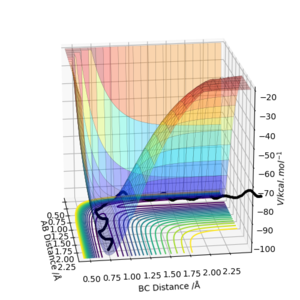
Answer for question 1
A transition state on a surface plot is defined as the maximum on the minimum energy path linking reactants and the products. In mathematics, it is a saddle point in which the derivatives of the function in orthogonal directions are all zero, but is not a local minimum or maximum. [1]
- To explain this, Taylor series of a function of one variable is introduced:
f(a+h) = f(a) + f'(a)h + f' '(a)/2!h2 + ... + f(n)(a)/n!hn+Rn(h)
where fn(a) = dnf(x)/dxn.
- This Taylor expansion of f(x,y) at any point (a,b) can be simplified as:
f(a+h,b+k) = f(a,b) + hfx(a,b) + kfy(a,b) + 1/2[h2fxx(a,b) + 2hkfxy(a,b) + k2fyy(a,b)] + ...
for small h and k.
- Define:
A = fxx(a,b); B = fxy(a,b); C = fyy(a,b);
the above equation can be further simplified to:
f(a+h,b+k) = f(a,b) + 1/2 * (Ah2 + 2Bhk + Ck2) + ...
If there is a point (a,b) which satisfies (1) A = any value and (2) AC - B2 < 0, then this point is a saddle point, in other words, a transition state. However, if (a,b) satisfies A > 0 and AC - B2 > 0, it is a local minimum. Similarly, if (a,b) satisfies A < 0 and AC - B2 > 0, it is a local maximum. Therefore we can distinguish a saddle point from a local maximum or minimum from mathematical expressions.
| A | AC - B2 | nature |
| > 0 | > 0 | minimum |
| < 0 | > 0 | maximum |
| any | < 0 | saddle point |
Good. Mys18 (talk) 17:15, 14 May 2019 (BST)
Question 2
Report your best estimate of the transition state position (rts) and explain your reasoning illustrating it with a “Internuclear Distances vs Time” plot for a relevant trajectory.
Answer for question 2
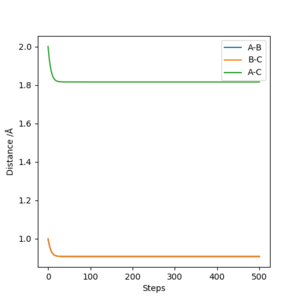
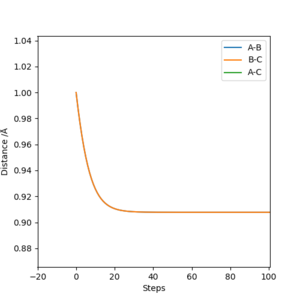
The initial values are set as r1 = r2 = 1.0 Angstrom, p1 = p2 = 0, and the calculation type is MEP, then the above graph of Internuclear distance vs Time plot can be obtained. From the zoomed graph we can see the internuclear distance stabilizes at around 0.91 A. If a cursor can be put on the line, the exact value is shown to be 0.908119 A. This means a transition state is reached at this distance and the atoms will not move if the vibration is ignored.
Correct, perhaps phrase it 'the internuclear distance will not change'. do you think this is the saddle point of your potential energy surface? Mys18 (talk) 17:20, 14 May 2019 (BST)
Question 3
Set the positions r1 = rts + 0.01, r2 = rts and the momenta p1 = p2 = 0, comment on how the MEP and the dynamic trajectory differ.
Answer for question 3

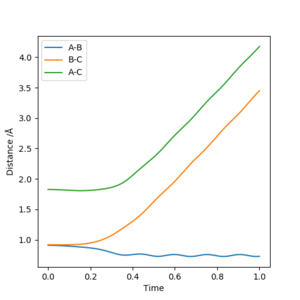
For both MEP and dynamic plots, r1 (rBC) increases after collision and r2 (rAB) decreases after collision. This means A-B becomes H2 molecule, while C is detached. However, in MEP plot, A-B shows a straight line after collition, while it is an oscillating line in the dynamic trajectory. This is because MEP ignores the real motion of the atoms in the reaction, while dynamic calculation will show the vibration of the molecules. For the same reason, the other two lines are slightly different in shape as well, but not as obvious as rAB.

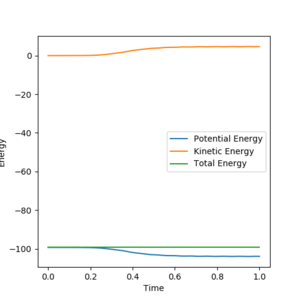
In the MEP calculation, the momenta and velocities are always reset to zero in each time step. Therefore there is no kinetic energy during the reaction, hence the total energy is not conserved. In dynamic calculation, the total energy is conserved.
Excellent, good work relating your plot to your answer and commenting on the significance of the straight/oscillating line. Mys18 (talk) 17:15, 14 May 2019 (BST)
Question 4
| p1 | p2 | Etot | Reactive? | Description of the dynamics |
|---|---|---|---|---|
| -1.25 | -2.5 | |||
| -1.5 | -2.0 | |||
| -1.5 | -2.5 | |||
| -2.5 | -5.0 | |||
| -2.5 | -5.2 |
Complete the table above by adding the total energy, whether the trajectory is reactive or unreactive, and provide a plot of the trajectory and a small description for what happens along the trajectory. What can you conclude from the table?
Answer for question 4
| p1 | p2 | Etot | Reactive? | Description of the dynamics |
|---|---|---|---|---|
| -1.25 | -2.5 | -99.018 | yes | BC and A approach each other, then AB forms, C leaves |
| -1.5 | -2.0 | -100.456 | no | BC and A approach each other, then BC and A separate with no reaction |
| -1.5 | -2.5 | -98.956 | yes | BC and A approach each other, then AB forms, C leaves |
| -2.5 | -5.0 | -84.956 | no | BC and A approach each other, B ocsillates between A and C, but finally end up with C, BC and A separate |
| -2.5 | -5.2 | -83.416 | yes | BC and A approach each other, B ocsillates between A and C, but finally end up with A, AB forms, C leaves |


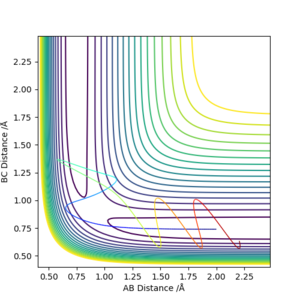
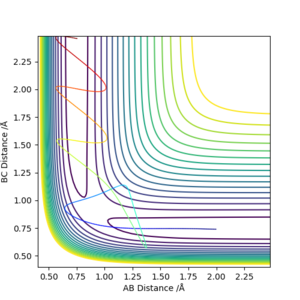
Higher momentum doesn't guarantee the reaction to happen. A right amount of kinetic energy is needed to correspond to the vibrational energy of the molecule, hence to proceed the reaction. Therefore for a reaction to happen, the energy should be enough to overcome the activation barrier, also it should be the right amount for the reation.
Correct reactivities, however what are your units for energy? Remember to always quote units for everything. With your description this is good and rightly so greater KE does not mean a reaction happens, but specifically why? Are we able to go from reactants to products, then back from products to reactants? Mys18 (talk) 17:15, 14 May 2019 (BST)
Question 5
State what are the main assumptions of Transition State Theory. Given the results you have obtained, how will Transition State Theory predictions for reaction rate values compare with experimental values?

Answer for question 5
In Transition State Theory [2], quantum-tunneling is assumed to be negligible. Also the motion of an atomic nuclei can be separated into electronic, vibrational and rotational energies, which is the Born-Oppenheimer Approximation [3]. The third assumption suggests that the atoms in the reactant state have energies that obey Boltzmann distribution. The fourth assumption is that once the system has reached the transition state, it will go towards the product configuration and not return back to the initial state.
Under these assupmtions, transition state theory suggests that the rate constant of an elementary reaction is given by:
kTST = PTS * rc,TS
where PTS is the probability of finding the system in the transition state region and rc,TS is the rate by which the transition state region is crossed.
However, in this reaction where p1 = -2.5 and p2 = -5.0, there is barrier recrossing where the system recross the transition state and reform the reactant. This contradicts with the fourth assupmtion listed above. Therefore the reaction rate cannot be calculated using the simple equation shown above. Since the reactant is reformed, the experimental reaction rate will be lower compare to the theoretical value.
Perfect! Good understanding that indeed the rate of reaction will be slower. Formatting Tips: List the assumptions as opposed to writing a paragraph, making the information clearer. Mys18 (talk) 17:15, 14 May 2019 (BST)
Exercise 2: F-H-H system
Question 6
By inspecting the potential energy surfaces, classify the F + H2 and H + HF reactions according to their energetics (endothermic or exothermic). How does this relate to the bond strength of the chemical species involved?
Locate the approximate position of the transition state.
Answer for question 6
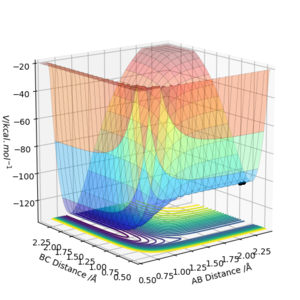
From the plot it can be seen that on the right hand side, the trajectory with large varying values of rAB (r2) and small value of rBC (r1) belongs to the reactant region. The trajectory on the left with large varying values of rBC but small value of rAB is the product region. Also, from reactant F + H2 to product H + HF, the energy (illustrated as height on the plot) decreases. Therefore the forward reaction is an exothermic reaction. Hence the backward reaction H + HF → F + H2 is an endothermic reaction.
H-H bond energy = 432 kJ/mol, H-F bond energy = 565 kJ/mol [4]
H-F bond is very strong, so it needs to take in a lot of energy to break the bond (+565 kJ/mol), however the H-H bond formed has less energy compensation (-432 kJ/mol). Hence the H + HF → F + H2 reaction is endothermic. On the contrary, the forward reaction F + H2 → H + HF liberates more energy (-565 kJ/mol) than it takes in (+432 kJ/mol), so it is an exothermic reaction overall.
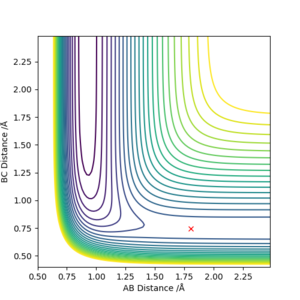
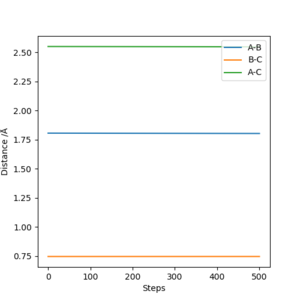
From Hammond postulate, exothermic F + H2 → H + HF reaction will have an early transition state which resembles the structure of the reactants, while endothermic H + HF → F + H2 reaction has a late transition state which resembles the products. The approximate transition state for both reations is at r1 = rBC = r(H-H) = 0.745, r2 = rAB = r(H-F) = 1.806.
Great evidence to show that yes the forward reaction is exothermic. Good use of both the surface plot and the bond formation/breaking values to prove this! Yes, the H-F bond is strong (also, stronger than an H-H bond), in terms of bonding why is this? Mys18 (talk) 17:15, 14 May 2019 (BST)
Question 7
Report the activation energy for both reactions.
Answer for question 7
Number of steps = 5000, Size = 0.004, Calculation type = MEP, r = rTS + 0.01, p1 = p2 = 0
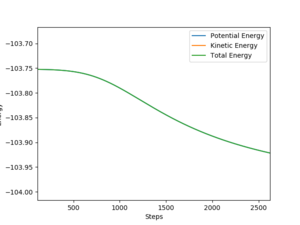
For F + H2 → H + HF reaction, the activation energy is approximately equal to -103.752 - (-103.964) = 0.212 kcal/mol.

For H + HF → F + H2 reaction, the activation energy is approximately equal to -105.317 - (-133.508) = 28.191 kcal/mol.
Good. Mys18 (talk) 17:50, 14 May 2019 (BST)
Question 8
In light of the fact that energy is conserved, discuss the mechanism of release of the reaction energy. Explain how this could be confirmed experimentally.
Answer for question 8

Initial values: rAB = r(F-H) = 1.816, rBC = r(H-H) = 0.74, pAB = -0.8, pBC = -0.2
As the reaction started, the kinetic energy increases and the potential energy decreases. Since total energy is conserved, this indicates that the potential energy of the moleucle is converted into kinetic energy. Molecules with higher kinetic energy move faster. So experimentally this could be seen as a rise in the temperature.
So how would one experimentally measure changes in temperature? (there is a known experimental technique carried out in a closed container). Something else to consider would be the vibrations of H-H and H-F. How do you think these change during the reaction (it might help to open up your momentum/time plot)? How could we measure vibrational energies? Mys18 (talk) 17:55, 14 May 2019 (BST)
Question 9
Discuss how the distribution of energy between different modes (translation and vibration) affect the efficiency of the reaction, and how this is influenced by the position of the transition state.
Answer for question 9
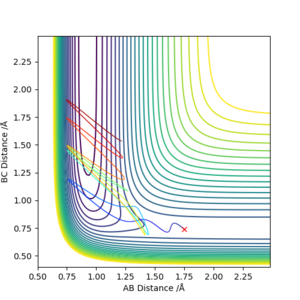
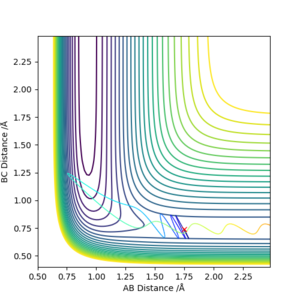
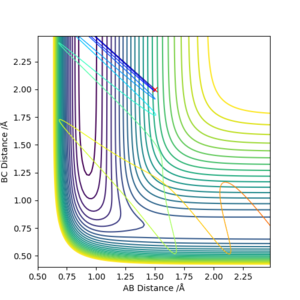
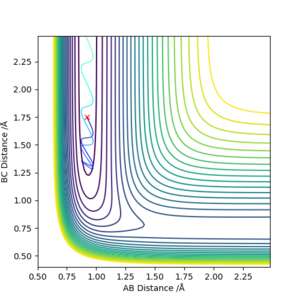
When the momentum values are changed, the distribution of translational and vibrational energy is changed. For F + H2 reaction, pAB is related with translational energy and pBC is related with vibrational energy. For H + HF reaction, pAB is related with vibrational energy and pBC is related with translational energy.
Both high values of translational and vibrational energies don't guarantee a more efficient reaction.
As mentioned before, F + H2 reaction has an early activation barrier. Therefore the reaction is more likely to work with high translational energy and lower vibrational energy. So that the molecule will not waste energies on moving from side to side, instead it travels along the reaction coordinate and cross the activation barrier.
Similarly, the H + HF reaction which has a late activation barrier will prefer lower translational energy and higher vibrational energy conditions. In this case the molecule can use the high vibrational energy to bounce around and find its way to the barrier, instead of sprinting with translational energy and bounce back to the reactant region. [5]
This corresponds to Polanyi's rule:
- Exothermic reactions have early transition state which resembles reactant, translational energy is sufficient in crossing the early barrier.
- Endothermic reactions have late transition state which resembles product, vibrational energy is more efficient in crossing the late barrier.
Perfect. Overall, this is a well structured and written report. You have correctly answered all questions and provided enough detail and expanded on your answers showing your understanding of the task at hand and appreciation of the theory accompanied. Great work! :) Mys18 (talk) 18:05, 14 May 2019 (BST)
Reference
- [1] Saddle point: https://en.wikipedia.org/wiki/Saddle_point
- [2] Transition state theory: T. Bligaard, J.K. Nørskov, Chemical Bonding at Surfaces and Interfaces, 2008 https://www.sciencedirect.com/topics/chemistry/transition-state-theory
- [3] Born-Oppenheimer approximation: Iain R. McNab, Encyclopedia of Spectroscopy and Spectrometry, 1999 https://www.sciencedirect.com/topics/chemistry/born-oppenheimer-approximation
- [4] Bond energies: http://www.wiredchemist.com/chemistry/data/bond_energies_lengths.html
- [5] How the position of transition state affect the reaction: J. I. Steinfeld, J. S. Francisco, W. L. Hase Chemical Kinetic and Dynamics https://imp-primo.hosted.exlibrisgroup.com/primo-explore/fulldisplay?docid=44IMP_ALMA_DS2140126070001591
