MRD:yc16318
Molecular Reaction Dynamics
In this report, the the molecular reaction dynamics for H+H2 and F-H-H systems will be investigated in detail. The physical properties of the systems, such as its transition state and activation energy, will be estimated through running dynamic and MEP calculations.
Exercise I: H + H2 system
Q1
On a potential energy surface diagram, how is the transition state mathematically defined? How can the transition state be identified, and how can it be distinguished from a local minimum of the potential energy surface?
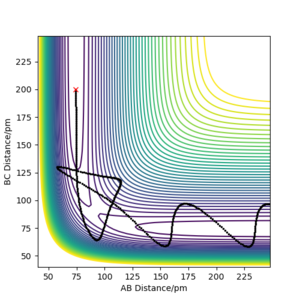
The transition state is mathematically defined as the saddle point, which is a point in a multivariate plane where the second derivative along all coordinates, except for one, is greater than zero. On the potential surface, the reaction trajectories go through a pass of local minima, which includes the saddle point. Therefore, it can also be seen as the maximum minimum energy of the local minima.
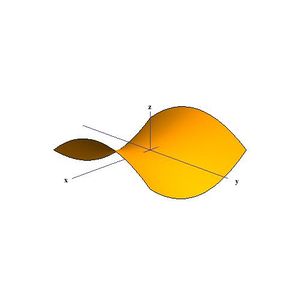
For all critical points such as the local maxima, minima and saddle points, all the first partial derivatives will be equal to zero (i.e. the gradient of the point is zero). All second derivatives for local minima will be positive, all second derivatives for local maxima will be negative. However, for the transition state, some of its second derivatives will be positive, while the rest will be negative.
The local minima and the saddle point can be determined using the Hessian matrix:
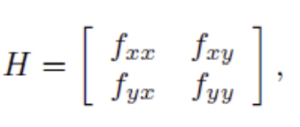
If we let D1 = fxx and D2 = det H, we can distinguish between the local minima, local maxima, and saddle point[[3]]:
1) If D1(a,b) >0 and D2(a,b) >0, then f has a local minimum at (a,b).
2) If D1(a,b) <0 and D2(a,b) >0, then f has a local maxima at (a,b).
3) If D2(a,b) <0, then f has a saddle point at (a,b)
Thanks for a great answer - clear and comprehensive with some nice diagrams and references. Mak214 (talk) 18:07, 13 May 2020 (BST)
Q2
Report your best estimate of the transition state position (rts) and explain your reasoning illustrating it with a “Internuclear Distances vs Time” plot for a relevant trajectory.
rts≈ 90.8 pm is the best estimate.
The transition state can be estimated by looking at the Internuclear Distances vs Time for when the trajectory oscillates on the ridge only (i.e. r1 = r2)

We can see that A-B overlaps with B-C due to the system's symmetric vibration, and that A-C=2 A-B. The internuclear distances are oscillating. This is because that as the atoms vibrate, they stretch and contract from the transition state position. Therefore for the second estimation, the transition state position rts can be found by finding the average value of the peaks and the troughs of A-B and B-C, which is (152 + 70)/2 = 111. However, 111 is still far from the transition state because we can still see relatively strong oscillations, suggesting it is not at the saddle point where it can remain forever.
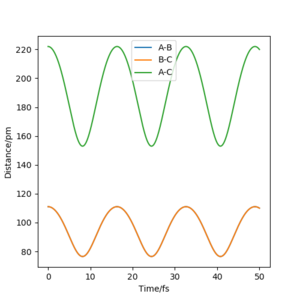
This is because that our estimation is inaccurate as the potential curve follows the shape of an asymmetric oscillator for large displacements. The lowest point of the curve cannot be found be simple average at this point.
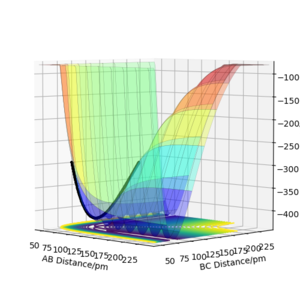
Using the contour plot, we can estimate r1 using a point inside the contour line (92 pm). In this way, the oscillation can be approximated using harmonic oscillator, where the lowest point can be estimated by the average of the peaks of the troughs.
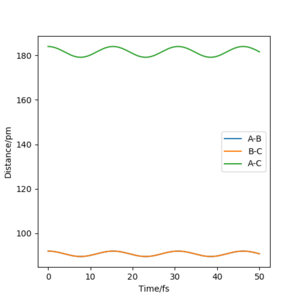
Therefore, r1 can be estimated to be (92 + 89.6)/2=90.8, which gives an Internuclear Distances vs Time plot with straight lines.
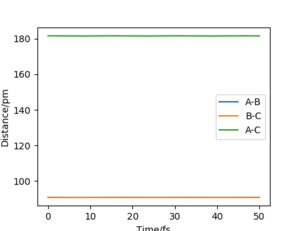
This suggests that one is no longer oscillating and sits on the saddle point. The transition state is estimated.
Nice to see what you have done to find the TS. Good job. Mak214 (talk) 18:07, 13 May 2020 (BST)
Q3
Comment on how the mep and the trajectory you just calculated differ.
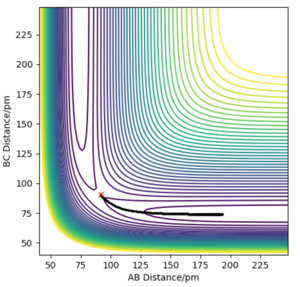
In the MEP calculation, inertial motions are disregarded. As we can see in the diagram, B-C decreases to the bonding distance and then remains constant, while A-B increases throughout. There is no oscillation occurring. Physically, the H1 is moving away from H2-H3, and H2-H3 stays constant after it has decreased to around 75 pm. All energy is transnational.
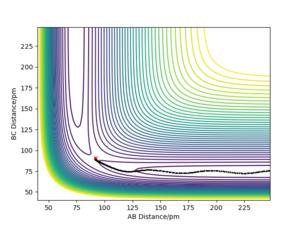
In the dynamic calculation, however, the inertial motions are taken into consideration, which includes the vibration energy into the system. We can see that, as H1 moves away, H2-H3 first decreases, then starts oscillating. Both transnational and vibration energy are included in the system.
Even though the MEP calculation depicts the trajectory with lowest possible energy, it is not realistic. It does not factor in the classical motions of the atoms. However, it gives us further information about the reaction and allows us to estimate how much vibration energy there actually is as simulated in the dynamic calculation. We can infer that, as the system moves slower, it will become more and more similar to the trajectory shown in MEP. Therefore, the slower it moves, the less the hydrogen molecule vibrates.
To gain more in-depth knowledge of the difference between the MEP and the dynamic calculations, we should look at the momentum vs. time plot as well as the internuclear distance vs. time plot for both types of calculations.


For the MEP calculations, the momentum is always zero as the motion is assumed to be infinitely small. The rate of increase of AB distance lowers over time and the BC distance first decreases and then stays constant at r2=75 pm. The AB distance approaches 500 pm for large t values. This is because that the potential surface flattens for large AB distance at constant BC distance, hence the velocity of one 'rolling' down the potential surface also decreases. Eventually, the AB distance will also be constant with time.
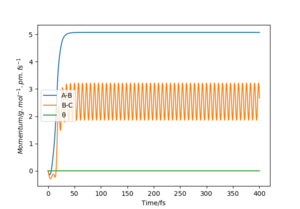
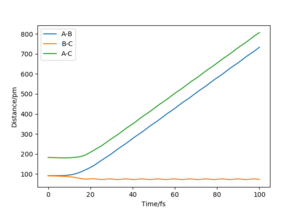
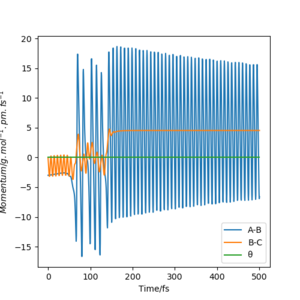
For the dynamic calculation, AB has an increased then constant momentum and BC has an oscillating momentum. This suggest that AB (ie. the speed of H1 moves away from H2-H3) increases at a constant speed once it reaches the 'flattened' potential surface and BC oscillates constantly. Thus, the AB distance becomes linearly proportional to time for large t values.
Application of MEP calculation
Because MEP does not take vibration energy into account, it allows us to calculate the activation energy calculation of a reaction by inputting rn = rts + 1 pm, where n can be either 1 or 2 depending on whether the Ea for the forward ot the backward reaction is calculated.
Reversed condition
When the initial conditions and the final conditions are reversed, AB distance and BC distance are swapped, it is expected that the process will be exactly the reverse of the previous scenarios with the plots being the perfect mirror images of each other.
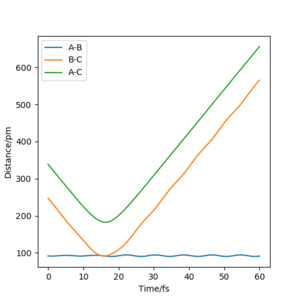
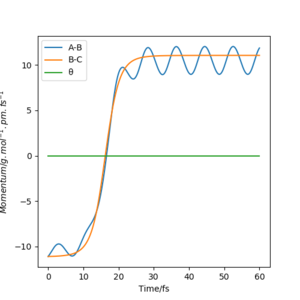
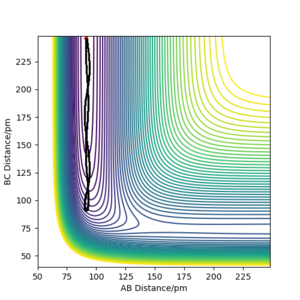
We can see from the plots that, while it resembles the reversed plot of the previous condition, it is not exactly the same. This could be due to the fact that the positions and the momenta of the final conditions were not perfectly estimated. This can also be supported by looking at its contour plot, where the trajectory doesn't pass the transition state due not enough energy in the system.
Really comprehensive. Thank you Mak214 (talk) 18:07, 13 May 2020 (BST)
Q4
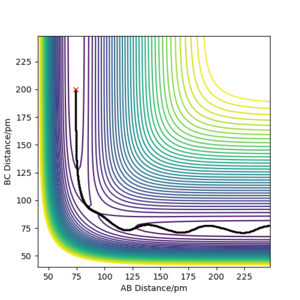
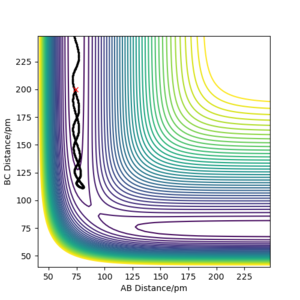
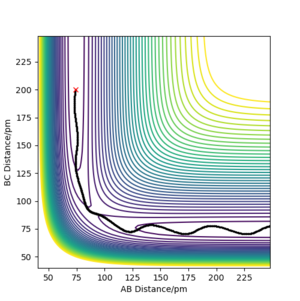
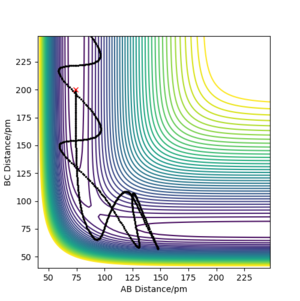
Complete the table above by adding the total energy, whether the trajectory is reactive or unreactive, and provide a plot of the trajectory and a small description for what happens along the trajectory. What can you conclude from the table?
Momenta vs. reactivity table
Conclusion of the table
From the table, we can conclude that Etot and the momenta of AB and BC are not the only factors for whether a reaction will happen. From the conditions in the table, we can see that, when p1 is kept constant, the condition with bigger p1/p2 difference is reactive, even though it has lower Etot. This could suggest that the difference between p1 and p2 might also play an important role in whether a system is reactive.
Good Mak214 (talk) 18:07, 13 May 2020 (BST)
Q5
Given the results you have obtained, how will Transition State Theory predictions for reaction rate values compare with experimental values?
In the transition state theory (TST), only the states of the reactants are considered for the rate of the reaction. It is assumed that, once the transition state is passed, the reaction will proceed to exit from the product channel irreversibly. Therefore, only one crossing of the transition state is allowed. Thus, the rate of the reaction can be approximated by the rate of molecules passing through the transition state.
However, as we can see from the previous simulations, it is possible for the reaction trajectories to pass the transition state twice or more if the particles possess large enough momenta. Therefore, we need a sufficiently large t to determine whether a certain pathway is reactive.
Additionally, because we are treating the nuclei as classical point masses, we expect the motions of the particle to be classical even though energy quantisation can be taken into account by the partition functions. Therefore, TST is unable to reflect the quantum effects in a system, such as the tunnelling effect. Well argued. Can you say whether the result from TST will be generally too high, or too low? Mak214 (talk) 18:07, 13 May 2020 (BST)
Exercise II: F - H - H system
Q6
By inspecting the potential energy surfaces, classify the F + H2 and H + HF reactions according to their energetics (endothermic or exothermic). How does this relate to the bond strength of the chemical species involved?
Looking at the surface plot for a FHH system where FH is AB and HH is BC, we can clearly see that the potential surface for when AB distance is small (F-H is bonded) is much lower than that of when BC is small (H-H is bonded). This is because of the big difference in electronegativity for the F and H atoms, which are 3.98 and 2.20, respectively[[4]]. Therefore, the F-H bond is strongly ionic in nature. Such as strong bond possesses much higher bond dissociation energy compare to the covalent H-H bond (H-F = 567 kJ mol-1 and H-H = 436 Kj mol-1)[[5]], leading to a much lower potential energy surface.
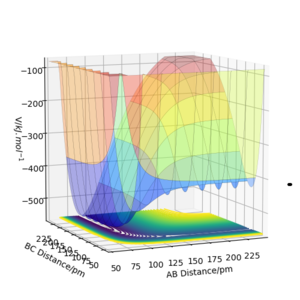
Thus, the reaction of F + H2 forms product FH +H, which exits from the side with small AB distance and much lower potential surface, is energetically favourable and exothermic; reversely, the reaction of FH +H to F + H2 requires energy input and is therefore endothermic.
Nice answer Mak214 (talk) 18:16, 13 May 2020 (BST)
Q7
Locate the approximate position of the transition state.
The position of the transition state is: rHF =181.104 pm, rHH =74.501 pm.
The transition state can be estimated using the contour plot. First the position is estimated to be: rHF = 147 pm, rHH = 76 pm by looking at the contour plot. Then the values can be adjusted by generating contour plot using MEP calculation with 0 momentum for both p1 and p2 as shown below.
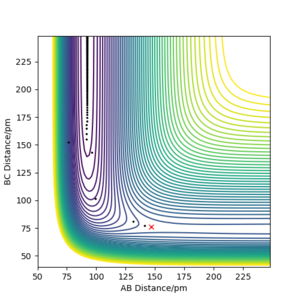
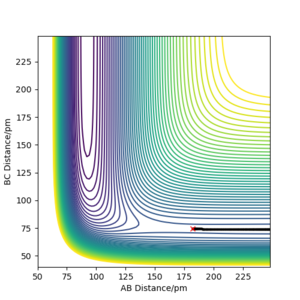
In this end, the trajectory becomes static at rHF =181.104 pm, rHH, suggesting that we have found the transition state.
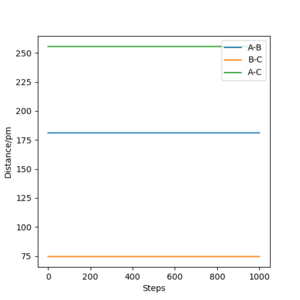

Very good. Mak214 (talk) 18:16, 13 May 2020 (BST)
Q8
Report the activation energy for both reactions.
| Reaction | Activation energy / kJ mol-1 | Transition State Energy / kJ mol-1 |
|---|---|---|
| H2 + F | 2.486 | -431.94 |
| FH + H | 127.055 | -431.168 |
Because we have found that the transition is where rHF (r1) =181.104 pm, rHH (r2) =74.501 pm, we can use the MEP calculation to find the energy vs. time plot at (r1 = rrt + 1 pm, r2 = rrt) and (r1 = rrt, r2 = rrt + 1 pm). The activation energy of H2+F and FH+H can be found from the δE, the difference in energy between the final and initial state, from the two aforementioned plots respectively.


Good. Well done. Mak214 (talk) 18:16, 13 May 2020 (BST)
Q9
In light of the fact that energy is conserved, discuss the mechanism of release of the reaction energy. Explain how this could be confirmed experimentally.
Because energy is conserved, we must have Etot = KE + V. Therefore, if the reaction involves a loss in potential energy (i.e. exothermic), there must exist an increase in the rotational and/or translational KE. This can be illustrated below using the condition (r1=239 and r2=76.501, p1=-3 and p2=-0.1):
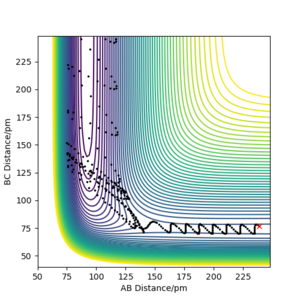
As we can see from the contour plot, the vibration of AB is relatively small compare to BC after C has collided with AB. This suggests that the vibrational KE has increased after the reaction as the trajectory goes down the potential surface.
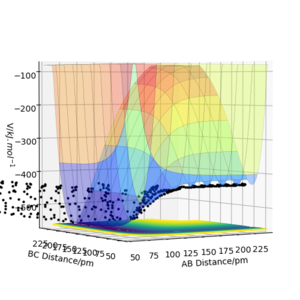
Moreover, this statement can be supported further by the energy vs. time plot, where we can observe that the potential energy of the system decreases whilst the KE increases.
The release of reaction energy as KE can be observed using calorimetry as the increase in KE is directly proportional to the increase in temperature.[[6]] However, such method is incapable of distinguishing between the vibrational and translational KEs. Another method would be the , IR spectroscopy[[7]], which is able to monitor the change in the vibrationl energy of the reactants before and after the reaction.
Really nice answer. Thank you!! Mak214 (talk) 18:16, 13 May 2020 (BST)
Q10
Discuss how the distribution of energy between different modes (translation and vibration) affect the efficiency of the reaction, and how this is influenced by the position of the transition state.
The Polanyi Rules describe the relationship between the distribution of energy in the translation/vibration modes and the efficiency of the reaction.[[8]] The rules state that, for an early transition state, translational energy is favoured over vibrational energy for overcoming the TS energy barrier given both energies have the same momentum parallel to the reaction path; the vibrational energy is preferred for the late transition state.
This is easily understandable if we take the analogy of 'climbing the mountain'. According to Hammond's postulate, an early TS transition state would resemble the reactant and therefore have a low Ea, whereas a late transition state resembles the product and thus have a high Ea. It is more efficient to climb small hill, which is similar to the early TS state, by going in a straight line, hence translational energy is favoured. Meanwhile, it is easier to climb a steep mountain, which is similar to a late TS state, by gradually 'winding up', hence vibrational energy is favoured.
Therefore, for the F-H-H system, the F + H2 reaction has an early TS, therefore increasing the transnational energy of the system while keeping the vibrational energy constant tend to lead to stable product; on the other hand, the FH + H reaction has a late TS, therefore increasing the vibrational energy of the system while keeping the translational energy constant tend to lead to stable product.
Nice answer. Overall an attractive Wiki page to be proud of. With linked references throughout. Clearly you have engaged and (it look like..) enjoyed this lab. Thanks for your hard work, well done. Mak214 (talk) 18:16, 13 May 2020 (BST)
I second that statement. Continue the good work, and keep up the motivation! Fdp18 (talk) 08:35, 16 May 2020 (BST)

