MRD:xs3015
Abstract
In this computational lab, the trajectory of the H+H2 and F+H2/H+HF triatomic systems were investigated with MATLAB. The relation between position of transition state and reactivity of reaction was analyzed under various initial conditions.
Exercise 1: H+H2 system
Location of Transition State
At transition structure, the gradient ∂V (r1)/∂r1=0 and ∂V (r2) /∂r2=0.
At both minimum 1 (reactants) and minimum 2 (products), the gradient ∂V (r1)/∂r1=0 but ∂V (r2) /∂r2 is less than 0.
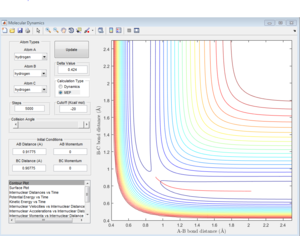
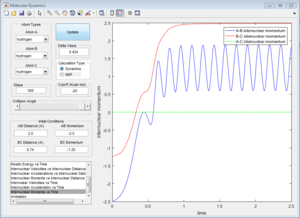
Due to the symmetry of H+H2 surface, the transition state must have r1=r2. In Figure 1, the transition state position is roughly determined to be the intersection of AB and BC at t=0.38 and rTS = 0.9176 Å.
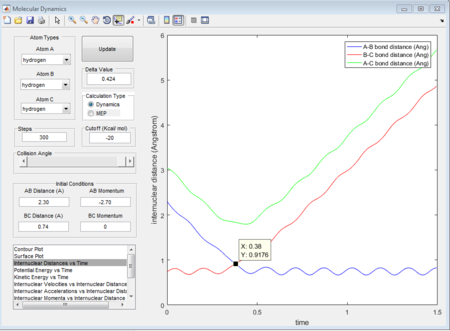
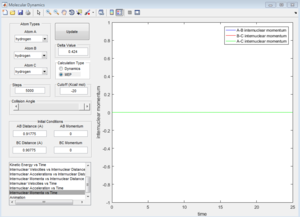
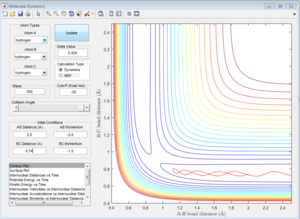
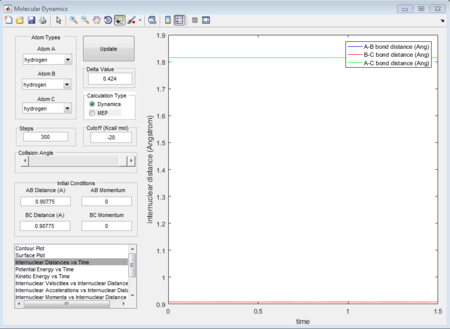
Based on the rough estimation, a more accurate transition state is found at r1=r2=0.90775 Å, p1=p2=0 when the internuclear distance doesn't change with time. (Figure 2)
If one starts a trajectory exactly at the transition state, rTS=0.90775 Å with no initial momentum, it will remain there forever.
Dynamics from the transition state region
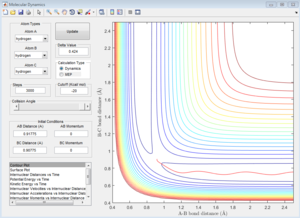
By comparing the MEP and Dynamic trajectory in Table 1 when r1=0.90775 Å, r2=0.91775 Å, p1=p2=0, the absence of fluctuation in internuclear distance and momenta is obvious in the MEP trajectory. Atoms are assumed to be infinitely slow in the MEP trajectory, as a result, the internuclear momentum is negligible.
Table 1. Comparison between MEP and Dynamic trajectory
Reactivity and Unreactivity Trajectory
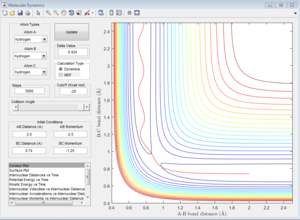
The reactivity of trajectory with varied initial momenta is listed in table 2 while r1=0.74 Å, r2=2.0 Å is kept constant.
table 2. Reactivity of trajectory with different initial internuclear momenta
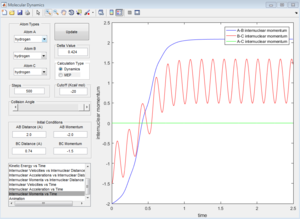
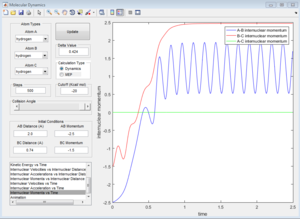
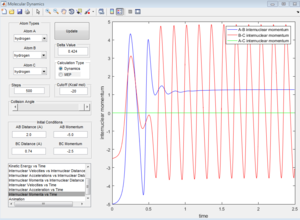
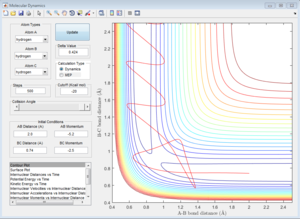
The transition state theory assumes that if a trajectory has enough energy to overcome the transition state energy barrier, the reaction will occur. However, this is not the case in the last two systems. (Figure 12 and Figure 13) In Figure 12a, the trajectory passes through the transition state and comes back to the reactant, whereas, in Figure 13a, the trajectory passes through the transition state, then comes back to reactant and goes to product afterwards. Atoms with high internuclear momenta are likely to flip out from the transition state and roll back to the reactant state. Therefore, the reaction rate value predicted with the transition state theory will be higher than the experimental value as not all trajectory which passes through the transition state will proceed to the final product, which means less successful reactions than expectation.
Exercise 2: F-H-H system
PES inspection
The H-F bond is stronger than the H-H bond, the energy released by H-F formation is more than the energy absorbed by H-H breaking. Therefore, the F+ H2 reaction is exothermic and H+ HF reaction is endothermic.
The approximate transition state is located at the point on the potential energy surface where the trajectory remains there forever when the initial momenta is set to be 0 (similar method as above). In this case, the transition state is found at r1= 1.8135 Å and r2= 0.74 Å, E=-103.2 Kcal/mol. (Figure 14).
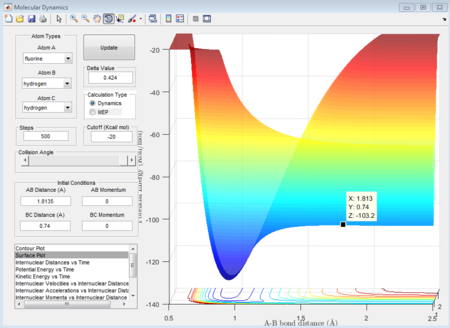
Activation energy is the energy difference between the reactant state and the transition state. The energy of transition state is determined to be -103.2 Kcal/mol as shown above. The reactant state energy for both reactions corresponds to the two minimums in the surface plot of F+ H2 system because the F+ H2 reaction is the reverse reaction of H+ HF reaction. The activation energy for F+ H2 reaction is 0.7 Kcal/mol (Figure 15) and for H+H-F reaction is 30.2 Kcal/mol (Figure 16).
 |
 |
Reaction Dynamics
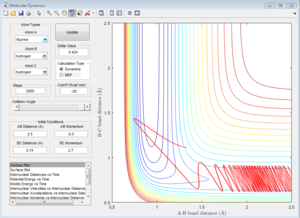
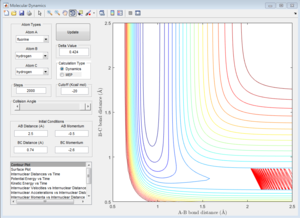
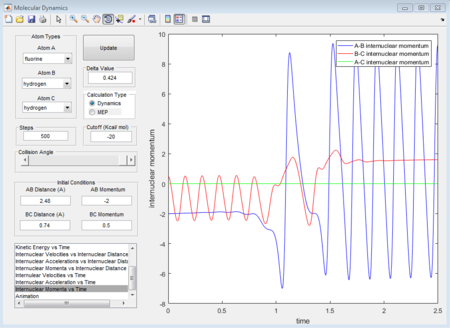
The initial conditions that results in a reactive F+H2 trajectory is set to be r1=2.48 Å, r2=0.74 Å, p1=-2.0, p2=0.5 (Figure 17), the trajectory passes through the transition state and proceeds to the product state.
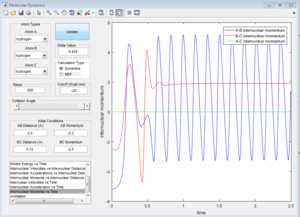
In Figure 18, the internuclear momenta of the newly formed H-F bond has larger vibration, which means it possesses more Kinetic energy than the H-H bond. Temperature indicates the average Kinetic energy in the system, hence, the system temperature increases. As total energy is conserved in the system, potential energy is converted to kinetic energy. This could be confirmed by conducting the F+H2 reaction with same amount of reactants with different initial momenta, the change in reaction temperature should be measured.
 |
 |
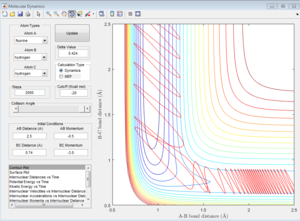
The reactivity of a set of F+ H2 trajectories are investigated under various values of pH-H in the range -3 to 3. Other initial conditions are kept constant. (rH-F= 2.50 Å, rH-H= 0.74 Å, pH-F = -0.5, steps=2000)
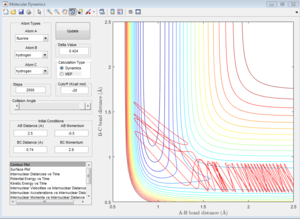
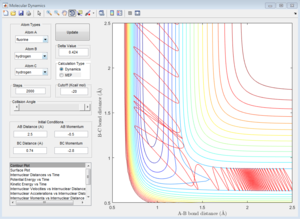
If the initial position is unchanged, but the initial momenta are changed to pFH = -0.8, pHH = 0.1, the contour plot of F+H2 system is shown in Figure 19. These initial conditions results in a reactive pathway as the trajectory passes through the transition state and proceeds to the product state. The vibration is relatively small before reaching the transition state. After the formation of H-F bond and the cleavage of H-H bond, large amount of energy is released and converted to vibrational energy. Therefore, the vibrations afterwards are more significant.
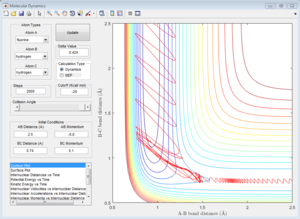
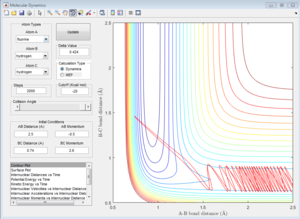
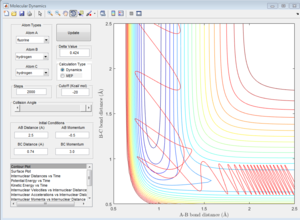
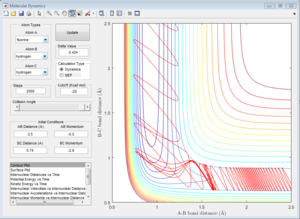
As is shown in Figure 20, the initial conditions that result in a reactive trajectory are rH-F= 0.92 Å, rH-H= 2.50 Å, pH-H = -10.0, pH-F=2.0.

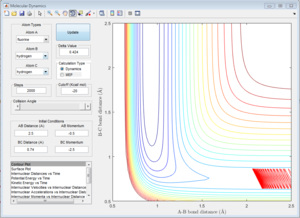
The Polanyi's empirical rules state that vibrational energy is more efficient in promoting a late-barrier reaction than translational energy. [1]For a late-barrier reaction, the transition state is closer to the product state and the reaction is always endothermic, which is the H+HF system. This trajectory is unreactive when the translational energy is very high but vibrational energy is low. However, the trajectory becomes reactive when the H-F vibrational energy increases, this is in great agreement with the Polanyi's empirical rules. AS for the early-barrier reaction, the transition state is closer to the reactant state and the reaction is always exothermic, which is the F+H2 system. Vibrational energy distributed to the H-H bond has less effect on the reactivity of reaction.
Conclusion
The location of transition state is found at the point on the potential energy surface which satisfies ∂V (r1)/∂r1=0 and ∂V (r2) /∂r2=0. A reaction is reactive only if its trajectory passes through the transition state and proceeds to the product state. The reaction rate value predicted with the transition state theory is higher than the experimental value. The reactivity of a reaction is affected by the position of the transition state. Vibrational energy is more efficient in promoting a late-barrier reaction than translational energy, but has less effect in promoting an early-barrier reaction.
Reference
[1]Hua Guo and Kopin Liu, Control of chemical reactivity by transition-state and beyond, Department of Chemistry and Chemical Biology, University of New Mexico, Albuquerque, New Mexico 87131, USA.

