MRD:xs2218
Molecular Reaction Dynamic Lab
Exercise1: H + H2 system
Part 1: Definition of transition state
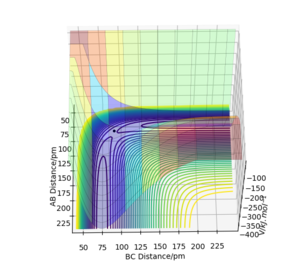
On a potential energy surface diagram, the transition state is mathematically defined as a first-order saddle point, ∂V(ri)/∂V(ri)/∂ri=0. The transition state is defined as the maximum on the minimum energy path linking reactants and the products. To distinguish from the local minimum on the PES, the first-order saddle point is at a minimum in all directions except for one and the trajectories near the transition state roll towards reactants or products. See the surface plot below, the TS is at a saddle point.
Ok, you could have included a description of the second derivative and what this tells us about the maxima and minima directions? Rs6817 (talk) 13:13, 4 June 2020 (BST)
Part 2: Transition state approximation
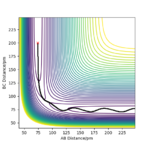
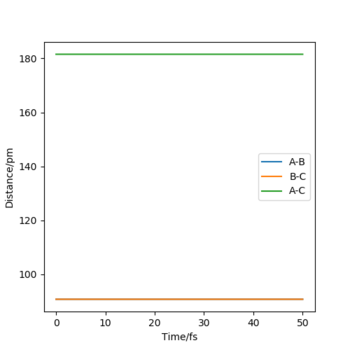
My best estimate of rtsis 90.775pm, it is when the force along AB and BC is 0 KJ.mol-1.pm-1. The atoms are not bonded at TS The internuclear distance vs time plot shows 2 straight lines illustrating that when the atoms are at the transition state, the internuclear distance does not change, no such oscillating behavior where the 2 lines are wavy when not at TS.
Okk, ensure that you refer to the figures numerically in the text and they are labelled as such i.e. Figure 1 shows X. Rs6817 (talk) 13:13, 4 June 2020 (BST)
Part 3: Difference between MEP and Dynamics calculation type
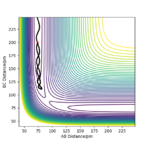
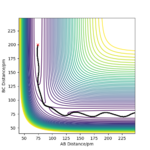
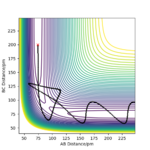
As shown from the surface plots below, two different calculation types give different trajectories. The MEP shows the minimal energy path that any point on the path is at energy minimum in all directions perpendicular to the path which passes through at least one saddle point. Looking at the plots from the same angle, the dynamic surface plot gives a wavy line coming out of the BC distance axis whereas the MEP surface plot gives a relatively straight line within the BC distance axis.


Whilst this comparison is correct, you have not attributed what the wavy or straight lines correspond to. Rs6817 (talk) 13:13, 4 June 2020 (BST)
Part 4: Reactive and unreactive trajectories
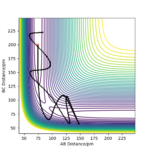
In conclusion, trajectories starting with the same positions but with higher values of momenta would not always be reactive, although the total energy is getting more positive, therefore, the hypothesis is not supported
The descriptions for the table could do with a little more detail. In the last two trajectories we can see some clearly interesting behaviour with the barrier recrossing.Your conclusion is correct but could do with a little more detail as it is a bit unclear. Rs6817 (talk) 13:13, 4 June 2020 (BST)
Part 5: Transition State Theory
The Transition State Theory assumes that Rcl is that all trajectories with a KE greater than the activation energy will be reactive, however, our experimental has suggested that this is not true. Transition state theory is based on classical mechanics, Quasi-equilibrium basically covers that if the atoms did not have enough energy to collide to form the TS, the reaction would not be feasible. However, in quantum mechanics, as long as the barrier has a finite amount of energy, the atoms can still tunnel across the barrier which means that the reaction could still be feasible even if the atoms do not collide enough energy to cross the energy barrier. Quantum tunneling is minimal in TS theory, if quantum tunneling was present, the reaction rate would increase. In transition state theory, it assumes that the step from TS to products is the rate-determining step, but in reality, it might not be true, the reaction rate would. be decreased
Make it clear which aspect of the table you are referring to. Quasi equilibrum refers to the concentration of TS remaming in relation to the concentration of reactant - i.e. the TS is treated as in chemical equilibria with the reactant. Barrier recrossing is not permitted in TST - is this observed in the above table? Rs6817 (talk) 13:13, 4 June 2020 (BST)
Exercise2: F-H-H system
Part 1: PES inspection
F + H2 is exothermic, whereas HF + H is endothermic.
H-H bond strength is weaker than the H-F bond. The energy absorbed to break the F-F bond is smaller than the energy needed to make the new bond H-F, the excess energy is then released as heat, so the reaction is exothermic. However, for HF + H, more energy is needed to break the H-F bond than to make the F-F bond, overall, energy is being absorbed rather than released, so the reaction is endothermic.
Ok good answer just make it clear you are referring to the PES. Rs6817 (talk) 13:13, 4 June 2020 (BST)
Part 2: Transition State Approximation
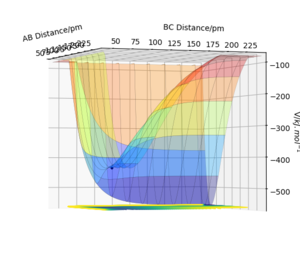
The approximate position of transition state: rAB=181.1 pm, rBC=74.488pm The forces along AB and BC at this position are both 0. According to Hammond Postulate, an exothermic reaction has an early TS, whereas an endothermic reaction has a late TS, therefore, one of the eigenvalues at TS is positive, another one is negative. In this case, the Hessian eigenvalues are -0.002 and +0.332. As shown in the surface plot below, now it is at a saddle point which confirms the atoms are at the transition state.
Ok succinct answer. Hammond postulte could do with a reference. The Hessian value for BC indicates deviation from the actual TS. Rs6817 (talk) 13:13, 4 June 2020 (BST)
Part 3: Activation Energy
The transition state energy is reported as -433.981 kJ.mol-1. A plot of energy vs time is plotted at TS as shown below.
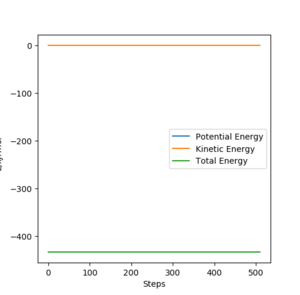
For the exothermic reaction F + H2, the initial state energy is -435.059 kJ.mol-1. Activation energy can then be calculated as 1.08 kJ.mol-1.

For the endothermic reaction HF + H, the initial state energy is -560.700 kJ.mol-1. Activation energy for this reaction is 126.02 kJ.mol-1.

By locating a structure neighboring the TS, the plot of Energy vs time shows that the energy dropping clearly.
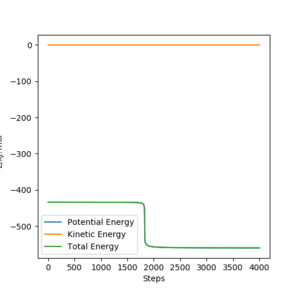
(The plot of the neighboring structure of TS for exothermic reaction is not shown because the difference is too small to be spotted.)
Great answer! Make sure to refer to the figures in the text. Rs6817 (talk) 13:13, 4 June 2020 (BST)
Part 4: Release of reaction energy
The release of reaction energy is basically a release of vibrational kinetic energy converted from potential energy. A contour plot of a reactive trajectory is shown below to illustrate.
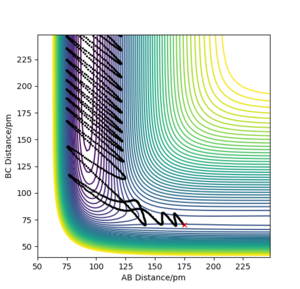
An experimental method to confirm it is IR spectrometry. IR absorption would have stronger overtones that measuring the transition from the first to second state, while IR emission measures the transition from the first to the ground state.
Slighlty confusing answer, a refernece may have helped. Rs6817 (talk) 13:13, 4 June 2020 (BST)
Part 5: Different modes of distribution of energy
In general, vibrational energy is better than promoting endothermic reactions than exothermic reactions, whereas translational energy is better than promoting exothermic reactions than endothermic reactions. When having translational energy, the atoms would bounce onto the potential wall and bounce back. When having vibrational energy, the atoms fall down the reaction channel and overcome the reaction barrier, forming the product.
Make sure to set up your argument in reference to literature - i.e. here the first sentence refers to Polanyis rules. Rs6817 (talk) 13:13, 4 June 2020 (BST)
Plot 1 and 2 illustrate the situation when a huge amount of energy is put into the system on the H-H vibration, the trajectory moves from the left-hand side of the plot to the right-hand side.
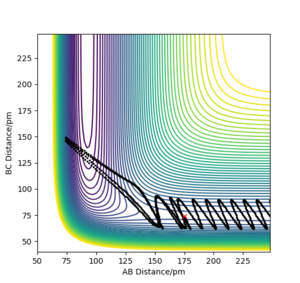
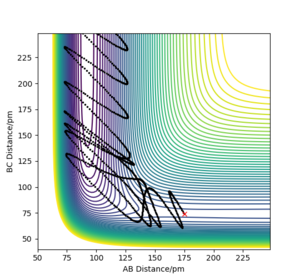
The results need to be expressed in terms of reactivity or unreactivity depending on the dependence on vibrational or translational energy. Rs6817 (talk) 13:13, 4 June 2020 (BST)
When the momentum of F-H is increased slightly, the energy of the overall system is reduced by reducing the momentum of H-H which means the H-H vibrational energy is reduced, the trajectory plot below looks similar to plot 2 when there is high vibrational energy on H-H but with slightly lower F-H momentum. It further confirms that the exothermic reaction is promoted by translational energy better.
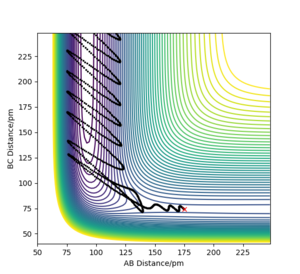
Waht about the vibrational energy ? Could you have confirmed this the other way round? Rs6817 (talk) 13:13, 4 June 2020 (BST)
References
1. R. J. Silbey, R. A. Alberty, M. G. Bawendi Physical Chemistry, 4th ed, John Wiley & Sons, 2005.
2. J. I. Steinfeld, J. S. Francisco, W. L. Hase Chemical Kinetic and Dynamics 2nd ed., Prentice-Hall, 1998, chapter 10
3. K. J. Laidler Chemical Kinetics 3rd ed., Harper-Collins, 1987, chapter 4
4. M. J. Pilling, P. W. Seakins Reaction Kinetics, 2nd ed., OUP, 1995, chapter 4
5.Atkins, de Paula, Keeler, Physical Chemistry, 11th ed
6. I. N. Levine, Physical Chemistry, McGraw-Hill, 4th ed
Ok it is good you have included these, make sure it is clear in the text where each reference refers to. Rs6817 (talk) 13:13, 4 June 2020 (BST)

