
MRD:xmh01513932
On a potential energy surface diagram, how is the transition state mathematically defined? How can the transition state be identified, and how can it be distinguished from a local minimum of the potential energy surface?
On a potential energy surface diagram, the transition state is identified as the maximum on the minimum potential energy path between the reactants and products.
To explain the transition state mathematically, several derivatives have to be addressed first, 1. The first derivative of potential energy (V) with respect to either atomic separation (r1, r2) is zero, i.e. ∂V/∂r1 = 0 and ∂V/∂r2 = 0; 2. The second derivative D = ∂2V/∂r1∂r1 × ∂2V/∂r2∂r2 – ∂2V/∂r1∂r2 = 0; 3. If D > 0, ∂2V(r1)/∂r1∂r1 > 0, then the point with this particular (r1,r2) coordinates is a local minimum point; ∂2V(r1)/∂r1∂r1 < 0 for a local maximum point; 4. If D < 0, then this point is a saddle point, i.e. the transition state. Simply put, the saddle point is simultaneously a minimum and a maximum along two orthogonal directions (i.e. the two atomic separation axes in this case). Good. Mak214 (talk) 18:11, 29 May 2020 (BST)

What did you want to show with these plots? Use figures to illustrate what you are saying in the text, and make sure you discuss every figure you include in your text. Mak214 (talk) 18:12, 29 May 2020 (BST)
Report your best estimate of the transition state position (rts) and explain your reasoning illustrating it with a “Internuclear Distances vs Time” plot for a relevant trajectory.
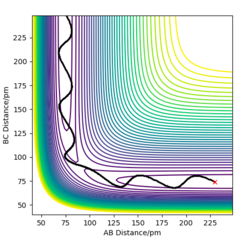
For a symmetric system like H + H2, the internuclear distances of r1 = r2 is expected in the transition state. To test out the best input values for r1 and r2, there would be some expected features on various plots, as shown below, 1. In Figure 3., the kinetic energy of the system is constant at 0. This is explained by the fact that, at the transition state, the net force acting on the system F = dp/dt = ∂V/∂r1 = ∂V/∂r2 = 0 (as defined), the triatomic system is at a state of equilibrium with no change in motion. The same idea is conveyed in Figure 4., where the internuclear distances are expected to have a variation as small as possible, the atoms are “frozen” in space, moreover, rAB(r2) = rBC(r1). 2. In Figure 5., the transition state position (rts) is also checked by the fact that the input r1 and r2 values (denoted by the red cross) map onto the circle which gives the coordinates of the exact rts. Good. Mak214 (talk) 18:13, 29 May 2020 (BST)
The final value of r1 = r2 = 90.7 pm is chosen to satisfy the above requirements.


Comment on how the mep and the trajectory you just calculated differ.
Two paths were generated under the calculation types of MEP and Dynamics respectively, with initial conditions of r1 = rts+1=91.7 and r2 = 90.7 and p1 = p2 = 0 g.mol-1.pm.fs-1. The dynamic graph shows a wavy line (shown in Figure 6.). After passing though rts (now r1 < r2), HAHB molecule is formed, detaching HC. This case takes into account of the intramolecular vibration of the new H2 molecule, since there is an oscillating trajectory at around a fixed rAB value with an increasing rBC value which indicates detaching of HC.


The mep (the minimum energy path) corresponds to a trajectory with infinitely slow motion, i.e. the system’s velocities are reset to zero in each time step, consequently no momentum or kinetic energy, as reflected in Figure 11 & 12. The reaction path way as a smooth curve (shown in Figure .) without any information of the intrinsic vibration within the H2 molecule.


If initial conditions are changed to r2 = rts+1=91.7 and r1 = 90.7 and p1 = p2 = 0 g.mol-1.pm.fs-1, same trends in both the Internuclear Distances vs Time graph and the Momenta vs Time graph are observed as for the previous conditions. Since the system is symmetric, hence the differences between these 2 sets of conditions are just attributed to the fact that whether HAHB or HBHC dissociates. Great. Good use of figures here. Well done. Mak214 (talk) 18:14, 29 May 2020 (BST)
Complete the table above by adding the total energy, whether the trajectory is reactive or unreactive, and provide a plot of the trajectory and a small description for what happens along the trajectory. What can you conclude from the table?
| p1 | p2 | Etot | Reactive? | Description of the dynamics | Illustration of the trajectory |
|---|---|---|---|---|---|
| -2.56 | -5.1 | -414.280 | Reactive | HA approaches HBHC molecule from a distance of rAB = 200 (starting from the bottom-right of the figure), with rBC being constant since HB and HC still remain bonded. After passing through rts, the new HAHB molecule is formed as shown by the constant rAB and increasing rBC as HC leaves(at the top left of the figure). | 
|
| -3.1 | -4.1 | -420.077 | Unreactive | HA approaches HBHc (bottom-right), however it does not quite get to rts due to a reduced amount of kinetic energy compared to the first case, hence HA bounces off, there is no interaction with the hydrogen molecule. | 
|
| -3.1 | -5.1 | 413.977 | Reactive | Same as the first case except for the fact that p1 has a larger value, hence the system is more energetic to go over the activation barrier, and due to energy conservation, after the collision, the new molecule has a greater vibration. | 
|
| -5.1 | -10.1 | -357.277 | Unreactive | Barrier recrossing - the system is energetic enough to go over the transition state region and form the new HAHB, since rBC increases from its original bond length, indicating the leaving of HC, and the Etot is also greater than the first case (a reactive case). However, rBC drops down again to the original bond length and rAB increases as the system reverts back to HBHC. | 
|
| -5.1 | -10.6 | -349.477 | Reactive | The system HBHC converts to HAHB after reaching rts, but reverts given the excess momentum in p2 as rAB increases and rBC decreases, the system crosses the transition region again to form the final HAHB molecule as rBC continue increasing and rAB stays oscillating around a fixed value. | 
|
From the first sight, it seems reasonable to encourage a successful collision by adding more momentum into the system since this increases the kinetic energy of the atoms to overcome the activation barrier. However, as concluded from the table, the excess momentum and energy could give rise to greater vibration within the molecule and hence cause the bond to dissociate. Great. Mak214 (talk) 18:46, 29 May 2020 (BST)
Given the results you have obtained, how will Transition State Theory predictions for reaction rate values compare with experimental values?
In the transition state theory, the average transmission rate/frequency is estimated based on the assumption that all trajectories with some kinetic energy greater than the activation energy will be reactive. From the empirical data of the last section, it was shown that if momentum is provided such that the vibration is so great that the bond dissociates again, i.e. barrier recrossing occurs, this reduces the rate of a particular conversion, e.g. from HBHC and HA to HAHB and HC. This would overestimate the transition state theory rate constant (and hence the rate). The transition state theory also consider the reaction pathway through classical mechanic collision (for macroscopic system). However, wavefunction (for microscopic system) of the atoms should be considered. Quantum tunneling may take place, it is not necessary to jump over the activation barrier, hence less kinetic energy is required for a successful collision, rate is higher than the theory prediction. Yes. Include references. Mak214 (talk) 18:47, 29 May 2020 (BST)
By inspecting the potential energy surfaces, classify the F + H2 and H + HF reactions according to their energetics (endothermic or exothermic). How does this relate to the bond strength of the chemical species involved?
In GUI, it is set up that the atom A approaches and collide with the molecule HBHC. In the F+H2 system, F is considered as atom A, and the 2 H atoms as atoms B and C. Figure 14(A) shows the entrance channel for the reactants F+H2, since rBC (the molecule’s bond length) is constant and rAB is big; Figure 14(B) shows the exit channel for the products (FH+H), since rAB is now constant and rBC is big. Comparing the V for the 2 channels, the reactants are at a higher V than the products, hence this is an exothermic reaction.
.png)
xmh.png)
For the H+FH system, the same idea applies, from Figure 15(A). & (B)., the reactants are at a lower V than the products, hence it is an endothermic reaction.
mh.png)
xmh.png)
This correctly reflects the result obtained from qualitative bond-strength analysis. F-H is a very strong bond (compared to other possible bonds in the system) due to the different electronegativities and hence ionic contribution to the nature of the bond. Hence breaking this bond requires much energy, and forming it releases much energy. In the F+H2 reaction, a pure covalent bond is broken to form the strong F-H bond, this is expected to be exothermic; in the H+FH system, the energy released from forming H2 does not compensate for the energy required to break F-H first, hence it is expected to be endothermic. Nice discussion and well illustrated. Mak214 (talk) 19:12, 29 May 2020 (BST)
Locate the approximate position of the transition state.
The approximate position of the transition state was investigated in the case of F+H2, where F is considered as atom A, and the 2 H atoms as atoms B and C. It was found that rAB = 181.1 and rBC = 74.5. This is reflected by Figure 20., where the internuclear distances are constant between all 3 atoms, corresponding to equilibrium at the transition state. Etot = - 433.980. For the case of H+HF, same rts was found, since this reaction is just the reverse reaction of the above case, and the same geometry is found at the transition state. Great. Mak214 (talk) 19:14, 29 May 2020 (BST)


Report the activation energy for both reactions.
In order to find the reactants’ energy for the F+H2 reaction, initial conditions were set as rAB = 1000 and rBC = 74.5. The value of rAB was chosen so that there is no interaction in the system since the F atom is at a very distant away from the H2 molecule, as reflected by Figure 20., where the only momentum is given by the oscillation between the bonded molecule. Etot = - 435.057. Hence the activation energy = Etot(transition state) – Etot(reactants) = - 433.980 + 435.057 = 1.077.

Same method applies to the H+FH system, the activation energy = 125.322. Good, well done. I think a different type of plot would have been more illustrative here, personally. Mak214 (talk) 19:13, 29 May 2020 (BST)
In light of the fact that energy is conserved, discuss the mechanism of release of the reaction energy. Explain how this could be confirmed experimentally.
There are 3 types of energies associated with the system: potential energy due to the interactions between the atom and the molecule, vibrational kinetic energy and translational kinetic energy. After a successful collision, these energies would redistribute based on the mass and bond strength of the atom and molecule, some energy might excite the new molecule into a higher vibrational state. However, the molecule would eventually drop down to the ground state, releasing energy. The IR overtone region could be used to confirm the presence of the transition between higher states, the peaks appear at higher wavelength (higher energy). Consequently, this confirms the following release of energy. Yes. Mak214 (talk) 19:14, 29 May 2020 (BST)
Discuss how the distribution of energy between different modes (translation and vibration) affect the efficiency of the reaction, and how this is influenced by the position of the transition state.
According to Polanyi's rules, the reactants' translational energy activates them more effectively to the activation barrier and hence increases rate for exothermic reactions; conversely, the reactants' vibrational energy activates more effectively for endothermic reactions. For the exothermic F+H2 system, the translational energy is more important to give a successful collision. For the endothermic H+HF system, the vibrational energy is more important. Good. Mak214 (talk) 19:16, 29 May 2020 (BST)
Overall a nice report but missing references. Get into the habit of using literature references to support your discussion in your work. Mak214 (talk) 19:16, 29 May 2020 (BST)