MRD:xc2017
EXERCISE 1: H + H2 system
On a potential energy surface diagram, how is the transition state mathematically defined? How can the transition state be identified, and how can it be distinguished from a local minimum of the potential energy surface?
Answer: The transition state is a saddle point in the potential energy surface diagram where ∂V(ri)/∂ri=0 and G<0 where G = frr(r0,r'0)fr'r'(r0,r'0)−f2rr'(r0,r'0).
The transition point was defined as a maximum point in the minimum energy path linking reactants and products. For triatomic reaction, the transition state can be identified in reaction path in the contour plot where the AB and BC distance are equal.
The local minimum point can be distinguished by secondary partial derivation equal to zero and G > 0.
Good, would be nice to also see the second partial derivative for the local minimum. You can never write too much! Mys18 (talk) 00:39, 9 June 2019 (BST)
Report your best estimate of the transition state position (rts) and explain your reasoning illustrating it with a “Internuclear Distances vs Time” plot for a relevant trajectory.
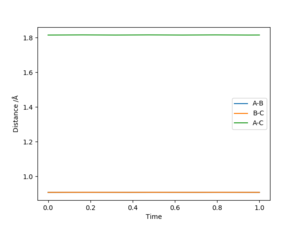
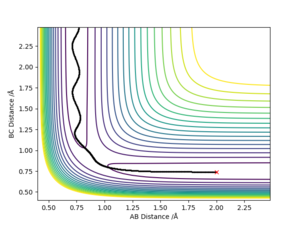
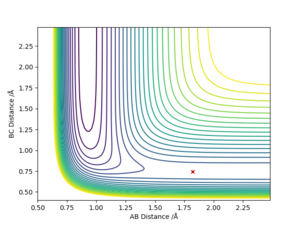
Answer: The best estimate transition position is r1=r2=0.9075 Å where the “Internuclear Distances vs Time” plot shows two straight lines (Picture.1). The picture of distance vs time plot shows the AB and BC distance are constant which indicated the transition state.
Comment on how the mep and the trajectory you just calculated differ.


Answer:
BC = r1 = rts+0.01
AB= r2 = rts
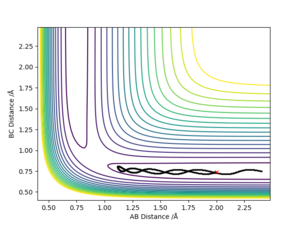
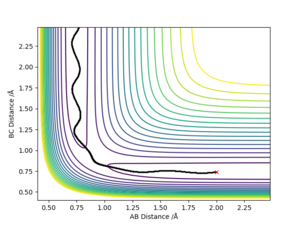
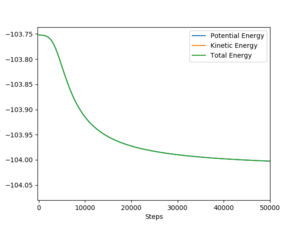
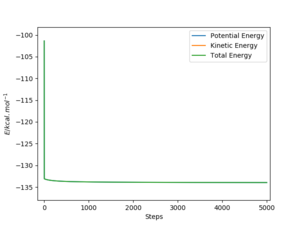
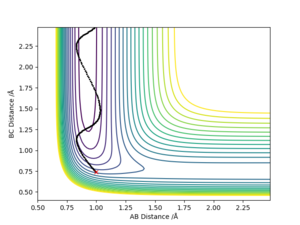
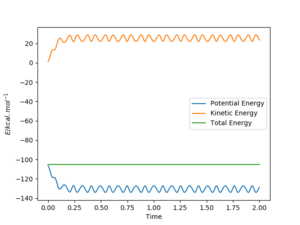
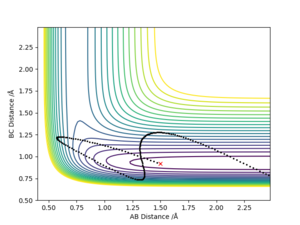
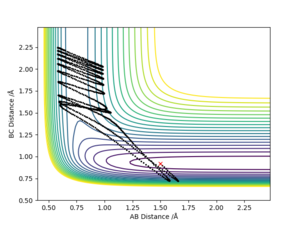
The initial condition was set to r1 = rts+0.01 and r2 = rts , thus the AB distance (r2) =0.9075 Å, and the BC distance (r1) = 0.9175 Å According to Picture 2 and 3, the reaction path calculated by MEP method was more smooth than the path calculated by dynamic method. For Picture.2 (using dynamic method), the reaction path vibrated at the lowest energy. For the MEP method, the reaction pathway was more smooth and more fit to the lowest energy barrier. The difference between two ways of calculation may be because that MEP corresponds to infinitely slow motion while the dynamic method doesn't. For the dynamic calculation, the molecules move in a relative fast speed and vibrate. This makes the energy calculation harder. Thus, for small initial momenta, MEP calculation was more fit to the surface plot.
Sure, but why does it correspond to infinitely slow motion, what is always reset for this calculation? Mys18 (talk) 00:42, 9 June 2019 (BST)
| Initial | Final (dynamic) | Final(MEP) | |
|---|---|---|---|
| r1/Å | 0.9175 | 7.15 | 3.75 |
| r2/Å | 0.9075 | 0.75 | 0.76 |
| p1 | 0 | 2.46 | 0 |
| p2 | 0 | 1.33 | 0 |
For the table below, the initial distance was switched for r1 and r2,
BC distance =r1 = rts
AB distance = r2 = rts +0.01
According to the table below, it can be seen that the final value for both distance and momenta switched as the initial distance switched, and this change does not depend on their calculation method.
| Initial | Final (dynamic) | Final(MEP) | |
|---|---|---|---|
| r1/ Å | 0.9075 | 0.74 | 0.76 |
| r2/ Å | 0.9175 | 7.15 | 3.75 |
| p1 | 0 | 1.33 | 0 |
| p2 | 0 | 2.46 | 0 |
Complete the table by adding the total energy, whether the trajectory is reactive or unreactive, and provide a plot of the trajectory and a small description for what happens along the trajectory. What can you conclude from the table?
In conclusion, to complete a productive reaction, the reactants should have enough energy to pass through the transition state but not too high to reverse the product back into the reactants.
State what are the main assumptions of Transition State Theory. Given the results you have obtained, how will Transition State Theory predictions for reaction rate values compare with experimental values?
- Quantum-tunnelling effects are assumed negligible.
- The Born-Oppenheimer approximation is invoked.
- The atoms in the reactant state have energies that are Boltzmann distributed.
- Once the system attains the transition state, with a velocity towards the product configuration, it will not reenter the initial state region again.
Excellent, why is it that having 'too high' energy causes it to recross the TS? Mys18 (talk) 00:43, 9 June 2019 (BST)
EXERCISE 2: F - H - H system
By inspecting the potential energy surfaces, classify the F + H2 and H + HF reactions according to their energetics (endothermic or exothermic). How does this relate to the bond strength of the chemical species involved?
Good, you could even compare these against literature values for bond energies and see how you get the same answer (exothermic for reaction 1 etc.). Mys18 (talk) 00:45, 9 June 2019 (BST)
Locate the approximate position of the transition state.
Report the activation energy for both reactions.
Nice units! Mys18 (talk) 00:46, 9 June 2019 (BST)
In light of the fact that energy is conserved, discuss the mechanism of release of the reaction energy. Explain how this could be confirmed experimentally.
Sure, however lets focus on vibrational motion, as we have looked into this in great detail and it is more suited for this. How would you study vibrational motion, and what bonds could you investigate? What do you think you would observe? Mys18 (talk) 00:48, 9 June 2019 (BST)
Discuss how the distribution of energy between different modes (translation and vibration) affect the efficiency of the reaction, and how this is influenced by the position of the transition state.
Good, might be worth expanding on your answer to cover all the bases, so late TS therefore high vibrational energy has a higher efficiency than transnational energy. Also, give an explanation for the opposite case, F + H2? Mys18 (talk) 00:51, 9 June 2019 (BST)
Reference
- ↑ T.Bligaard, J.K.Nørskov, in Chemical Bonding at Surfaces and Interfaces, Elsevier, Amsterdam, 2008, pp 255-321.

