By modelling atoms as spheres, classical Newtonian mechanics is used to simulate collisions, which gives an insight into chemical reactivity in triatomic system (an atom and a diatomic molecule collide).
The reactivity of triatomic systems are being studied through calculating Molecular Dynamics trajectories using triatomic model. The H + H2 and F-H-H systems are being investigated.
The triatomic model used is defined below
By inputting the initial distances (r1 and r2) and momenta of AB and BC, the system is able to calculate the trajectory of the reaction. It can also show if the system has sufficient energy (vibrational or translational) to pass the potential energy activation barrier to reach the transition state and form the product.[1]
EXERCISE 1: H + H2 SYSTEM
What value does the total gradient of the potential energy surface have at a minimum and at a transition structure? Briefly explain how minima and transition structures can be distinguished using the curvature of the potential energy surface.
The total gradient of the potential energy surface at both minimum and transition structure is 0.
The transition state links two minima and represents the maximum on the minimum energy path. Minimum is at the lowest point on the potential energy curve. Therefore in order to distinguish between minima and transition structures, second derivatives of the function [∂V(ri)/∂ri] is calculated. At minimum, the second derivative is greater than zero (positive). When the second derivative is less than zero (negative), that point indicates the maximum, i.e. the transition state.
Locating transition state position (rts)
Figure 1: Initial Conditions Internuclear Distances vs Time Graph
Transition states occurs when R1 = R2, a stationary point wheres no interaction between the three hydrogen atoms and hence no movement, therefore p1 and p2 equals to zero.
With initial conditions:
r1 = 0.74 Å ; r2 = 2.30 Å
p1 = 0.0 ; p2 = -2.7
A rough estimation of where the transition state occurs can be obtained from the Internuclear Distances vs Time graph (Figure 1). Transition state occurs when r1 and r2 crossing each other at 0.9176Å when t = 0.38s. It is shown from the animation that the true transition state occurs at 0.90775Å.
This can be proved by plotting a new Internuclear Distance vs Time graph (Figure 2) using the new conditions:
r1 = r2 = 0.90775 Å
p1 = p2 = 0.0
Figure 2: Internuclear Distances vs Time graph at Transition State
From this new graph, the two distances (r1 and r2) and rAC are constant throughout the whole time thus the system is proved to be at transition state.
Therefore, rts = 0.90775Å.
Difference between the mep and the calculated trajectory
With initial conditions:
r1 = rts + 0.01 ; r2 = rts
p1 = p2 = 0
The MEP calculation of the trajectory is shown in Figure 3.
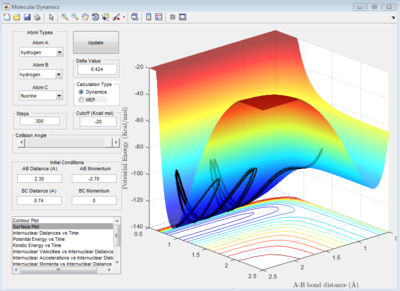
Figure 3: MEP Calculation Surface Plot
MEP calculation represents the minimum energy pathway and realistic motion of the atoms during the reaction is not taken into account. Therefore, the trajectory travels in a straight line along the minimum energy.
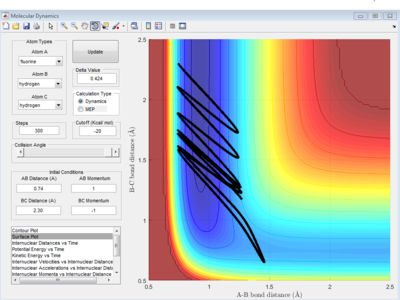
Figure 4 shows the dynamics calculation of the trajectory.
Figure 4: Dynamics Calculation Surface Plot
For dynamics calculation, vibrational energy is taken into account therefore the trajectory fluctuates along the minimum energy and travels like a wave instead in a straight line.
For both reactions, since the distance between HB-HC is slightly larger that that of HA-HB, therefore bond distance between HB-HC increases.
Positions and average momenta at large t:
r1 = 5.281 Å
r2 = 0.7455 Å
p1 = 2.481
p2 = 1.550
What would change if initial conditions are changed to r1 = rts and r2 = rts+0.01?
The same thing would happen as above but this time the trajectory travels on the other exit channel and increase the HA-HB bond distance.
Reactive and Unreactive trajectories
For the initial positions r1= 0.74 Å and r2= 2.0 Å, trajectories are run with the following momenta combination:
Table 1: Reactive or Unreactive Trajectories with Different Momenta Combinations
Reaction
p1
p2
Reactive?
Description
Figure
1
-1.25
-2.5
Yes
The trajectory is reactive and transition state is at 0.43 time unit.
HA approaches HB-HC as distance between HA and HB decreases. The reaction has sufficient energy to surmount the activation barrier and proceeds to break HB-HC bond as HB-HC bond distance increases to produce HA-HB bond.
Due to conservation of momentum, as HB-HC barely oscillates, the kinetic energy transfers from HA to HC decreases. Therefore, a straight line is shown in the beginning of the reaction pathway.
As HC departs, the HA-HB distance periodically extends and contracts, corresponding to the vibration of the HA-HB product.
2
-1.5
-2.0
No
This trajectory is not reactive.
HA approaches HB-HC as distance between HA and HB decreases. However, the reaction does not have sufficient energy to surmount the activation barrier, therefore the trajectory bounds off the barrier and returns along the entrance channel to the reactants, thus HA is regenerated.
Since p2 is decreased to -2.0, there is insufficient activation energy for HC to leave.
3
-1.5
-2.5
Yes
This is a reactive trajectory with transition state at 0.43 time unit.
Like reaction 1, HA approaches HB-HC as distance between HA and HB decreases.
Instead of a straight line in the beginning of the reaction, there is some vibrational momentum. The reactants begin with little vibrational energy and the energy is sufficient to surmounts the barrier and proceeds to break the HB-HC bond (increasing HB-HC bond distance) and form HA-HB bond with vibrational excitation.
4
-2.5
-5.0
No
The trajectory is not reactive.
The re-crossing of the transition state region suggesting that the transition state theory is not suitable for this reaction because it over estimated the reaction rate.
The initial momentum is very large such that the reaction has sufficient energy to surmount the activation barrier. However, the reaction does not proceed to form the product, as HA-HB bond being formed in the first place but is still broken at the end, proved by the increasing distance between HA and HB.
Some of the translational energy of the incoming reactants is converted into vibration of the HB-HC molecule following the collision.
5
-2.5
-5.2
Yes
The trajectory is reactive.
The transition state is being crossed three times respectively at 0.16, 0.33 and 0.54 time unit. Transition state theory is suitable for this reaction.
HA approaches HB-HC as the distance between HA and HB increases. There is sufficient energy to surmount the activation barrier and leads to the breaking of HB-HC bond with increasing HB-HC bond distance and the formation of the final product, HA-HB bond.
HA-HB bond is formed with vibrational excitation.
Main assumptions of Transition State Theory
In transition state theory[2] of reaction rates, it is assumed that once the system reaches the transition structure with sufficient energy, the product can be produced. It assumes that every trajectory launched towards the products is reactive and neglects trajectories that re-cross.
("It assumes that every trajectory launched towards the products is reactive" got a source for this? I think that would imply that even trajectories which do not have the activation energy are successful, as long as they are launched in the correct direction. Lt912 (talk) 02:22, 26 May 2017 (BST))
How will Transition State Theory predictions for reaction rate values compare with experimental values?
The transition state theory is not always suitable and this can be proved with reaction 4(Table 1). The assumption fails and the theory overestimates the reaction rate. Although the reaction has sufficient energy to surmounts the activation barrier, it does not have the right vibrational mode therefore the product is not formed.
EXERCISE 2: F - H - H SYSTEM
PES inspection
Classify the F + H2 and H + HF reactions according to their energetics (endothermic or exothermic.) How does this relate to the bond strength of the chemical species involved?
F + H2 reaction
Figure 5: Surface Plot of F + H2 Reaction
As seen from Figure 5, the reaction begins on the left hand side (i.e. reactants) and ends on the right hand side (i.e. products). Reactants have a higher potential energy comparing to the products with a difference around 30 kcal/mol. Since the HF bond is stronger than HH bond, therefore lowering the products' energy. With the product channel at a lower energy, this reaction is considered highly exothermic and heat energy is released when reactants are converted to products.
H + HF reaction
Figure 6: Surface Plot of H + HF Reaction
From Figure 6, the reaction again runs from the left to the right, therefore reactants on the left and products on the right. However this time the reactants have a lower potential energy (40 kcal/mol lower) because the HF bond is stronger than the HH bond being formed as the product. The activation barrier is at a higher energy compared to that of the F + H2 reaction, hence in order to form the less thermodynmically stable product, reactants need to overcome more energy. This is an endothermic reaction and energy is absorbed when H + HF are converted into F + H2.
Locate the approximate position of the transition state.
Since the activation barrier height is so small, it is very hard to locate the transition state. The Hammond postulate is used to help finding the transition state. According to the Hammond postulate[3], in an exothermic reaction, the transition state resembles the reactants and occurs in the entrance channel while in an endothermic reaction, the transition state resembles the products and occurs in the exit channel.
Transition state is the maximum on the minimum potential energy surface plot, therefore the point which is at maximum energy is the transition state as shown in Figure 7.
Figure 7: Transition State of F + H2 Reaction
Figure 8: Transition State Internuclear Distances vs Time Graph
The transition state is the stationary point between F-HH and FH-H and the point where the distance between three atoms are constant (i.e. the three atoms do not move). The transition state is approximated at
rHAHB = 0.74999 Å ; rFHA = 1.8099 Å
pHAHB = pFHA = 0
This approximation can be proved by Figure 8. The distances between the atoms stay roughly the same throughout the reaction.
Report the activation energy for both reactions.
Activation energy for both reactions can be calculated from the potential energy vs time graph as shown in Figure 9 and 10.
F + H2 reaction
With initial conditions:
rHAHB = 0.74999 Å ; rFHA = 1.8099 Å
pHAHB = pFHA = 0
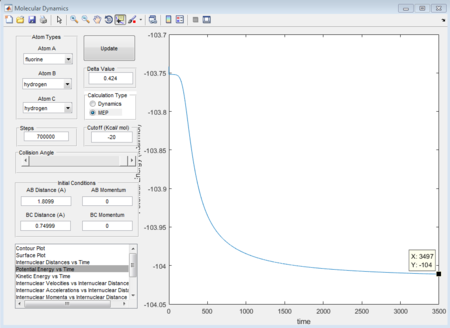
Figure 9: Potential Energy vs Time Graph of F + H2 Reaction
For the exothermic reaction,
Activation energy = -103.7 - (-104) = 0.3 kcal/mol
This is a reaction with low activation barrier.
H + HF reaction
With initial conditions:
rHAHB = 0.75049 Å ; rFHA = 1.8004 Å
pHAHB = pFHA = 0
Figure 10: Potential Energy vs Time Graph of H + HF Reaction
For the endothermic reaction,
Activation energy = -103.7 - (-134) = 30.3 kcal/mol
This is a reaction with high activation barrier.
As mention before, the activation barrier for an endothermic reaction is higher than that of an exothermic reaction. In this case, this is because the HF bond is much stronger than the HH bond, therefore in order to break the HF bond more energy is needed to be overcame.
Reaction dynamics
In light of the fact that energy is conserved, discuss the mechanism of release of the reaction energy. How could this be confirmed experimentally?
The reaction is carried out with initial conditions:
rHAHB = 0.74 Å ; rFHA = 2.30 Å
pHAHB = -2.70 ; pFHA = 0
Figure 10: Internuclear Distance vs Time Graph F + H2 Reaction
Figure 11: Internuclear Momenta vs Time Graph for F + H2 Reaction
From Figure 10 and 11, the reaction is shown to proceed via a 2-step mechanism and re-crossing the transition state region such that the reaction has two transition states at 0.74 and 1.17 time unit.
When F approaches HA-HB, the distance between F and HA decreases while the bond distance between HA and HB increases. Around the first transition state, HB approaches HA hence increasing the distance between F and HA again.
After the second transition state, F approaches the hydrogen molecule again and leads to the breakage of the HA-HB bond and form the F-H bond. The formation of the F-H bond will release heat energy since this is an exothermic reaction.
In this reaction potential energy is being converted into heat then vibrational energy, therefore calorimetry could be used to measure the temperature change of this reaction.
Explore pHH in the range -3 to 3
With initial conditions rHAHB = 0.74 Å, rFHA = 2.3 Å and pFHA = -0.5, trajectories are run with pHAHB in the range -3 to 3. Results are being shown in Table 2.
Table 2: Trajectories with pHAHB in the range -3 to 3
Reaction
pHAHB
Reactive?
Figure
1
-3
No
2
-2.5
No
3
-2
No
4
-1.5
No
5
-1
No
6
0
No
7
0.5
No
8
1.0
No
9
1.5
No
10
2.0
No
11
2.5
No
12
3
No
It can be seen from the table that all trajectories are not reactive. For reaction 1, 2, 10, 11 and 12, although they have sufficient energy to surmount the activation barrier, they re-cross the transition state region and cannot proceed to form the product.
Increasing pFHA momentum
With initial conditions
rHAHB = 0.74Å ; rFHA = 2.30Å
pHAHB = 0.1 ; pFHA = -0.8
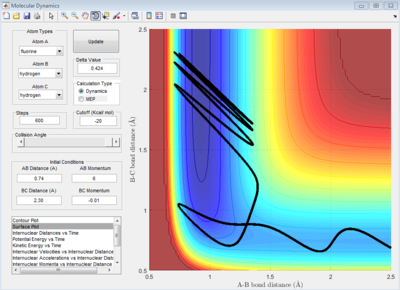
Figure 12: Surface Plot
Figure 13: Internuclear Momenta vs Time Graph
This trajectory is reactive. From Figure 12 and 13, the trajectory is shown to cross the transition state region for a few times. This reaction has enough energy to surmount the activation barrier and leads to the breaking of HA-HB bond and the formation of the F-HA bond.
Discuss how the distribution of energy between different modes (translation and vibration) affect the efficiency of the reaction, and how this is influenced by the position of the transition state.
The efficiency of the reaction can be explained by the Polanyi's empirical rules[4]. This rule state that vibrational energy is more efficient in promoting a late-barrier reaction (reaction with transition state resembling the products) than translational energy, whereas the reverse is true for an early-barrier reaction.
The reverse reaction, H + HF, is an endothermic reaction. Therefore it is a late-barrier reaction and the transition state resembles the products.
With initial conditions
rHAHB = 2.30 Å ; rFHA = 0.74 Å
pHAHB = -1 ; pFHA = 1
A non-reactive trajectory is shown on Figure 14.
Figure 14: A Trajectory with Low Vibration Mode on F-H Bond
The nature of this trajectory is low vibration and high translation because F-H bond has a low vibration mode. According to the Polanyi's empirical rules, this condition does not favor a late-barrier reaction, thus the reaction does not proceed to form the product.
With initial conditions
rHAHB = 2.30 Å ; rFHA = 0.74 Å
pHAHB = -0.01 ; pFHA = 6
Figure 15 showing a reactive trajectory.
Figure 15: A Trajectory with High Vibration Mode on F-H Bond
The nature of this trajectory is high vibration and low translation. According to the Polanyi's empirical rules, this condition favors the late-barrier reaction, therefore this reaction completes and is more efficient.
CONCLUSION
The total energy of the system consists of a translational and vibrational energy. Whether the reaction goes to completion depend not only on the total energy but also the way how the energy is distributed.
H + H2 system
There are three cases:
If the system has sufficient energies to surmount the activation barrier and the type of energy is in the product channel (i.e. product shows vibrational energy at large time t), the system is reactive.
If the system has sufficient energies to surmount the activation barrier but the type of energy is in the reactant channel (i.e. product shows translational energy at large time t), the system is unreactive. The product formed but dissociate back to reactant.
If the system does not have sufficient energy to surmount the activation barrier, it is unreactive.
Transition state theory assumes that once the system reaches the transition state, products can be generated. Most of the reactions tested support the transition state theory. However the theory has limitations as shown from reaction 4 and 5(Table 1), both reactions have sufficient energy to surmount the transition state, but only reaction 5 can proceed to form the product. This is because the theory fail to estimate the correct rate of the product generation since it does not account the dissociation of product and regeneration of reactant.
F-H-H system
Both the forward (F + H2) and reverse (H + HF) reactions proceed via a 2-step mechanism where two transition states are observed. The forward reaction is an exothermic reaction while the reverse reaction is endothermic.
According to the Hammond postulate, exothermic reaction has a transition state occurring in the entrance channel that resembles the reactants while the endothermic reaction has a transition state occurring in the exit channel that resembles the products.
The activation energy for F + H2 reaction is 0.3 kcal/mol while the activation energy for H +FH reaction is 30.3 kcal/mol. Activation energy for an endothermic reaction is a lot higher than that of an exothermic reaction. This is because H-F bond is stronger than H-H bond and in order to break the H-F bond more energy is needed to be overcame.
Distribution of energy between different modes (translational and vibrational) can affect the efficiency of the reaction and can be explained by the Polanyi's empirical rules. The rule states that vibrational energy is more efficient in promoting a late-barrier reaction (endothermic) than translational energy, while translational energy is more efficient in promoting an early-barrier reaction (exothermic).
REFERENCE
↑P. Atkins and J. de Paula, Atkins’ Physical Chemistry, Oxford University Press, Oxford UK, 7th edition, 2002.