MRD:vishalipala
Exercise 1: H + H2 system
Relating gradient of the PES to transition states and minima
The gradient of the potential energy surface, given by its first derivative, is zero at both the minimum and transition state. We identify each of these by considering the second derivative. Along the reaction trajectory, there is a maximum in the potential energy surface at the transition state. If we then view the surface in a direction orthogonal to the reaction pathway, there will be a minimum. This describes a saddle point and we identify this as our transition state.
This is the basis of calculating a second derivative. For a transition state, if we calculate the second derivative, it will have a negative value along the reaction coordinate, and a positive value orthogonal to the reaction coordinate. In contrast, the minimum has a positive second derivative along both the reaction coordinate and orthogonal to it.
Mm10114 (talk) 16:47, 7 June 2018 (BST) Very good answer!
Locating the transition state
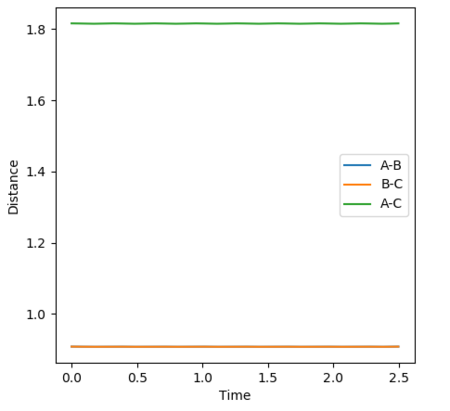
At the transition state, since the H + H2 system is symmetric, r1must equal r2. The momentum is also zero as the atoms are not moving. By varying these distances, the transition state has been identified as occurring at a H-H distance of 0.908 Angstroms. This is indicated in the plot of inter-nuclear distance vs time. The A-B and B-C distances are 0.908 Angstroms and therefore the A-C distance is double this. Over time, this distance remains constant. This can be compared to if the curve was fluctuating, indicating vibrations of the bond. At the transition state, there is no oscillation of the graph. The contour plot also depicts the position of the transition state.
Mm10114 (talk) 16:48, 7 June 2018 (BST) Well done.
Calculating the reaction path
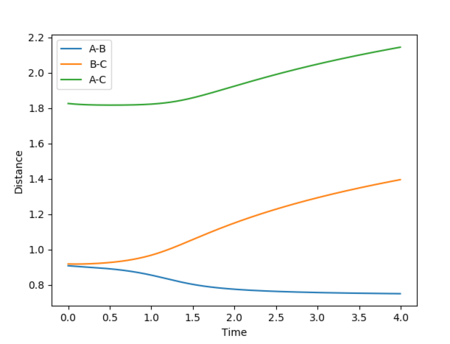
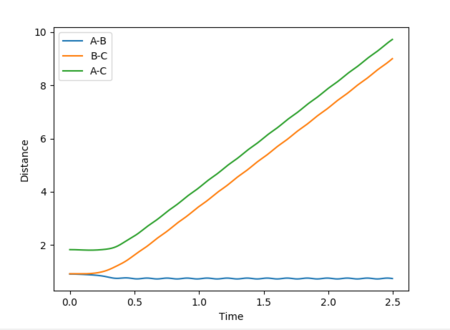
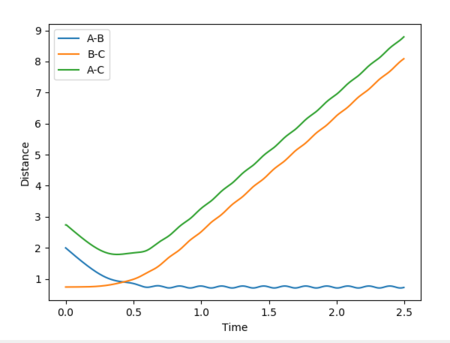
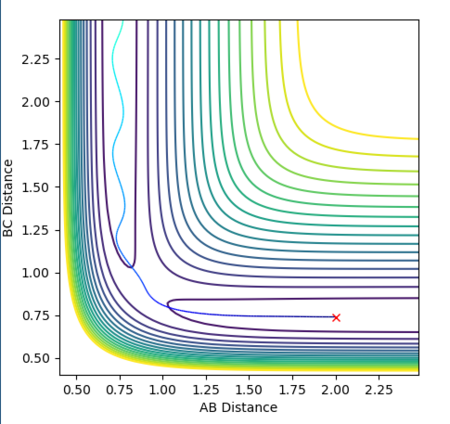
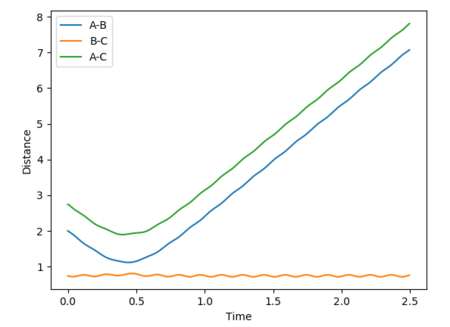
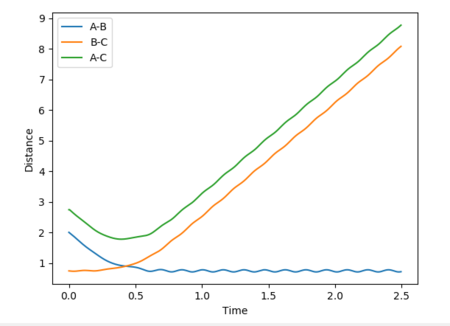
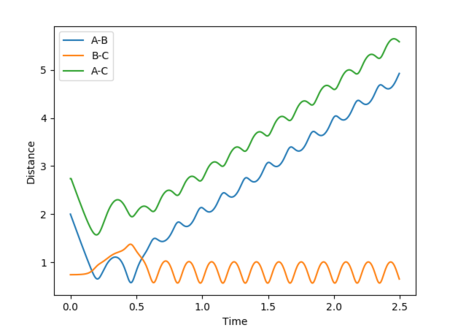
Below are plots of internuclear distance vs time for calculations run on MEP and dynamics. A reverse dynamics trajectory is also calculated.
Swapping the initial conditions i.e. r1 = rts and r2 = rts +0.01 makes no difference to the plot. The labels for the curves have just changed.
Mm10114 (talk) 16:55, 7 June 2018 (BST) Are you sure this changes nothing? You make a good observation here "The labels for the curves have just changed." Yes, the plots will be same as this is a symmetrical system, but wouldn't one scenario (r1>r2 for example) push reaction forward towards products, but the opposite scenario (r2>r1) push reaction backwards towards reactants from the transition state?
Reactive and unreactive trajectories
Mm10114 (talk) 16:56, 7 June 2018 (BST) Good. However, are you sure energies in all cases should be exactly the same? (There was an 'update' button that was supposed to be used each time you calculate new trajectory)
Transition State Theory
In transition state theory, the pathway from reactants to products involves a transition state which is the highest energy coordinate on the energy profile. It is based on several ideas and assumptions:
• There is a quasi-equilibrium that exists between reactants and the activated complex. This occurs even when the reactants are not in equilibrium with the products.1 For the reaction: A + BC → AB + C, we can write this as:
A + BC ⇄ ABC≠ → AB + C
• The motion of electrons is described quantum mechanically. However, we can treat the nuclear motion separately in terms of classical mechanics. In other words, the Born-Oppenheimer approximation is used.2
• Energies of the reactants are distributed according to the Boltzmann Distribution. This assumption is true at thermal equilibrium.
•If reactants are able to form an activated complex, i.e. reach the transition state, this will lead to product formation.2
All assumptions in transition state theory are not correct. For example, transition state theory would predict that if the transition state is reached, the product will be formed. The rate of formation of product depends on the rate at which the activated complex is formed. It does not take into account barrier recrossing which can lead back to reactants. This is seen in contour plot 4. In the theory however, the activated complex and products are said not to be in equilibrium with each other. Therefore the rate of reaction predicted from transition state theory will be higher than obtained experimentally.
Furthermore, quantum mechanical tunneling is not taken into account. This involves reactants tunneling through the barrier rather than crossing over it.
Mm10114 (talk) 16:56, 7 June 2018 (BST) Well done.
Exercise 2: F-H-H system
Exothermic vs Endothermic Reactions
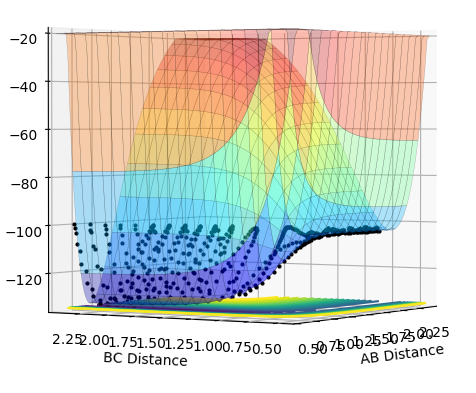
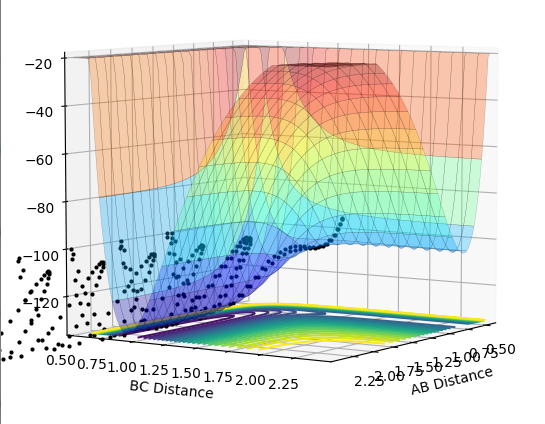
Below are potential energy surfaces for the reaction between H2 and F in the forward direction and the reverse formation of H2.
Locating the position of the transition state
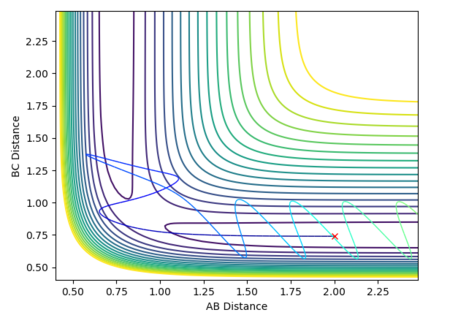
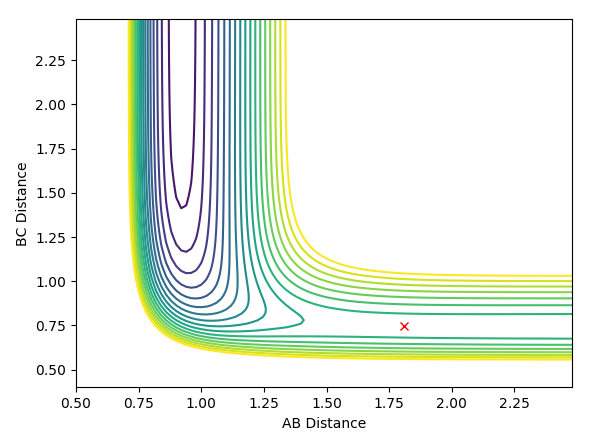
Previously, for the H2 + H system, the idea that r1 = r2 was used based on the symmetry of the transition state. This no longer applies for this system. Instead, Hammond's postulate is used to locate the position of the transition state. Transition states are energy maxima and therefore transient with no measurable lifetime. We can approximate the transition state by studying species that are close in energy to it, as these are expected to be structurally similar. Studying the forward exothermic reaction, we expect an early transition state - one that resembles reactants more closely than products. Therefore r1 (BC) was initially set to 0.74 Angstroms. AB was then varied and the contour plot was examined. Trial and error was used to find the transition state as the position at which there is no trajectory. This is shown in the figure below. The H-H and H-F bond lengths at the transition state were found to be 0.7451 and 1.81065 Angstroms respectively.
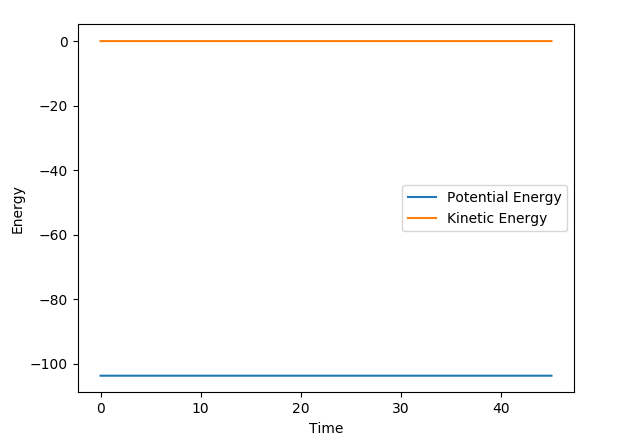
A plot of energy vs time at the transition state is also shown. The potential energy remains constant throughout.
Activation energies
The activation energy was found for both the forward and reverse reaction. Since the activation energy represents the energy difference between the transition state and the reactants, it is possible to calculate it by moving slightly away from the transition state, towards the reactants. Then the difference between the starting and final energy can be found. The results are summarized in the tables below. The main finding was that the activation energies are not the same - the reverse endothermic reaction forming H2 has a higher activation energy than the forward reaction forming HF.
| Calculation type | MEP |
| Number of steps | 11,000 |
| AB distance | 1.750 |
| BC distance | 0.7451 |
| TS Energy | -103.761 kcal mol-1 |
| HF Energy | -133.684 kcal mol-1 |
| Activation energy for HF + H | + 30.1 kcal mol-1 |
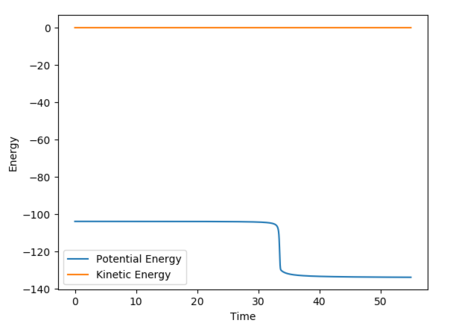
The following energy vs time plot represents the trajectory from the transition state to HF + H i.e. the transition state rolls back to the reactant state.
| Calculation type | MEP |
| Number of steps | 11,000 |
| AB distance | 1.950 |
| BC distance | 0.7451 |
| TS Energy | -103.761 kcal mol-1 |
| H2 energy | -103.817 kcal mol-1 |
| Activation energy for H2 + F | + 0.056 kcal mol-1 |
Since the activation energy for the forward exothermic reaction is so small, a distance vs time plot has not been included.
Reaction Dynamics
Reactive trajectory
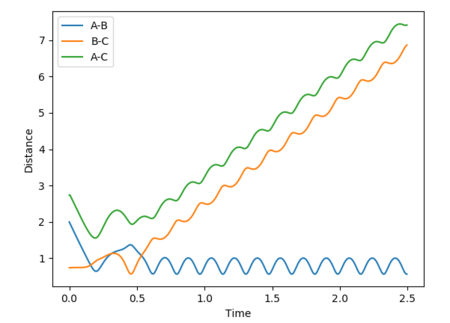
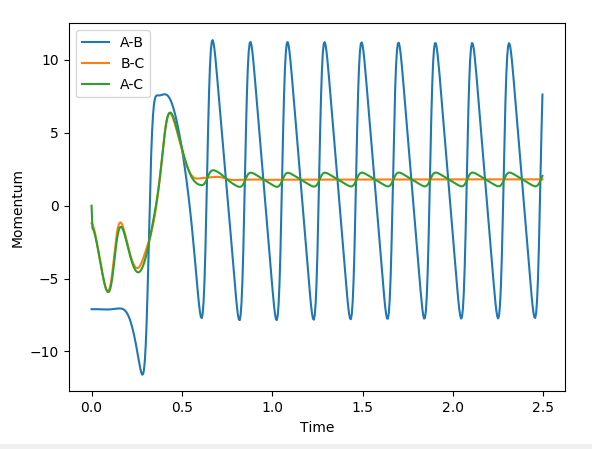
A reactive trajectory was identified with the following initial conditions for H2 + F: r1 = 0.75 Angstroms, r2 = 2.3 Angstroms, p1= -1.2, p2= -7.1.
This is an exothermic reaction. However the law of conservation of energy states that energy cannot be created or destroyed, only transformed from one form to another. It is possible to understand where this excess energy has ended up by studying the inter-nuclear momenta vs time plot shown below. The AB product shows very large oscillations in momentum between positive and negative values. Negative values correspond to the nuclei moving towards each other, and positive momenta corresponds to the nuclei moving away from each other. The large oscillation between the two therefore represents vibrations of the bond i.e. the excess energy is converted into the vibrational energy of the product. This can be confirmed experimentally by calorimetry which measures a change in temperature in order to indicate the enthalpy change.
Application of Polanyi's Rules
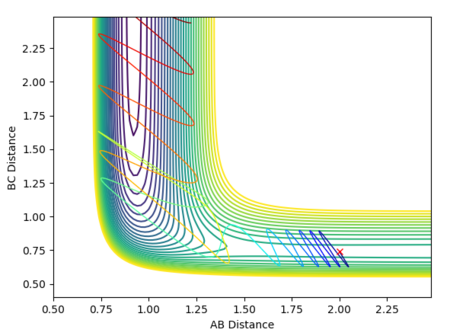
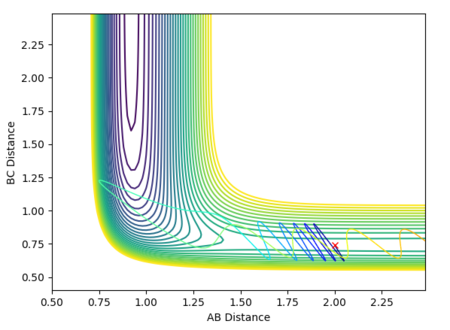
Reactions were set up on the reactant side of H2 + F and the momentum pHH was varied. Control variables are summarized in the table below.
| Calculation type | Dynamics |
| Number of steps | 500 |
| AB Distance | 2 Angstroms |
| BC Distance | 0.74 Angstroms |
| AB Momentum | -0.5 |
Polanyi's rules state that vibrational energy (p1) is of importance in promoting a reaction with a late transition state. On the other hand, translational energy (p2) is important in promoting a reaction with an early transition state.3 The forward reaction is exothermic with a early transition state. It is expected that if a large amount of translational energy is put into the system, the reaction will be successful.
Next, the vibrational energy was reduced by changing pHH to 0.1. The translational energy was increased by changing pHF to -0.8. The reaction now occurs and obeys Polanyi's rules.
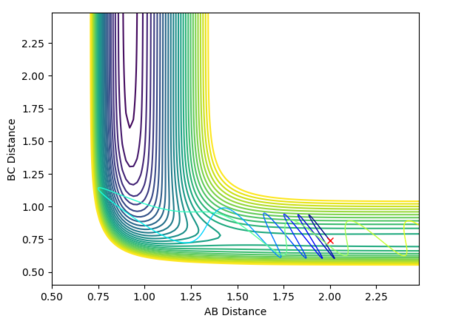
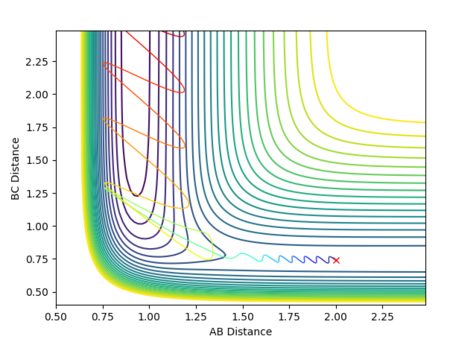
The same analysis was repeated for HF + H. Since this has a late transition state, we expect the opposite effect to above. This has been tested below.
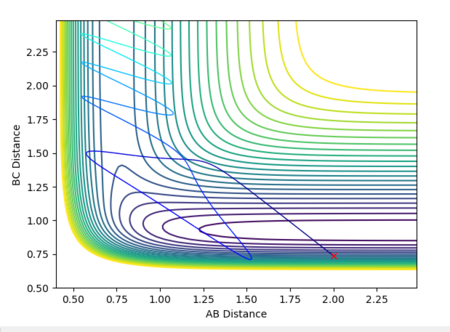
First, the calculation was carried out with low vibrational energy, p1 = 0.1 and high translational energy, p2 = -3. The reaction was not successful. This was then repeated with p1 = 6 and p2 = -0.1 i.e. the vibrational energy was increased and the translational energy was decreased. This led to a reaction. Both contour plots are shown below.
| Low 1, High p2 | High p1, Low p2 |
|---|---|
 |
|
References
1. K. J. Laidler and M. Christine King, J.Phys. Chem., 1983, 87, 2657-2664.
2. T. Bligaard, J.K. Nørskov, in Chemical Bonding at Surfaces and Interfaces, 2008
3. Z. Zhang, Y. Zhou and D. H. Zhang, J. Phys. Chem. Lett., 2012, 3(23), 3416-3419

