MRD:tyy15bryanyick
Molecular Reaction Dynamics
EXERCISE 1: H + H2 system
What value does the total gradient of the potential energy surface have at a minimum and at a transition structure? Briefly explain how minima and transition structures can be distinguished using the curvature of the potential energy surface.
The total gradient of the potential energy surface at a minimum and at a transition structure must be zero as it must be at a maxima or a minima. The transition state can be found on the saddle point, where it is the stationary point for both r1 and r2.
By using the second derivative of the function, one can characterize the minima and transition state. When the second derivative is greater than 0 (i.e. positive), this will mean that it is a minima. When the second derivative is less than 0 (i.e. negative), this will imply that the point is a maxima. Transition state will lie on the maximum of the minimum potential energy surface.
Transition State Position (rts)
rts = 0.90775

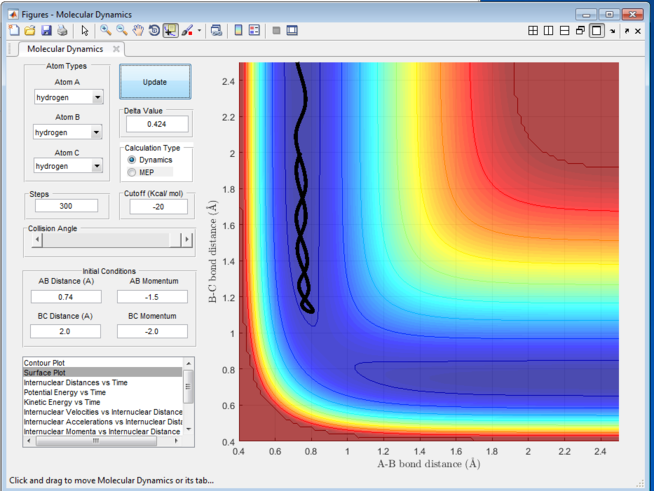
Figure 1 shows a rough estimation of the transition state intermolecular bond distance. By setting up the initial conditions for the reaction as r1 = 0.74, r2 = 2.3, p1=0, p2=-2.7, we can have a rough estimation as per where the transition state is. The transition state is the maximum of the minimum energy path link the reactants and the products as described above. The transition state will therefore be at the point which the A-B bond length equals the B-C bond length in the Intermolecular distance vs time graph. This implies a stationary point at which there are no interaction between the three atoms and hence there will not be any movement of the atoms at that transition state distance if no momenta was given. A rough estimation ca be seen that at t = 0.38s, the two curves crosses and therefore it gives a rough rts = 0.9148
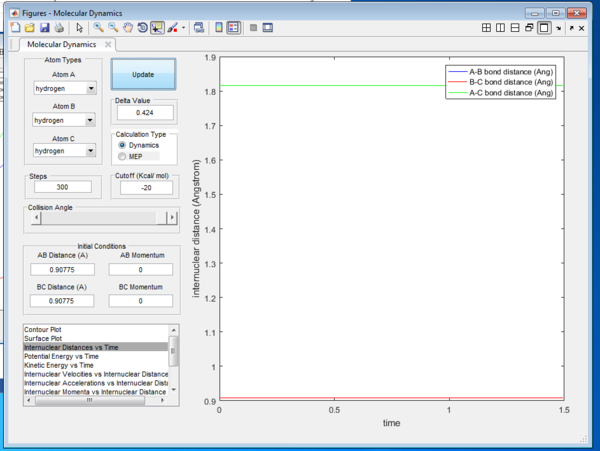
By looking at the animation generated by that interaction, one can deduce that the true transition state position is found to be 0.90775 Å. This can be confirmed by looking at the Intermolecular Distance vs Time Graph in Figure 2. At transition state, the two distance A-B and B-C will be the same throughout and hence the A-C bond distance will be the same.
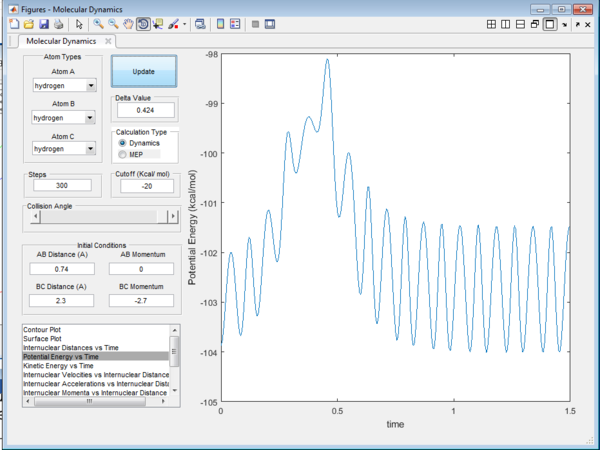

The Potential Energy vs Time plot (Figure 3) and the Kinetic Energy (Figure 4) vs Time plot using the initial conditions further confirms that the transition state distance at ≈ 0.38s. The Potential energy will be at its maximum and and the kinetic energy will be at its minimum at the transition state. This will lead to a stationary point for the reaction.
Comment on how the mep and the trajectory you just calculated differ.
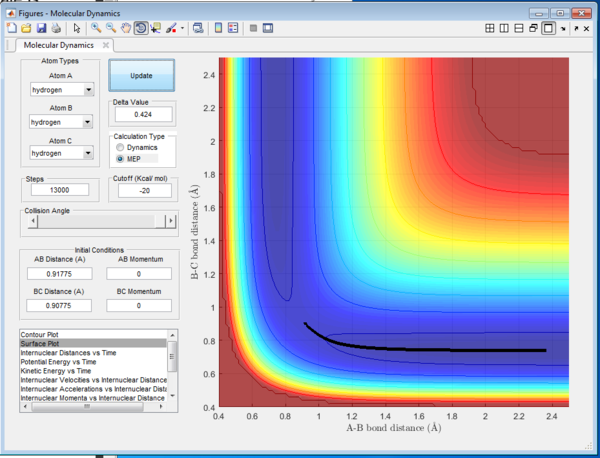

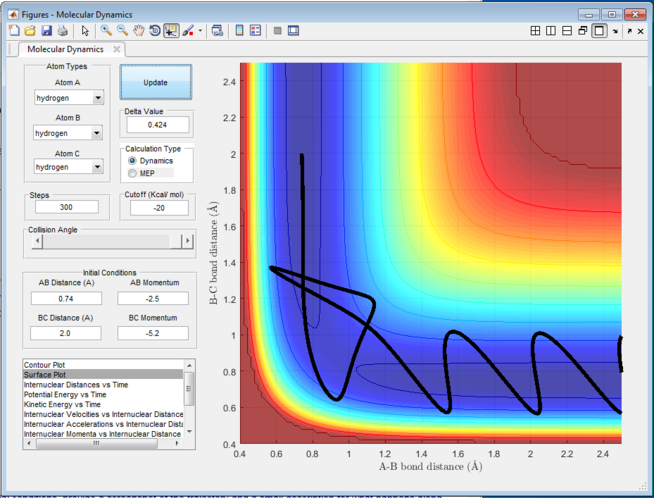
Figure 5 shows the trajectory for r1 = rts+0.01, r2 = rts and the momenta p1 = p2 = 0. The MEP calculation represents the minimum energy path and the nature of the path is therefore a straight line. The trajectory of the reaction follows a straight line and travels along the bottom of the potential. Hence, it will have the minimum energy and will not travel on the either side of the valley of the potential well. Comparing this to the calculation that was done previously as the Dynamic calculation, the Dynamic calculation will give the trajectory as shown in Figure 6. It can be seen that the route of trajectory is longer and it has taken into account of the vibrational energy of the molecule. This therefore gives the wavey nature of the trajectory and will possess higher energy hence able to travel on either side of the potential valley. The MEP calculation is able to give the lowest energy reaction path due to its nature of calculation, at which the velocity always reset to zero at each time step so the trajectory is happening in an infinitesimally small motion. For both of the reaction, the reaction would happen such that the bond distance between A-B increases since the initial A-B distance is slightly larger than the B-C distance.
Positions and average at large T
r1= 0.7456
r2=5.281
p1=1.547
p2=2.481
What would change if we used the initial conditions r1 = rts and r2 = rts+0.01 instead?
Exactly the same thing would happen but this time the reaction path would travel in the other exit channel. In other words, this would increase the bond distance between B-C.
Setup a calculation where the initial positions correspond to the final positions of the trajectory you calculated above, the same final momenta values but with their signs reversed. What do you observe?
You would observe that the trajectory heads towards the opposite direction, going from the previously exit to the start of the previous reaction. This is because the momenta has reversed hence it the opposite direction would happen.
Reactive and unreactive trajectories
For the initial positions r1 = 0.74 and r2 = 2.0, run trajectories with the following momenta combination:
State what are the main assumptions of Transition State Theory. Given the results you have obtained, how will Transition State Theory predictions for reaction rate values compare with experimental values?
The main assumptions of Transition State Theory is that once the system with sufficient energy has reached the transition state, it goes on to produce product. However, basing on the results from example no.4 above, we can conclude that it is not the case. The main assumption fails for certain cases and the transition state theory overestimate the reaction rate. This is because even though the reaction has enough energy to go through the activation barrier of transition state, it still needs to have the right vibrational modes as it crosses the transitional state in order for the reaction to occur. If the incoming molecule has too much energy, the excess energy will just let the go backwards and reaction would not occur. Reaction would only be made feasible if the energy that's provided by the initial 'hit' by the incoming particle is just enough to get it to the minimum of the potential energy curve.
EXERCISE 2: F - H - H system
Classify the F + H2 and H + HF reactions according to their energetics (endothermic or exothermic). How does this relate to the bond strength of the chemical species involved?
F + H2 Reaction
The surface plot of F + H2 was plotted. As can be seen from the Figure 7, there is a the reaction runs from the left hand side of the plot to the right hand side. The potential energy of the reactant is much higher than the potential energy of the product. The difference of the energy is around 30 kcal/ mol. The lowering of the energy for HF bond as compared to HH bond is due to the fact that HF bond is much stronger than HH bond. Hence, the exit channel, (i.e. the product channel) will have a much lower energy and we would determine that this reaction is highly exothermic. There is an energy released when the reactants are converted to product.
H + HF Reaction
The surface plot of H + HF was also plotted on Figure 8. The reaction again runs from left hand side of plot to the right hand side. The potential energy of the reactant is much lower than the product. This can be used to suggest that the energy of the reactant are much lower because of the stronger bond strength between HF. The energy barrier ( i.e. the activation energy) that is needed will be a lot higher than the previous example. The product of this reaction is in a higher energy hence its thermodynamically less stable. The exit channel will have a much higher energy and therefore we would determine this reaction as highly endothermic. There is an energy absorbed when the reactants are converted to product.
Locate the approximate position of the transition state.

The transition state of the reaction can be found be by examining the point which it is at its maximum activation energy in Figure 9. The transition state is the maximum on the minimum potential energy surface plot. As the such barrier is so small that we cannot locate it precisely with just close inspection. We can, however, use Hammond's Postulate to estimate at the location of the transition state. Since the reaction is exothermic, we would expect that the transition state would be in close resemblance to the reactants. This will mean that the transition state will occur in the entrance channel and has a similar structure as the reactant and will not be at the exit channel where it resembles the product as there is a larger energy difference.
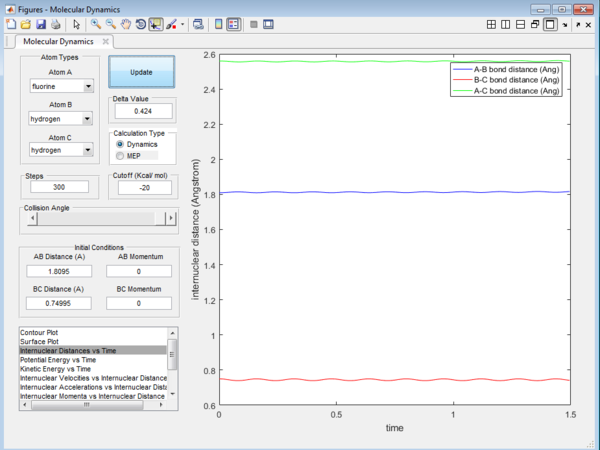
We can approximate that the transition state is at r1 (F-H2) = 1.80950 and r2 (FH-H) = 0.74995. We can determine that this point asthe transition state as it is the (nearly) stationary point between F-HH and FH-H. This point is determined by letting the momenta p1 and p2 are at 0. The transition state will be the point at which the distance between the 3 atoms stay constant and will not move. This is proven by Figure 10 below and it shows that the distance AB(F-HH) and BC(FH-H) stays (roughly) constant throughout the course of the reaction. Therefore these distances will be the saddle point at which it is at the maximum of the minimum potential energy surface plot.
Report the activation energy for both reactions.
Activation Energy of F + HH

Activation Energy will be 0.2 kcal / mol for this exothermic reaction. It shows a low energy barrier.
Activation Energy of H + FH

Activation Energy will be 30.2 kcal/mol for this endothermic reaction. It shows a high energy barrier.
It is in coherence with our previous theory, such that the activation barrier for an endothermic reaction will be greater than for exothermic reaction.
In light of the fact that energy is conserved, discuss the mechanism of release of the reaction energy. How could this be confirmed experimentally?
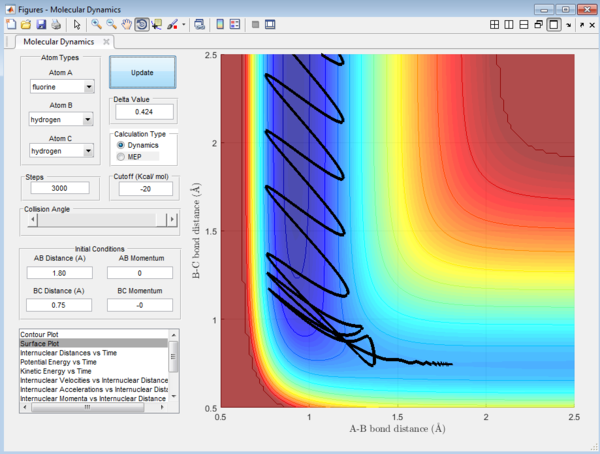
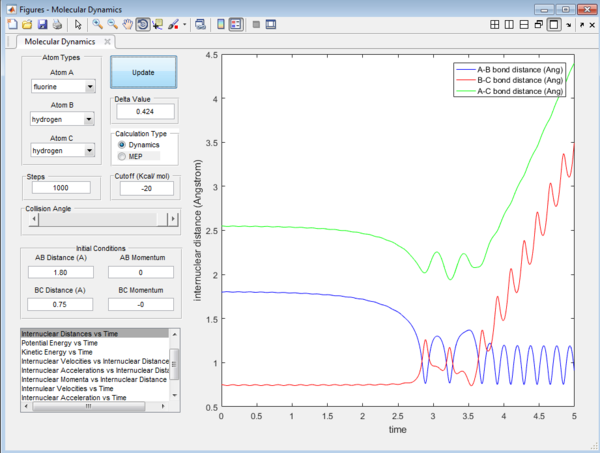
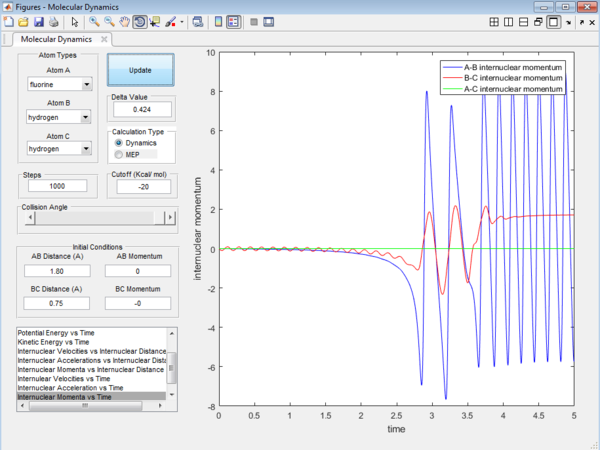
We would focus on the reaction of F + HH. The reaction is arranged such that the initial condition of the reaction is set as the equilibrium distance between the 3 atoms. Even though the initial momenta is set to be 0 for both p1 and p2, the reaction will still be taken place as there is a large stabilization when the HF product is formed. HF bond will have extra stabilization since the HF bond is much stronger than the HH bond. There will be a release of heat energy when the the HF bond is formed since the reaction is exothermic in nature.The release in exothermic energy can be seen by examining Figure 13 , by looking at the internuclear momenta vs time plot in Figure 14. This plot explains that this reaction proceed via a 2 step mechanism and will have two transition state. as F approaches Hb, AB bond distance decrease and the BC bond increase slightly. After HbHc bond has increased to a maximum, it bounces back again and the distance decreases. The distance of HF increases again, which forms the second transition state. After this second transition state, the bond is finally dissociated and the HF bond remains in constant distances with slight vibration energy. The distance between Hb and Hc will continue to increase.
We can use calorimetry to confirm the temperature change of this reaction since the potential energy is conserved and is dissipated as heat to vibrational energy during the course of the reaction.
Discuss how the distribution of energy between different modes (translation and vibration) affect the efficiency of the reaction, and how this is influenced by the position of the transition state.
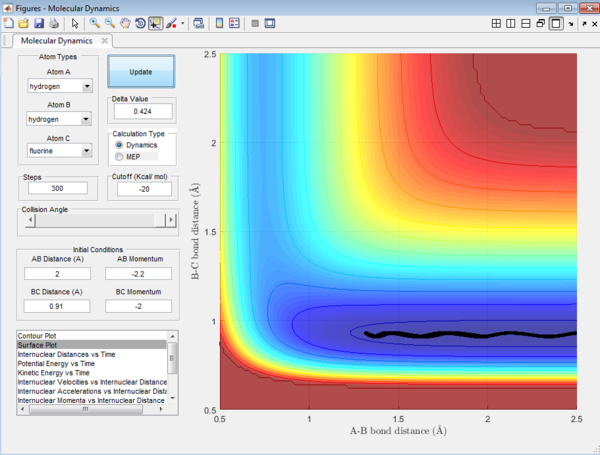
Figure 16 shows a trajectory with a low vibrational motion of the H-F bond and the momentum of HH (Phh) is high and above the activation energy. The conditions are as follows:
rHH = 2
rHF = 0.91
pHH = -2.2
pHF = -2

Figure 17 shows a trajectory which is reactive. The momentum of the incoming H atom is decreasing and the HF vibration is increasing. The conditions are as follows:
rHH = 2
rHF = 0.91
pHH = 0.9
pHF = -8.5
As can be seen from Figure 17, we can see that the HF bond has a higher vibrational motion.
This phenomena can be explained by the Polanyi's empirical rules. The rule states that a higher vibrational level will be more efficient in promoting a late barrier reaction than transnational energy. We can also determine that the h + HF reaction is an endothermic reaction with a late energy barrier. Figure 16 shows an example of a non reactive trajectory. The nature of this trajectory is low vibrational and high translational. The incoming H atom has a high translatoinal energy but the HF has a low vibrational mode. This in turns makes the momenta pHH and pHF cancels out and therefore making the overall reaction non reactive. Figure 17 shows an example of a reactive trajectory. The nature of this trajectory is high vibrational and low translational. Although momentum of HH is very small , the momentum of HF is large, leading to an overall reactive trajectory. All in all, this proves that the Polayi's emperical rule is valid and that a high vibrational energy is more efficient in promoting a late barrier reaction than translational energy. The opposite would happen to an exothermic reaction where it can be classes as a early barrier reaction.


