MRD:tts16
Introduction to Molecular Reaction Dynamics
For a chemical reaction to occur, reactants much have sufficient energy to overcome its activation barrier as well as be in the right vibrational modes at the right time. Consequently, it is possible for a reactant trajectories crossing its energy barrier to form the product, yet fall back and result back to the starting reactants. During this process, energy is exchanged between translation and vibration energies.
Exercise 1ː H + H2 system
Dynamics from the Transition State Region
What value do the different components of the gradient of the potential energy surface have at a minimum and at a transition structure? Briefly explain how minima and transition structures can be distinguished using the curvature of the potential energy surface.
Given that the two axes represent the distance of r1 (distance of H1—H2) and r2 (distance of H2—H3), the gradient (first derivative) of the potential energy with respect to the atomic distances would be zero at either a maxima or minima of the surface as these are stationary points. Maxima in energy would indicate a transition state, while minima indicates equilibrium bond distances. However, to distinguish between maxima and minima, the second derivative (∂2V/∂r12 and ∂2V/∂r22) must be considered: when ∂2V/∂r1 and ∂2V/∂r22 > 0 a minima is obtained, while when ∂2V/∂r12 > 0, and ∂2V/∂r22 < 0, a maximum (transition state) will be obtained.
Mm10114 (talk) 18:26, 7 June 2018 (BST) Are you sure the maxima in energy indicate a transition state? (Maxima is plural, maximum is singular). I think I know what you mean by that, a maximum along the minimum energy pathway for the reaction, however, you have to be very careful how you explain things. This is not clear enough.
Trajectories from r1 = r2ː locating the transition state
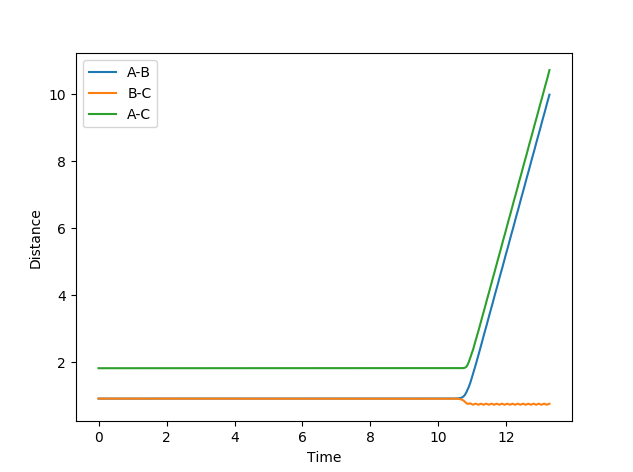
Report your best estimate of the transition state position (rts) and explain your reasoning illustrating it with a “Internuclear Distances vs Time” plot for a relevant trajectory.
By manipulating and evaluating different distance values for the transition state, my best estimate of the transition state position resulted to have a distance of 0.90780 Å. Looking at the inter-nuclear distances versus time graph, there is virtually no change in atomic distance for approximately 11 time periods before a steep change to form AB. This distance represented a transition state that had a considerably long time period (2654 steps) without oscillations, and was obtained through trial and error between high and low values, which eventually converged to this distance.
Trajectories from r1 = rts +∂, r2=rts
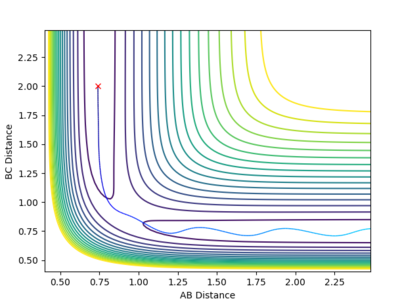
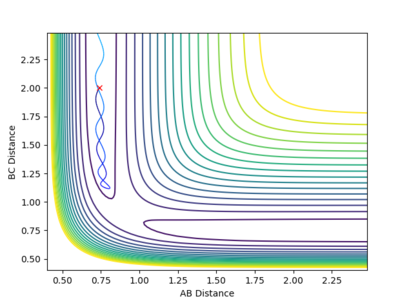
Comment on how the mep and the trajectory you just calculated differ.
It is evident that in the MEP figure, there is a smooth curve while the dynamic calculation shows an oscillating signal. This is due to the nature of the MEP calculation, where at all points (infinitesimal changes of distance) the velocity is set to zero and is absent of vibrations. By contrast, dynamic calculations do not manipulate the velocity, thus giving a more realistic portrayal of bond formation where oscillations are still present due to the element of momenta.
| MEP Contour | Dynamics Contour |
|---|---|
 |

|
Reactive and Nonreactive Trajectories
Complete the table by adding a column with the total energy, and another column reporting if the trajectory is reactive or unreactive. For each set of initial conditions, provide a plot of the trajectory and a small description for what happens along the trajectory.
Mm10114 (talk) 18:23, 7 June 2018 (BST) Are you sure the total energy should be the same in every case? (there was a special 'update' button in the software, that would have to be clicked each time to update the energy values) Also, what is the unit of energy here?
State what are the main assumptions of Transition State Theory. Given the results you have obtained, how will Transition State Theory predictions for reaction rate values compare with experimental values? [1][2]
Below are the main assumptions of transition state theory.
1. There exists a divided in potential energy surface separating reactant and product regions, and the transition state is defined as the highest value on the lowest energy path connecting reactants and products.
2. Any trajectory that passes through the transition state will form the product, and will not re-cross to give the reactant.
3. Born-Oppenheimer approximation is invoked, separating the electrons and nuclei: motion can be treated classically.
4. The reactants are distributed amount their states according to the Maxwell-Boltzmann distribution
Transition state theory provides a good model for reactions with high energy barrier where once the reactant has enough activation energy to overcome the transition state, it will not re-cross the barrier. However, in the examples that were speculated, situation 4 and 5 both cross the transition state, re-cross it, then ends up with one stabilizing back to the reactant while one crosses the transition state barrier again and ends up as product BC. Consequently, for systems with high energy collisions and low energy barriers, transition state theory may not yield an accurate depiction of reality. Moreover, as transition state theory treats the system classically, it ignores the possibility of quantum tunneling which would allow product formation that do not conform to transition state theory assumptions.
Mm10114 (talk) 18:29, 7 June 2018 (BST) Well done here. You relate to the examples from previous point, I like that.
Exercise 2ː F - H - H system
PES Inspection
Classify the F + H2 and H + HF reactions according to their energetics (endothermic or exothermic). How does this relate to the bond strength of the chemical species involved?
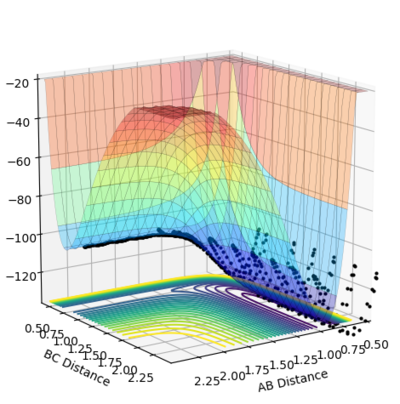
Looking at the figure below of F + H2 --> H + HF, it is seen from the potential energy surface that the reactants are of higher energy relative to the products hence it is an exothermic reaction. By tabulating energy changes through energetics, the H-H bond (436 kJ/mol) is broken to form a stronger HF bond (565 kJ/mol), thus forming bonds release more energy than making the bond, agreeing with the computational outcome as an exothermic reaction.[3] On the other hand, HF + H --> H2 + F is an endothermic reaction as the opposite is demonstrated by the potential energy surfaces.
| H2 + F Contour | H + HF Contour |
|---|---|
 |

|
Locate the approximate position of the transition state.
By manipulating and evaluating different distances for the transition state, my best estimate of the transition state positions resulted to have AB = 1.8900 Å, BC = 0.7445 Å distances and momenta set to zero for both. Looking at the inter-nuclear distance versus time graph, there is virtually no change in atomic distance for approximately 17 time periods before any deviation. This distance represented a transition state that had a considerably long time period (3411 steps) without oscillations and was obtained through trial and error between high and low values, which eventually converged to this distance.
Report the activation energy for both reactions.
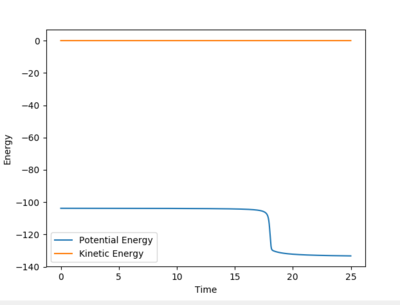
To find the reactant energies, the distance of A-B was manipulated slightly, such that the F-H-H transition state would not be in its saddle point and fall to its reactants to determine the reactant energy. A energy vs. time graph was then plotted, indicating a reactant energy of -103.496 kcal/mol, and a product energy of -132.963 kcal/mol. The activation energy of a reaction can be calculated by finding the difference between the energy at its starting state and the transition state. From above, it was found that the energy of the transition state was -103.869 kcal/mol. Consequently, the activation energy for F + H2 is 0.127 kcal/mol, while the reverse reaction H + HF has an activation energy of 29.094 kcal/mol.
EA = ETS - Ereactants
HF + H
EA = -103.869 - (-103.996)
EA = 0.127 kcal/mol
H2 + F
EA = -103.869 - (-132.963)
EA = 29.094 kcal/mol
Reaction Dynamics
In light of the fact that energy is conserved, discuss the mechanism of release of the reaction energy. How could this be confirmed experimentally?
| Dynamic Contour | Energy vs Time |
|---|---|
 |
|
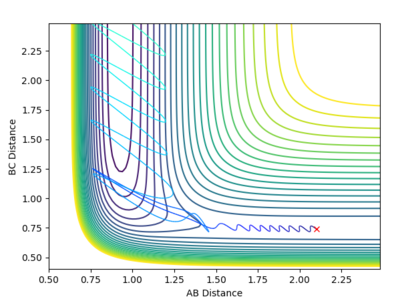
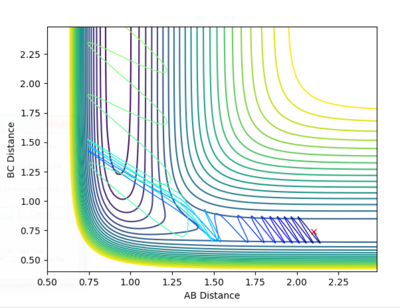
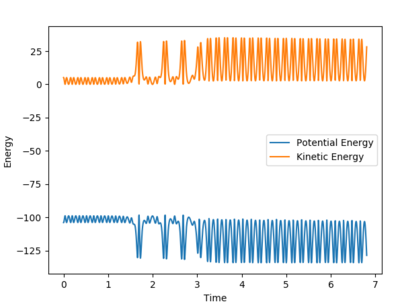
From the contour plot, it is seen that the reaction hovers over the transition state multiple times going from reactants to products back to reactants and finally results in the products. This is also shown through the energy versus time graph, where kinetic energy dramatically increases then decreases as the system goes through its transition state, while the potential energy decreases and increases as it mirrors the change in kinetic energy. In this exothermic reaction of F + H2 (discussed earlier), potential energy is converted to (kinetic) vibrational energy as it goes through its transition state. Consequently, to experimentally measure this, calorimetry techniques can determine the amount of energy released from this exothermic reaction.
Discuss how the distribution of energy between different modes (translation and vibration) affect the efficiency of the reaction, and how this is influenced by the position of the transition state.
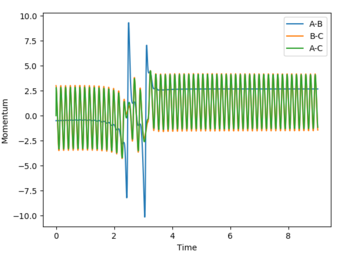
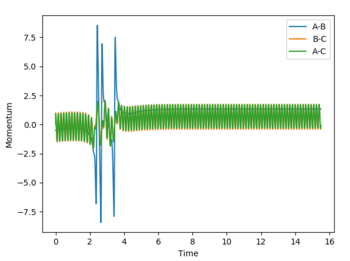
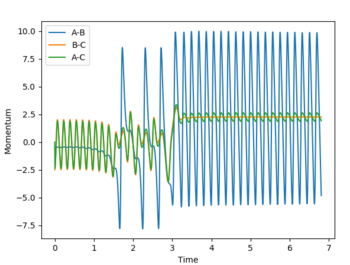
Polanyi’s empirical rules state that vibrational energy is more efficient in driving a system with a late transition state than translational energy, and vice versa for a system with an early transition state.[4] Transition states are a maximum in a reaction profile and cannot be captured or isolated. Consequently, Hammond’s postulate is used to determine what the transition state resembles, by stating that the transition state of a reaction is similar to either the reactants or products — whichever that is closer in energy. Consequently, an endothermic reaction has a later transition state, while an exothermic reaction has an early transition state. Below are plots that show systems with varying PHH between 3 and -3.
| Momentum Values | Dynamic Contour | Momentum vs Time |
|---|---|---|
| pHH = 0 |  |

|
| pHH = 3 | 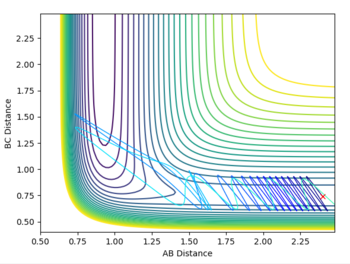 |
|
| pHH = 1 | 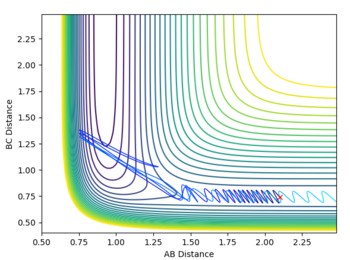 |
|
| pHH = -2.5 | 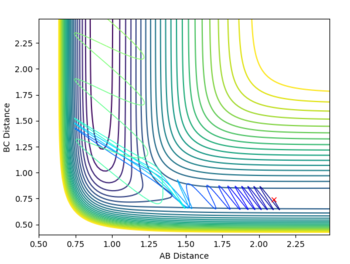 |
|
| pHH = 3 |  |

|
According to Polanyi’s empirical rules, exothermic reactions are more likely to be successful if there is high translational energy relative to vibrational energy. In the plot below, PHF is set to -0.8, while PHH is set to 0.1. A successful reaction carries out, reflecting Polanyi’s rules. In the fourth row of the table above with PHH at -2.5, the reaction was still successful, meaning even though Polanyi's empirical rules lay out a general way of predicting reaction success, it is possible that high enough ranges of vibrational energy can drive the reaction over the transition state to its product.
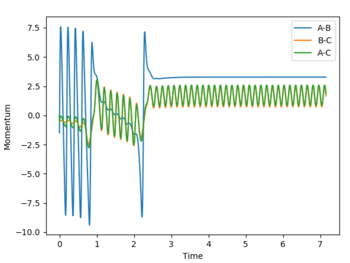
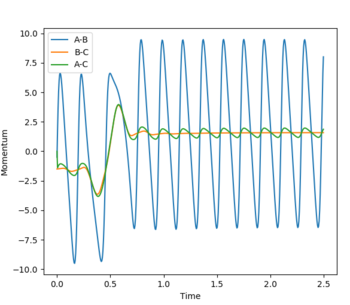
To consider the reverse reaction H + HF, HF was set to 0.74 Å, , and F H was set to 2.1 Å. As the reaction is an endothermic reaction, a high vibrational energy should lead to a successful reaction. Below are plots of a system with high and a system with low vibrational energy, and it is seen that in the system with high vibrational energy, the reaction is successful following Polanyi’s empirical rules.
| pHH | pHF | Dynamic Contour | Energy vs Time |
|---|---|---|---|
| pHH = -0.5 | pHF = -1.5 |  |
|
| pHH = -1.5 | pHF = -0.5 |  |
|
References
1. Felipe, M., Xiao, Y. & Kubicki, J. D. Molecular Orbital Modeling and Transition State Theory in Geochemistry. Rev. Mineral. Geochemistry 2001
2. Gonzalez_lafont, A., Villa, J., Lluch, J. M. & Juan, B. Variational Transition State Theory and Tunneling Calculations with Reorientation of the Generalized Transition States for Methyl Cation Transfer. J. Phys. Chem. A 3420–3428 (1998).
3. Texas, U. of. Bond Enthalpies. (2014). Available at: https://ch301.cm.utexas.edu/section2.php?target=thermo/thermochemistry/enthalpy-bonds.html.
4. Zhang, Z., Zhou, Y. & Zhang, D. Theoretical Study of the Validity of the Polanyi Rules for the Late-Barrier Cl + CHD3 Reaction. J. Phys. Chem. A 3, 3416–3419 (2012).

