MRD:tsa116
Exercise 1
Defining the Transition State
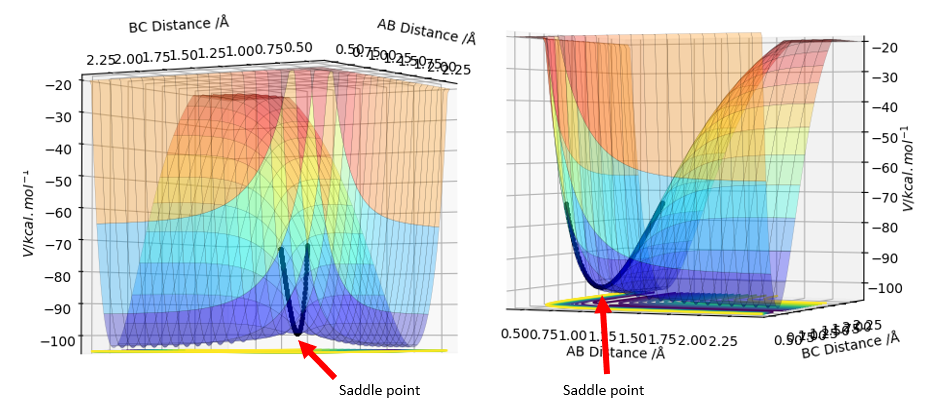
The transition state is the saddle point on a Potential Energy Surface plot.
We can determine if a point (x,y) is a saddle point using the Hessian matrix.
Using the determinant of the Hessian:
• if det(H)>0 and fxx(x,y)>0, then the point (x,y) is a local minimum
• if det(H)<0, then the point (x,y) is a saddle point
This is correct but you should also mention that the gradient is zero! A point without a zero gradient on the Hessian with Det<0 is not necessarily a saddle point. Pu12 (talk) 18:00, 4 June 2019 (BST)
Locating the Transition State
Using initial conditions r1=r2=0.7, the following PES was obtained:
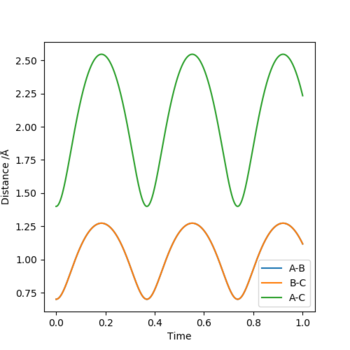
A plot of internuclear distance against time is as shown:
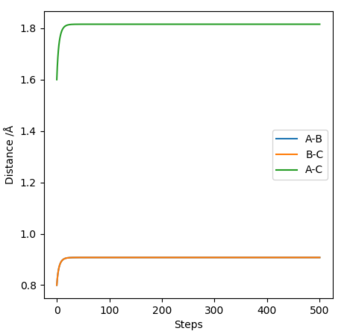
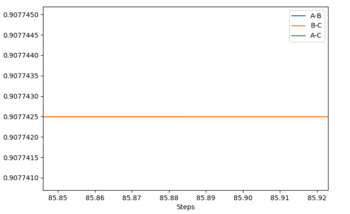
To find the transition state geometry rTS, we can plot an MEP graph of internuclear distance against time. The graph is shown below, followed by a zoomed in version showing the internuclear distance at which no further change occurs. The value for rTS is therefore about 0.907742 Å.
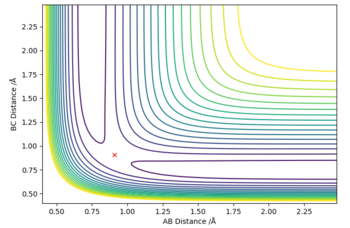
To confirm that we have indeed found the transition state, we can plot a contour surface plot. This is shown below. Without zooming in, we see that the position of reaction path is relatively constant at a point. This tells us we are quite close to the actual value for the transition state geometry. Changing the distance a little (ie changing one r value to 0.908) will cause the contour plot to deviate into the local minimums (representing reactants and products), thus indicating that the value r = 0.907742 Å was very close to a saddle point, which basically is where the transition state is. Good. Pu12 (talk) 18:00, 4 June 2019 (BST)
Furthermore, the transition point is characterised by the saddle point which is where . This means the forces at the transition state must be zero. The value r = = 0.907742 Å returns forces = 0, thus confirming it is the transition state point.
Difference between MEP and Dynamics Trajectories
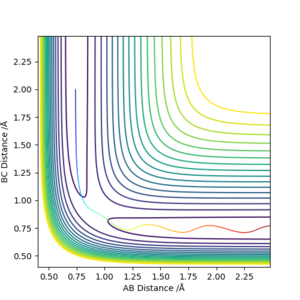
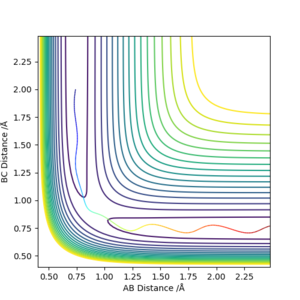
The contour plots from an MEP and dynamics are shown.
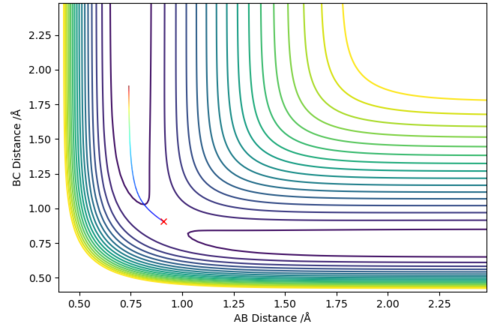
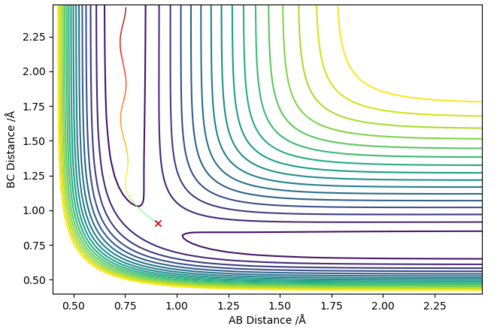
The difference is that the MEP trajectory is relatively straight whereas the dynamics trajectory is of a sinusoidal pattern. This is due to the difference in the calculation - the MEP calculation always resets the momentum to zero and therefore this eliminates the fluctuations in the particles' momentum from the vibrations/rotations/etc of the particle, hence a straight line is observed. However a very sinusoidal graph is obtained for the Dynamics method because the inertial vibrational/rotational motion has not been eliminated, and this motion manifests itself in the sinusoidal nature of the contour graph (the energies fluctuate periodically). In the graph shown, the vibration is between A and B. This is because A and B are still held together ('bonded') and therefore a vibration exists between them.
Reactive and Unreactive Trajectories
All good. Pu12 (talk) 18:00, 4 June 2019 (BST)
The main assumptions of the Transition State Theory are as follow:[1]
1. Reactants are in constant equilibrium with the transition state structure.
2. The energy of the particles follow a Boltzmann distribution.
3. Once reactants become the transition state, the transition state structure does not collapse back to the reactants.
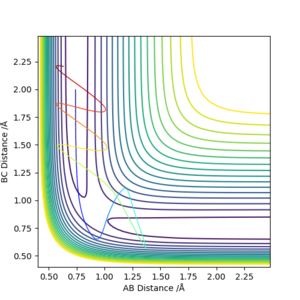
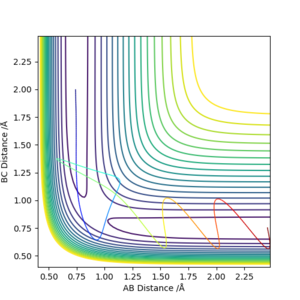
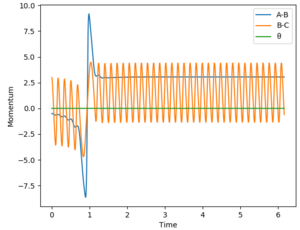
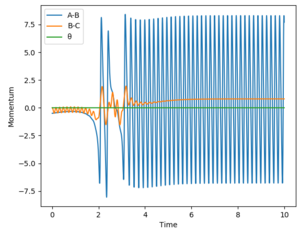
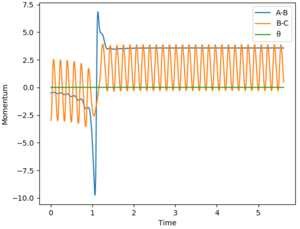
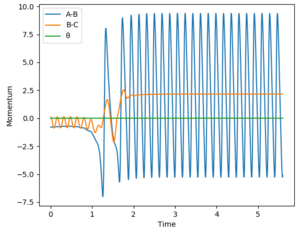
From the table, we know that not all reactions will go into the product stage - in other words, not all of the cases above are reactive. This means that despite the formation of a transition state (as seen from how the contours go to the saddle point except for the 2nd case), it does not necessarily go to the products and might collapse back to reactants as seen from Case #4. This means the Transition State Theory is not perfect and it assumes that if a transition state is achieved, then a product definitely is formed. Therefore, the Transition State Theory overestimates the reaction rates. Reaction rate predictions from the Transition State Theory will therefore be higher than what is experimentally obtained.
Exercise 2
PES Inspection

The system is set up with A as Fluorine, B and C as Hydrogen. Therefore the small BC distance minima region (ie where the cross is) is the reactants area, while the small AB distance minima region is the products area. From the contour graph, as the colours of the potential lines at the products region are a darker purple than the colours of the contours at the reactants region, A surface plot would be better here. Pu12 (talk) 18:00, 4 June 2019 (BST)
hence this indicates that the products are of a lower potential energy than the reactants. Therefore, the reaction F + H2 is exothermic. This means that the H-F bond is stronger than the H-H bond.
The converse is also true: the reaction H + HF is endothermic as can be seen from the graph above (ie the product region for this system is where the cross is in the graph above), and likewise indicating the H-F bond is stronger than the H-H bond.
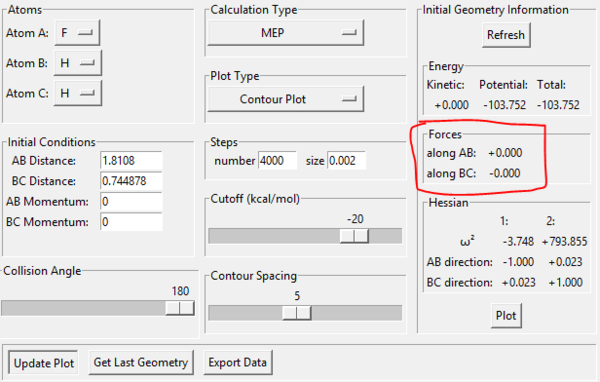
From Hammond's Postulate, since the reaction is exothermic, hence the Transition State will resemble the reactants more than the products. As such, a starting guess for the transition state position was with a smaller rBC and a longer rAB than literature values. The system was further refined until rBC=0.75 and rAB=1.8105 which gave the graph shown above. This is a good approximation for the transition state since the system does not proceed in either direction towards reactants/products; furthermore, analysis of the internuclear distance against time graph shows a relatively constant rBC=0.744878 Å and rAB=1.81080 Å, which further indicates a good approximation to the transition state geometry.
Hence the transition state for this system has geometry rBC=0.744878 Å and rAB=1.81080 Å. As outlined earlier, the system has A as Fluorine, B and C as Hydrogen. To confirm that this is the transition state, the forces at this point were examined - they should all be zero since the transition state is the saddle point, and the gradients are represented by force. This is confirmed in the image below.
Calculating activation energies

This reaction represents the energy difference between the transition state and the reactants for the forward reaction H2 + F -> HF + H.
Therefore, the Ea for this reaction is Ea = -103.752 - (-104.020) = +0.268 kcal/mol (3 d.p.).
The Ea for the reverse reaction HF + H -> H2 + F can be found by performing a small negative pertubation of rBC.
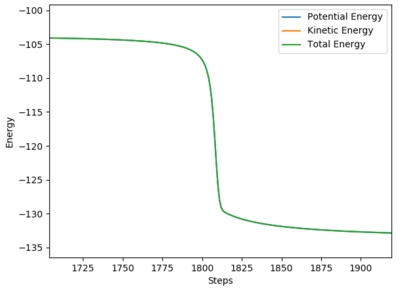
The graph above can be used to find the Ea for the reaction HF + H -> H2 + F.
From the graph, the Ea for this reaction is Ea = -103.752 - (-133.980) = +30.228 kcal/mol (3 d.p.).
Good. Pu12 (talk) 18:00, 4 June 2019 (BST)
Reaction Dynamics
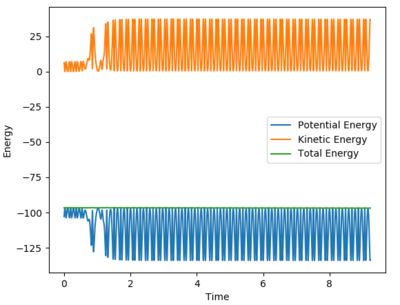
A set of initial conditions that result in a reaction is as follows:
• Atom A is Fluorine, atoms B and C are Hydrogen
• rAB = 1.8
• rBC = 0.7
• ρAB = 0
• ρBC = -2.5
The reaction has caused the potential energy in the system to decrease, while kinetic energy has increased. Based on the Principle of Conservation of Energy, it can be concluded that some potential energy prior to reaction has been converted into kinetic energy of the products. Since the kinetic energy causes the product molecule to vibrate to a greater extent than in the reactants - this statement can be inferred from the energy-time graph of the reaction which is shown below, whereby the sinusoidal amplitude of the graphs are greater, thus indicating an increase in vibrational amplitude since energy is proportional to amplitude2. Since any changes in the molecular vibrational state can be caused by changes in thermal energy, thus the increase in kinetic energy can be measured experimentally by an increase in the temperature of the reaction system.
Examining Polanyi's Rules
The Polanyi rules state that vibrational energy (rather than translational energy) is more efficient in promoting a reaction with a late transition state.[2]
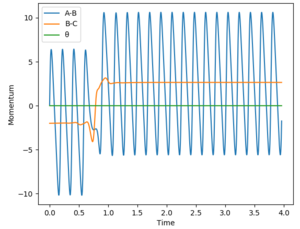
For the reaction H2 + F -> HF + H, the reaction is exothermic thus indicating that the transition state is early. Based on Polanyi's rules, this means that a reaction system that contains more translational energy will be more likely to lead to a reaction. To determine if a reaction has been successful (ie a reaction occurred), the momentum-time graph can be analysed. An indication that a successful reaction has occurred would be that vibrational energy has been transferred from reactants to products, which in this case is from BC to AB. In this case, if a successful reaction occurs, then we will see AB start vibrating as will be evident from a sinusoidal AB function in the momentum-time graph. The AB function is the blue line in the graphs.
Different parameters which tests different percentages of vibrational energy were tested. Translational energy in the system was altered via ρFH, while vibrational energy in the system was altered via рHH. A larger absolute value (sign only affects direction) means a larger energy value. This allows us to compare the vibrational/translational energies in the system, and compare it with the reaction outcomes.
The results are presented in the table below:
The reverse reaction is now tested: HF + H -> H2 + F. This reaction is endothermic, thus indicating that the transition state is late. Based on Polanyi's rules, this means that a reaction system containing more vibrational energy will be more likely to lead to a reaction. Everything in this reaction is a reversal of the previous - indication of a successful reaction can be seen from BC (orange line) starting to vibrate; vibrational energy was altered via ρFH; translational energy was altered via рHH. The results are presented in the table below:
Based on the results for the two reactions above, the following can be confirmed:
1) when there is an early transition state, a higher percentage of translational energy (ie a greater distribution of energy is translational) results in a more efficient reaction.
2) when there is a late transition state, a higher percentage of vibrational energy (ie a greater distribution of energy is vibrational) results in a more efficient reaction.
Good. Pu12 (talk) 18:00, 4 June 2019 (BST)
Top tier report, well done! Pu12 (talk) 18:00, 4 June 2019 (BST)


