MRD:triatomic systems sb1016
Triatomic systems and their Molecular Dynamics
Introduction
The study conducted below focuses on triatomic systems and their reactivity. This exercise is based on the formation of a diatomic molecule form the collision between a diatomic and a mono-atomic molecule. The characterization of their reactivity is based on the transition state in the reactive pathway and tools such as surface potential plots, contour plots, momentum comparisons are used to further understand their behavior. H + H2 system, F + H2 system and H + HF system are used for this study.
During this study, The reactant molecules are labelled A-B and the product is B-C, with C being the incoming atom.
H + H2 System
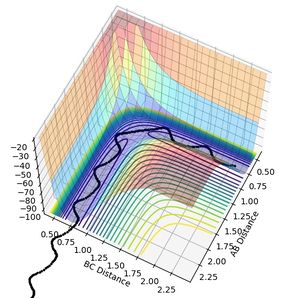
During this collision between H atom and H2 molecule, the reaction follows the path with least energy (minimum energy path). The reactive path for this reaction is shown below in figure 1.
The transition state of the reaction can be found on the surface potential plot along the minimum energy path. It is defined as the saddle point on the plot and needs to satisfy the following conditions:
- Vx = Vy= 0 (At transition state rHa-Hb rHb-Hc)
- VxxVyy- V2xy ≥ 0 (At transition state rHa-Hb rHb-Hc)
There are also two minimas on the potential surface plot.One for the reactants and one where the products have the minimum potential (most stable). At the reactant side, the minima can be found where dv/drab =0 and the one near the products can be found where dv/drbc =0. At the minima, the reactants and the product molecules are the most stable (with the least amount of potential energy).
Transition State
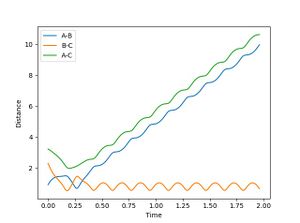
From the surface plot and the Plot of internuclear distance vs time plot, The position of the transition state can be estimates. The transition state of this system can be found when RA-B=RB-C=0.915.

It can be seen form Figure 2 that the difference between the inter nuclear distances of AB and BC do not change with time. Moreover, on the surface plot, this is represented by a single spot on the saddle point. This suggests that the particles are in the transition state and will keep oscillating if additional momentum is not provided for the reaction to continue.
Jas213 (talk) 00:26, 17 May 2018 (BST) Very nice and clear work so far. Good that you have an introduction, remember to always report values with their respective units. Figure 2 shouldn't show any oscillations though.
MEP Analysis
MEP analysis used the minimum energy pathway to describe a reaction. The MEP plot shows that the molecule follows the surface plot and travels down from the saddle point. However, in the dynamic analysis, the transition state says at the saddle point and the reaction does not proceed until additional momentum is provided.
| MEP | Dynamics |
|---|---|
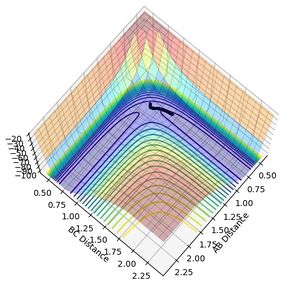 |
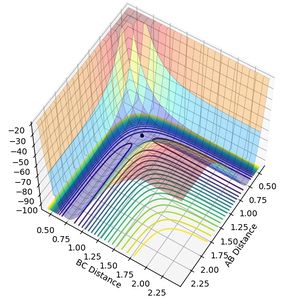 |
Jas213 (talk) 00:28, 17 May 2018 (BST) What's the difference between MEP and Dynamics?
Reactive Trajectories
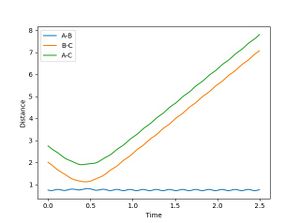
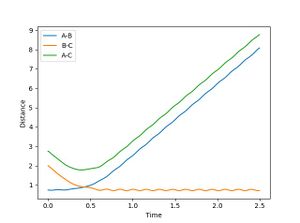
When R1 is set to R transition state (0.915) , R2 is R transition state + 0.01 (0.925) and the signs of the momenta is reversed, It can be seen that the reaction does reach completion. The reactant molecules fall back to the energy minima. This is because, the two reacting molecules are far apart to overcome the activation energy and for the reaction to occur.
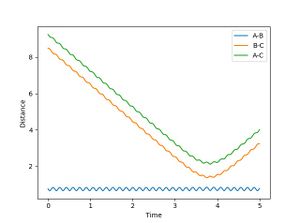
From the plot of internuclear distance and internuclear momenta plot, initial and final conditions of the reaction can be determined.
| Position | Distance | Momentum |
|---|---|---|
| R1 | 8.4853 | 2.41104 |
| R2 | 0.756366 | 1.33352 |
In the second scenario, when the initial position corresponds to the final positions of the trajectory and the momenta values have their signs reserved, once again, the product is not formed and A-B remains intact. Figure 3. shows A-B and C bouncing off each other due to their opposing momentum (very high energy collision).
The table presented below have the results for the reaction with different initial conditions.
Complete the table by adding a column with the total energy, and another column reporting if the trajectory is reactive or unreactive. For each set of initial conditions, provide a plot of the trajectory and a small description for what happens along the trajectory.
Jas213 (talk) 00:34, 17 May 2018 (BST) Very detailed description of the trajectories. Why did you not include any contour or surface plots? Then, you could have used them to describe the proportions of translational and vibrational energy present before and after reaching each TS. An overall concluding comment of what you learned from this table, would have been expected.
Transition State Theory
Transition state theory can be used in this system to determine reaction rates of fundamental chemical reactions. It considers a system where the reactant molecules are in a equilibrium-like state (Transition state) which then leads to the formation of products. However, transition state theory assumes that the the particles/molecules behave in a classical way and it does not take into account barrier crossings or recrossing. Even though the probability of these crossings are small in cases with high activation energy, in cases with lower activation energy, the results obtained from TST can be very different compared to experimental results. With respect to reaction rates, TST may predict a much lower rate as it does not take into account the effect barrier crossing or recrossing when compared with experimental results.
Jas213 (talk) 14:27, 28 May 2018 (BST) TST would predict a higher rate than experimental values, since it assumes that once you reach the TS products will form. You have seen from your experiment however that this is not always the case and you observe barrier re-crossing.
TST also assumes that the reaction path follows the lowest energy path and forms the transition state saddle point with the lowest energy. However, this may not always be true in cases such as reactions in higher temperatures. In these cases, higher energy states also also populated and TST prediction might not reflect the experimental results. TST also has limitations when predicting results for multi-step reactions with more than one intermediate.
Jas213 (talk) 14:27, 28 May 2018 (BST) Where are your references for TST?
F +H2 system
A successful F + H2 reaction would form HF and a H atom. This specific reaction is exothermic. This shows that H-F bond is stronger than H-H as more energy is released in the formation of the H-F bond than the energy required to break H-H bond.
From the dynamic and MEP analysis of F+H2 system, its transition state and activation energy can be estimates.
| Transition State | RH-H= 0.745 RH-F= 1.81 | 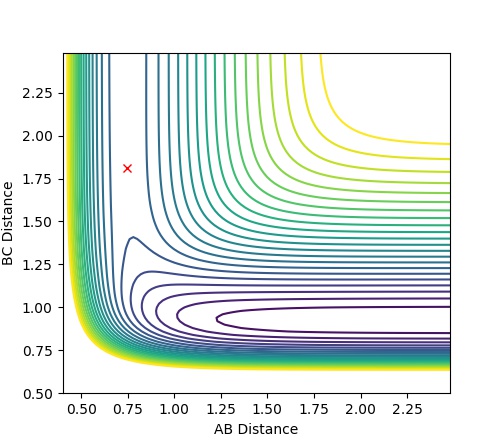
|
| Activation Energy | +29.2 | 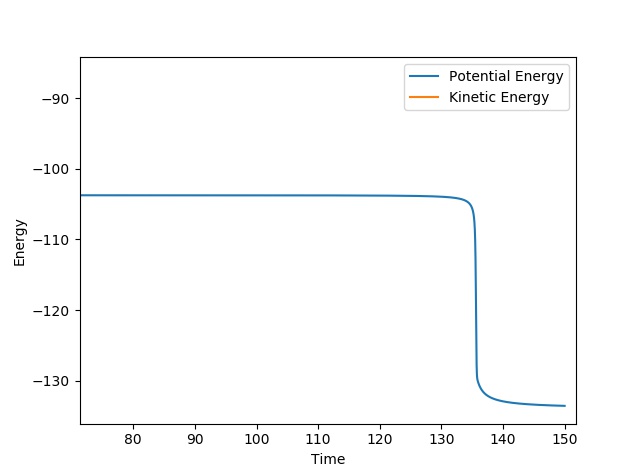
|
Jas213 (talk) 14:28, 28 May 2018 (BST) The Ea is slightly too low. Good that you give the contour plot, you could have provided a distance vs. time plot or the MEP to prove you found the TS. What are your units for r and Ea?
F + H2 Reaction Trajectories
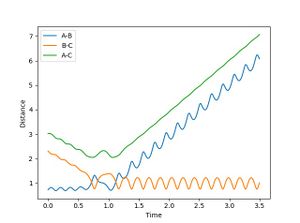
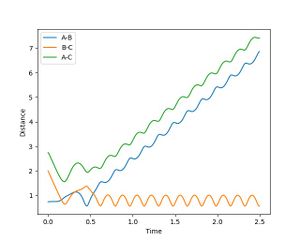
For a reactive trajectory of F and H2, the plot of internuclear distance and internuclear ,momentum plot is given in figure 4 and 5 respectively. Given that energy is conserved, this reaction is exothermic. This reaction could release energy as heat (kinetic energy) which could be calculated by the increase in temperature during the reaction. This reaction could also conserved energy by population higher vibration modes of the product (this can be seen in figure 5 where the product has a much higher momentum than the initial reactants). This could be identifies by carrying out IR analysis.
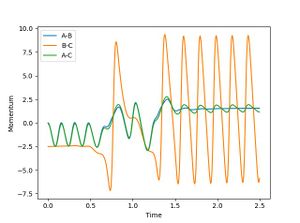
Momentum and Energy Analysis
Results from different initial conditions are outlines below where RHH is 0.74 and PFH is -0.5.
| # | PHH | Reaction | Trajectory | Comment |
|---|---|---|---|---|
| 1 | -3.5 | Success | 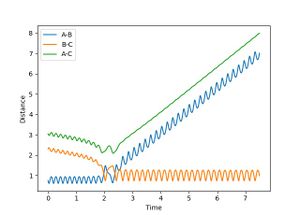 |
Reaction reaches completion after initial barrier recrossing. This is because H-F has enough momentum/energy to re-cross the barrier. |
| 2 | -3 | Fail | 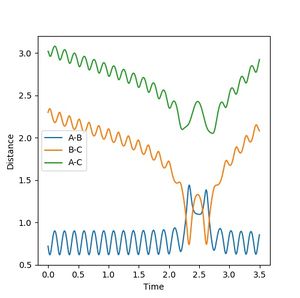 |
Reaction fails, as unlike reaction 1, 2 does not have enough energy to re-cross the barrier to form the products. Jas213 (talk) 14:32, 28 May 2018 (BST) This is reaction 2 in your table? What do you mean? |
| 3 | -2 | Fail | 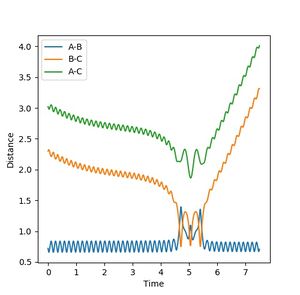 |
Similar to reaction 2 |
| 4 | -1 | Fail | 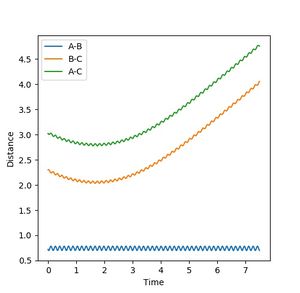 |
When F approaches H-H, they bounce off each other as they do not have enough energy to reach the transition state and cross the energy barrier (activation energy). |
| 5 | 0 | Fail | 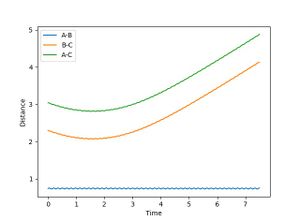 |
Similar to reaction 4. |
| 6 | 1 | Fail | 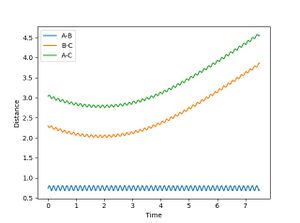 |
Similar to 4 and 5. |
| 7 | 2 | Fail | 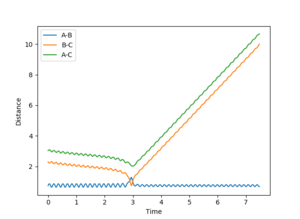 |
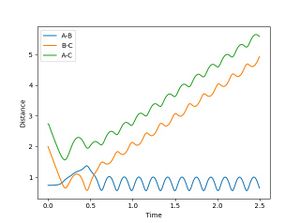
Reactants have enough energy to reach the transition state, however due to barrier recrossing, the reaction does not take place. |
| 8 | 3 | Fail | 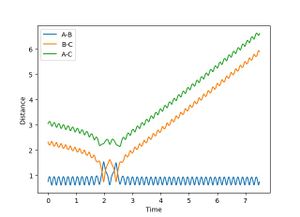 |
Similar to 7, however, the system crosses the energy barrier but at the ned, reverts back to the original state. |
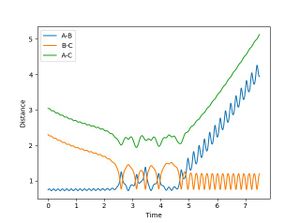
Jas213 (talk) 14:35, 28 May 2018 (BST) Good that you provide an overall conclusiong/comment on your table. However I think contour plots in addition or instead of distance vs. time plots would have been beneficial. Even though in most of the cases illustrated in the table, there is significant energy in the system, the reaction does not always follow through to the products. This maybe due to the barrier recrossing which occur due to the high energy on the H-H vibrations.
The results for the same initial conditions with PHF = -0.8 and PHH = 0.1 is illustrated in Figure 6. In this case. HF momentum is slightly increased, with a significant reduction in the momentum along HH vibration.
It can be seen from Figure 6. that the reaction is a success, even though there is very small amount of momentum in the vibrational modes of the system. It can also be seen that there is a lot of barrier crossing and recrossing in this reaction trajectory.
HF+H System
A successful HF + H reaction will lead to the formation of F and H2. This is an endothermic reaction where breaking the H-F bond requires more energy than that released from the formation of the H-H bond. This shows that H-H is the weaker bond. The transition state and the activation energy for this reaction are given below. The activation energy for this reaction is very low.
| Transition State | RF-H= 1.81 RH-H= 0.745 | 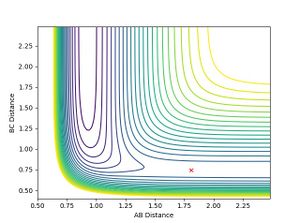 |
| Activation Energy | +0.019 | 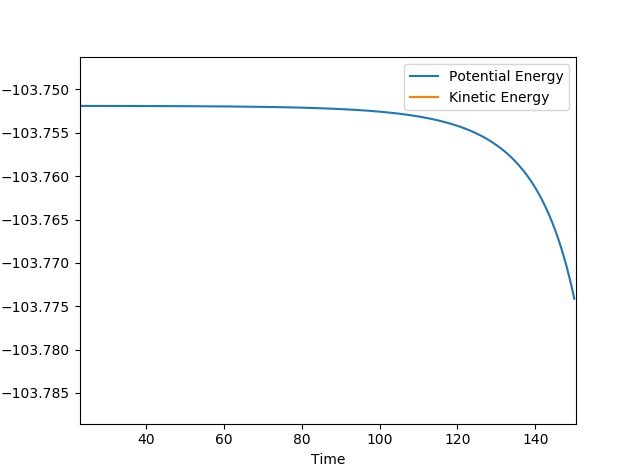
|
H+ HF Reaction Trajectory
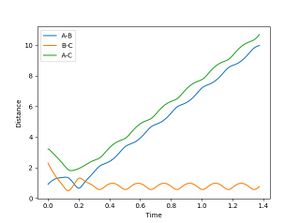
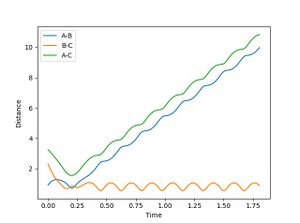
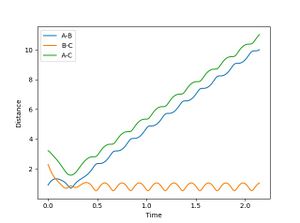
The results for some initial conditions are outlined below. The HH momentum is being decreased, while HF momentum is being increased.
| # | PHF | PHH | Reaction | Energy | Surface Plot | Trajectory |
|---|---|---|---|---|---|---|
| 1 | 0.0 | -10 | Success | -33.880 |  |
 |
| 2 | 0.2 | -9 | Success | -51.059 |  |
 |
| 3 | 3 | -7 | Success | -59.059 | 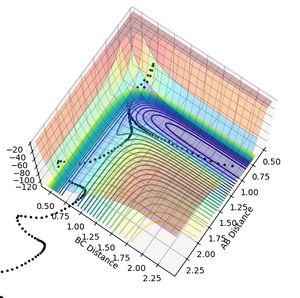 |
 |
| 4 | 5.5 | -5.5 | Success | -57.459 | 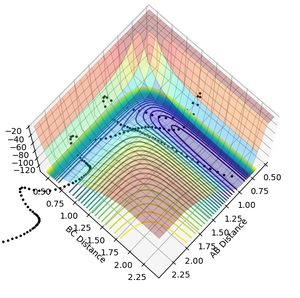 |
 |
It can be seen that down the table, the amount of barrier crossing and recrossing is reducing. This could be because the product H-H does not have enough energy to recross the energy barrier. It can also be seen that on average, the total energy of the system reduces down the table. This shows that energy in the system needs to be along the right vibration and translation mode for a reaction to reach completion. Even though in test 1 and 2, the product momentum is quite high, there is a lot of barrier recrossing in the reaction pathways. This is because, the vibrational modes are not populated in the most effective way for the reaction to reach completion.
Jas213 (talk) 14:39, 28 May 2018 (BST) "the right vibration and translational mode", here you should have stated explicitly what you need for a late barrier and early barrier reaction. You could have paraphrased Polanyi's rules here. It's a shame that you didn't have a look into the literature and stated some references.
It can also be seen from the surface plots that the reaction does not always follow MEP and this is mainly due to higher vibrational and translation modes being population. Moreover, This population of higher states also reduces the efficiency of the reaction.
In addition, as mentioned earlier, TST assumes that a reaction always follows the lowest energy path, however, as in this reaction, it does not, the estimate for the transition state is not highly accurate according to transition state theory. Becase of this population of higher modes, the position of the transition state is also pushed higher up the potential surface.
Conclusion
In conclusion, triatomic molecular simulation and dynamics analysis is an effective tool to understand a reaction or molecular behavior. It can even be used to study reaction rates and other properties. Further investigate into four atom system should also be conducted to better understand phenomenons such as barrier recrossing, momentum dependence of a reaction etc.


